Monday flow check for July 10th

Vanna still seems to be out on vacation so we're digging in the toolbox for more data. Earnings season is coming along with the Fed interest rate announcement. Buckle up! 💺

Very little changed since last week for options positioning on TSLA and AMD. Here is a really quick update:
- Both TSLA/AMD still have bullish vanna aggregate curves, but both have weakening vanna
- TSLA's vanna curve looks stronger than AMD's
- AMD's gamma is still weak and looks to pin price between $110-$120
- TSLA's gamma remains very weak but it provides support around $270 and very light resistance from $275-$300
But first:
All investments come with significant risks, including the loss of all capital. Please do your own research before investing, and never risk more than you are willing to lose. I hold no certifications or registrations with any financial entity.
Let's take a look through the rest of our toolbox on options flows to see if we can make any other predictions.
VIX
One notable development from Friday is that VIX calls began selling off on aggregate at a rate large enough to show up on the five day flow:
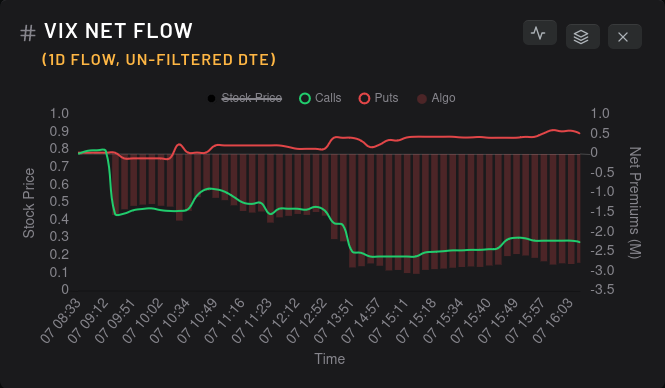
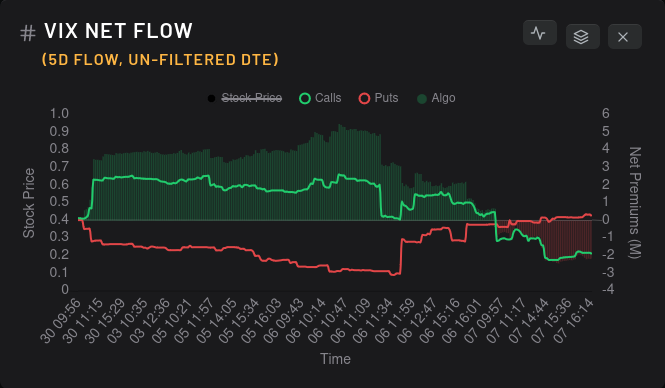
For stocks with bullish vanna curves like TSLA and AMD, this is a welcome sight. However, I haven't seen put volume tick up much yet. This could be a removal of contracts for hedging or a reluctance to bet on VIX increasing past its current level of about $15.50 pre-market on Monday.
TSLA
Much of the TSLA chatter over the past month was the bets being made on the $300 strike. Although those bets have ebbed and flowed since then, we can examine TSLA's options flow for some other clues:
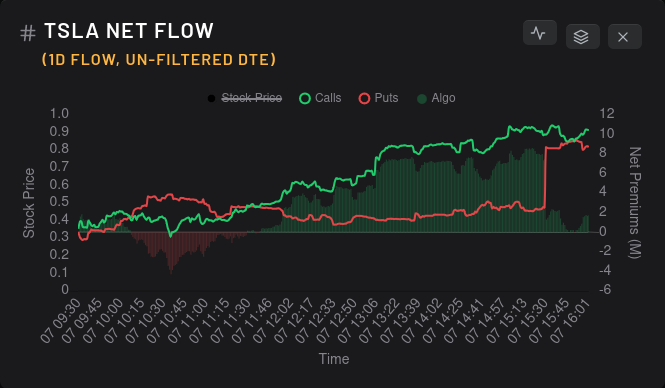
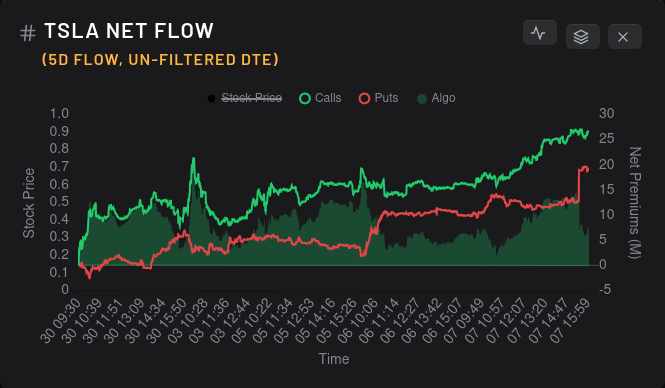
Friday saw a big spike in put flow, but this could have been 0 DTE traders trying to cash in on an expected end of day drop. Most stocks fell hard just before the market closed on Friday, likely as market makers unwound their contracts for the week. The five day flow makes me think that Friday's late afternoon price action was a singular event and likely won't continue this week.

Dealers are still long TSLA on aggregate and this still suggests that market participants are making bearish bets on TSLA.
Could these be hedges going into TSLA earnings on 7/19? Possibly.
Could these be bets that TSLA has had too much of a run-up and will need a correction. Possibly.

Dealer open interest shows a fairly bullish outlook for TSLA through next year with some speed bumps in July/August. (Remember that the colors here are for dealers, so you need to flip them for market participants.)
However, note that the x-axis is quite small. I was getting accustomed to seeing over 3M in dealer deltas for multiple expirations back in May. This leads me to put a little less faith in this OI chart.
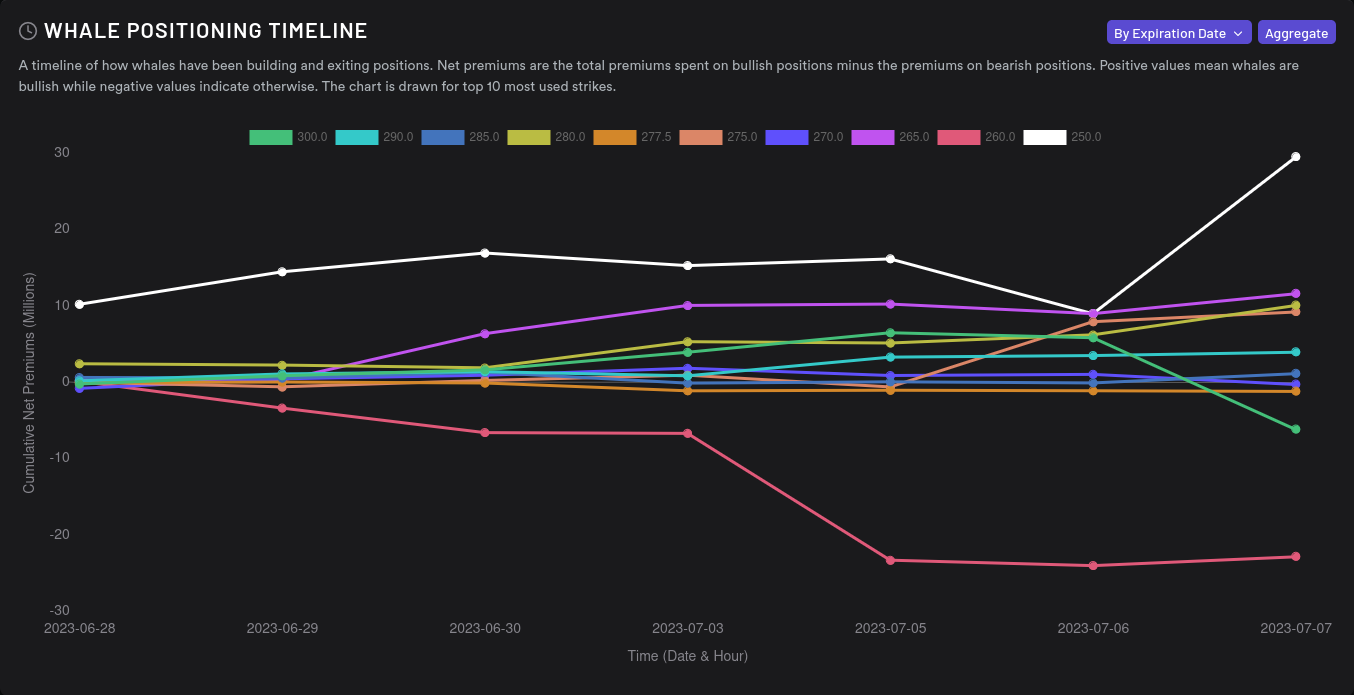
Some of the biggest bets on TSLA have soured on $260 and $300, but $250 caught some bullish bets. Perhaps $250 is seen as a pretty good support level by traders.
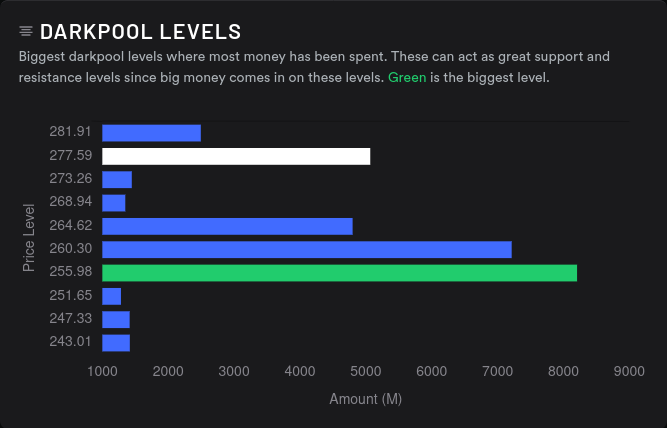
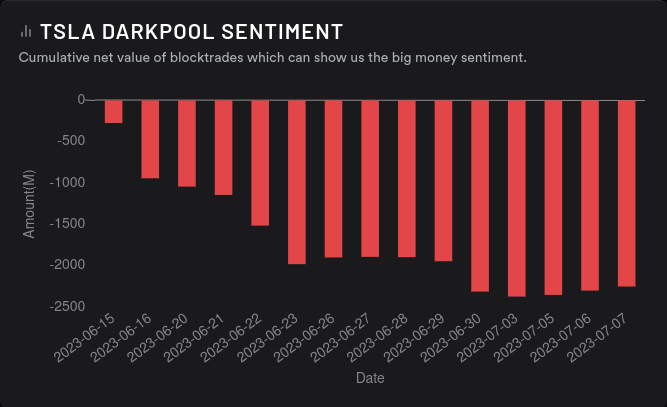
I don't put a ton of faith in dark pool trades, especially with the growing evidence that Citadel makes dark pool trades based on PFOF (payment for order flow) trades. However, We see a ton of volume at $256 with a bearish sentiment that seems to have leveled off.
Both of these data points correlate with the dealer greeks buildup we saw earlier as well as the big options trades turning bullish on $250. Will we make it to $300? Not sure. Is $250 a key level to watch? Definitely.
AMD
On the macro side, AMD is dealing with a big run up in May, supply challenges from China, and a sinking consumer laptop/desktop market. Let's see how the flow looks:
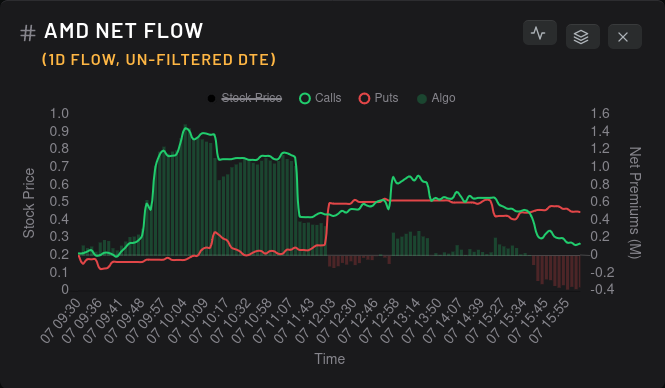
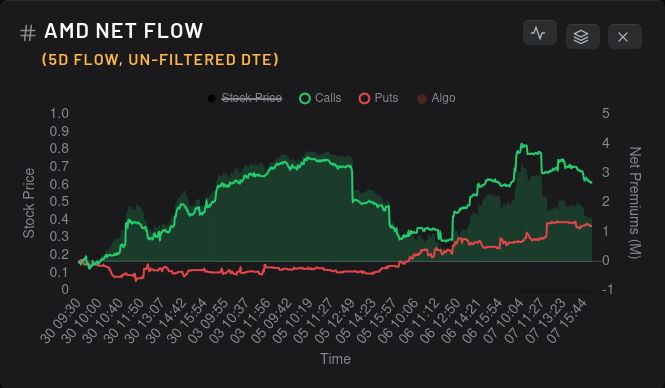
Friday was certainly an oddball, but there's been a decent amount of bullish bets on the five day chart.

This is a 15 day momentum chart, so note that dealers have been consistently picking up more bullish contracts for a few weeks. That means market participants are likely buying puts or selling calls – and that volume is steady.
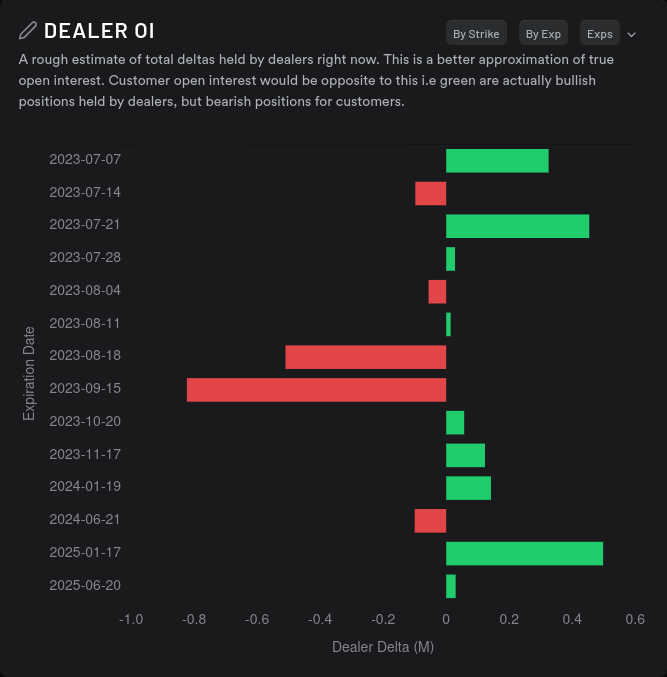
Dealer open interest can best be summarized with an emoji: 🤷♂️
Nobody is taking a firm stance in either direction at the moment. AMD earnings are coming up on August 1 and although it usually has a pre-earnings run-up, it's already run up so far that there might not be enough liquidity left. I see big resistance zones for AMD at $118-$120 and $130-$132.

The traders making big bets on AMD have gone bearish on $115 and $140, but the $120 level is seeing some very recent bullish action. $115 shows up bearish for the first time on the 8/18 expiration, so the $115 and $120 are both looking bullish through 7/21.
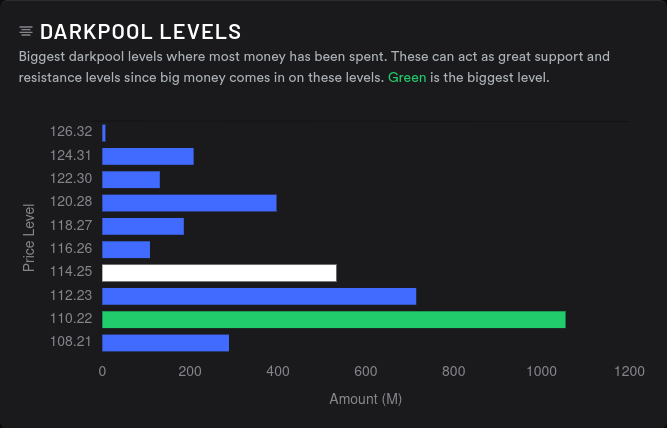
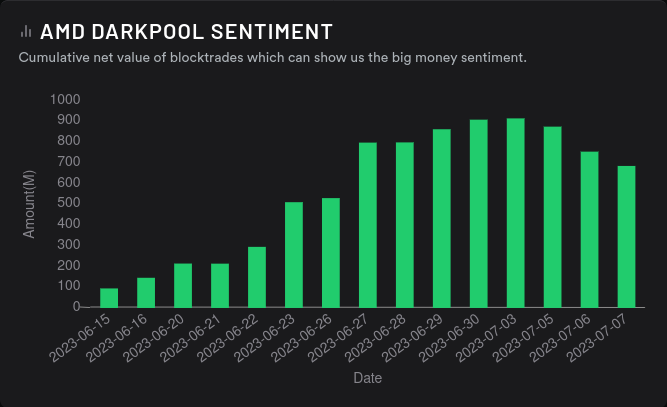
Dark pool data shows bullish sentiment for AMD that is beginning to turn bearish. We have tons of volume from $110-$112. That makes sense as AMD has bounced between $108-$115 for a while.
Thesis
With weakening bullish vanna, dealers going long, and a breakdown of short term technical indicators on TSLA and AMD, I'm a bit wary of making bullish bets in the short term. I reduced my cost basis on both stocks Friday by selling some fairly conservative 7/21 covered calls.
I'm not bullish on either TSLA or AMD through 7/21 and I'm cautiously optimistic as we approach 8/18. Vanna should weaken further at the end of this month just as we approach earnings for both companies and that makes predictions more difficult.
If the VIX can drop in a meaningful way (I want to see more long puts), I might change my tune to be a bit more bullish.
Good luck! 🍀
Discussion