Morning Market Look 6/28

As the US thinks about curbing exports of chips to China again, I'll take a look at the broader market and a brief look at AMD and TSLA.

This morning started with some unwelcome news for semiconductor stocks:

AMD was already struggling after the May 5th rally and this certainly hasn't helped in pre-market trading.
All investments come with significant risks, including the loss of all capital. Please do your own research before investing, and never risk more than you are willing to lose. I hold no certifications or registrations with any financial entity.
Let's take a look at the broad market today.
Market breadth
One way to look at market performance is to examine how many stocks in the S&P 500 are above their 50 and 200 day moving averages:
- Stocks over their 50 day moving average: 63.2% ⬆️
- Stocks over their 200 day moving average: 59.2% ⬆️
Also, the SPX (S&P 500 index) is sitting around 62.1% on the 14 day RSI. SPXEW (SPX equal weight, where every stock gets an equal weight in the index) is around 60.5% RSI. This shows that some of the largest components of the S&P 500 (TSLA, AAPL, MSFT, GOOG, etc) are still leading the market. More of the smaller components are trying to catch up.
Market flow
Let's take a look at the overall market options flow on 1 and 5 day timeframes from Tradytics:
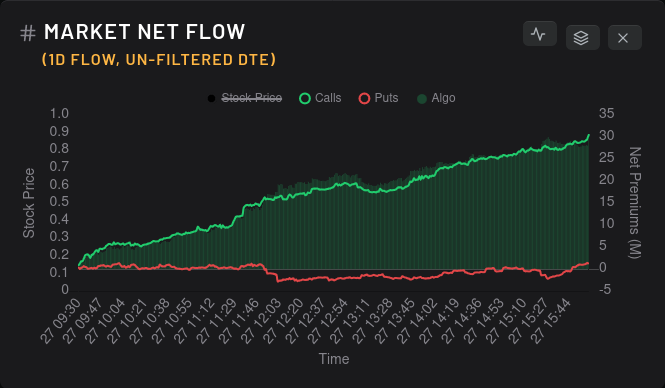
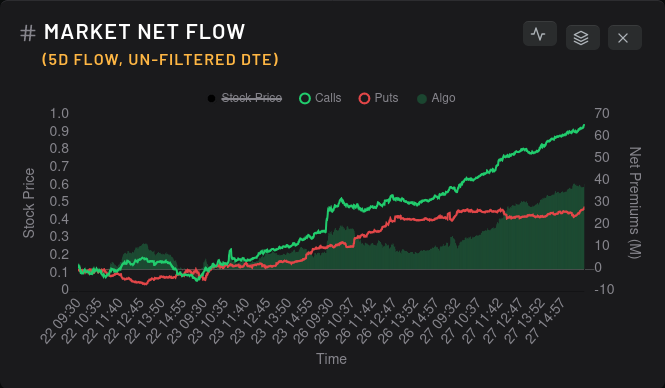
Yesterday was definitely bullish, and it still shows up on the 5 day timeframe. Put flow calmed this week and leveled off a bit.
What about the VIX?
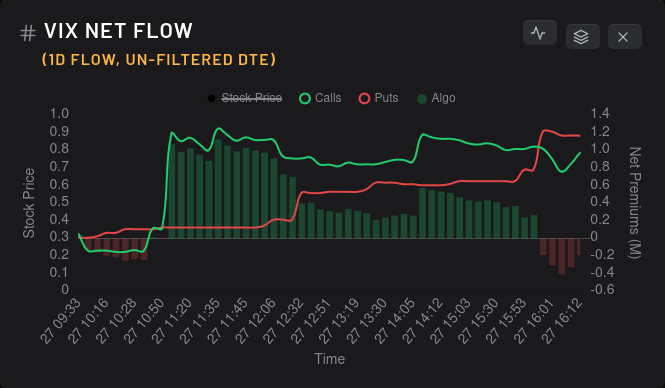
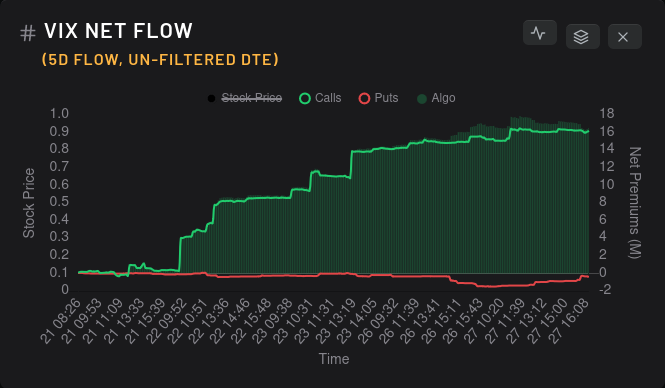
Bullish bets on the VIX ramped up over the past five days in serious numbers. This could indicate some hedging by traders against a market downturn, especially after the recent AI rally. It could also be a bet on some type of volatility event arriving soon.
An even simpler explanation could be that the VIX has been at some incredibly low levels lately. Here's a chart of the VIX over the past five years:

The big spike was March 2020 from COVID. The VIX sits at $13.79 at the time of writing and we haven't seen volatility this low since before the pandemic. There are two schools of thought that I've heard about the VIX recently:
- VIX is low and will move lower because much of the threat around interest rates and the effects of the pandemic are effectively gone. Sure, the Fed might make more adjustments to the rate at some point, but most are betting that the biggest moves are in the past.
- VIX is low, but it can't remain this low. (What goes down must go up.) Potential volatility events, such as military conflict, US/China relations, or a housing crisis could set off abrupt price changes.
Volatility does spike frequently and it does seem like putting some bets on some kind of spike in the near future makes some sense.
How does this affect AMD & TSLA?
AMD and TSLA are two of my favorite stocks to trade and increasing volatility doesn't look good for bullish moves in either stock.
Two things are happening right now:
- Vanna is weakening in this very low IV environment. I was growing accustomed to seeing $1-2B on individual strikes for vanna on TSLA, but I can't find one bigger than $714M this morning. That's a huge drop.
- Gamma is gaining an effect on price but the effects are more local than vanna.
This means that tracking potential dealer moves with vanna and gamma is much more challenging right now.
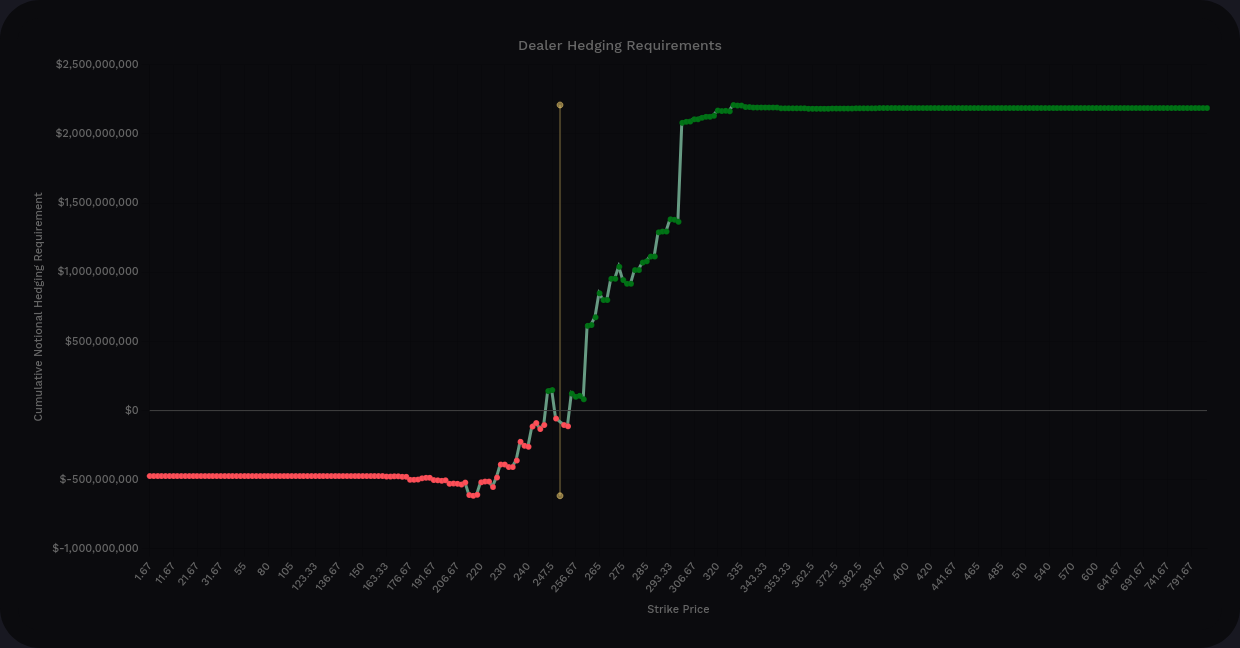
Let's compare the two vanna curves of AMD and TSLA:
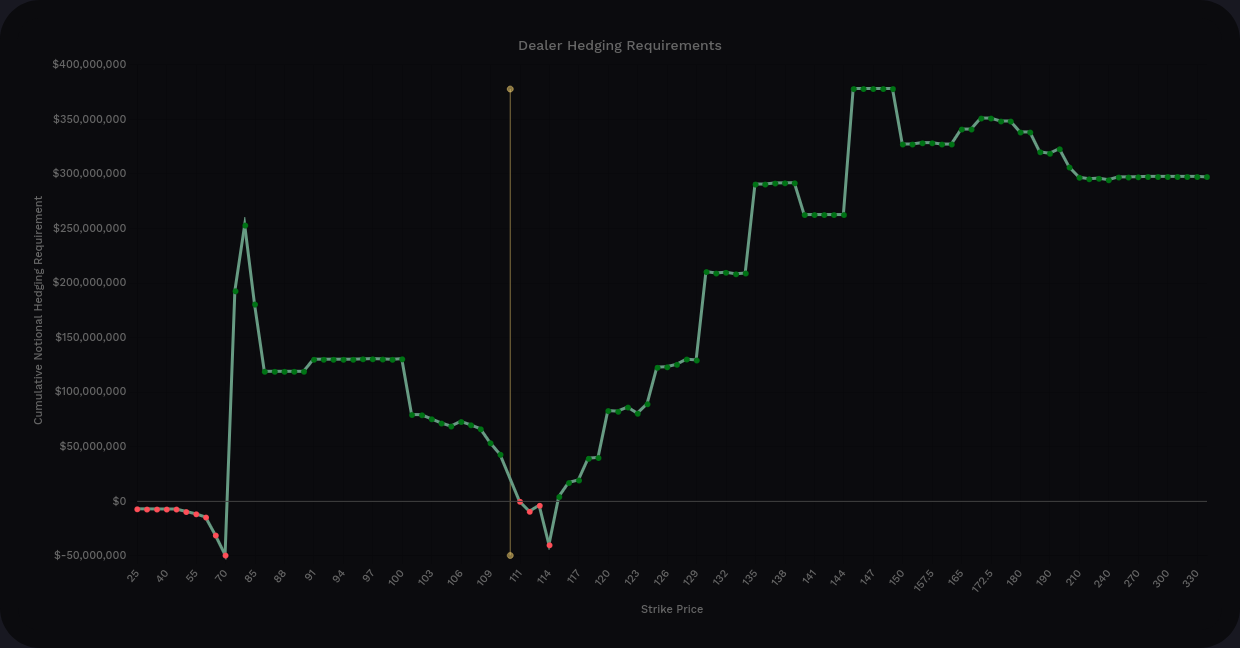
First, AMD's curve has positive vanna on both sides of the current price. That's a bearish setup with increasing IV. AMD's IV rank is approaching 59%.
TSLA's vanna curve looks a bit more healthy for bullish price movement since there's less positive vanna underneath the current price. However, it has a very positive vanna curve above the current price and that's not helpful with increasing IV. TSLA's IV is around 38%.
Dealer greeks buildup
Another thing I like to examine is how contracts are piling up on dealers. If dealers are sitting on tons of bearish contracts, then I assume customers are bullish. The oppositite is also true. Dealers sitting on bullish contracts mean customers are likely bearish.
On a 15 day momentum, TSLA's dealer greeks buildup has hit equilibrium. Customers are piling into contracts on both sides of the price. AMD's buildup looks much worse with dealer momentum being quite long for at least 7 or 8 trading days.
Thesis
Here's how I am thinking through my trades for the week:
- VIX is still seeing a decent amount of bullish bets and increasing IV isn't friendly to AMD or TSLA, but it's less friendly to AMD.
- My deltas are much too bullish for AMD, so I'm looking for a pop in price to sell some calls between $110-$115. Gamma wants to pin AMD in between those price levels for a bit and vanna looks like an enemy to bullish price movement.
- I have a similar problem with TSLA, but its vanna looks better. Gamma on TSLA is extremely tiny. Options flow on TSLA has definitely been more bullish recently than AMD, so I might sit on my hands for a while and see what plays out. TSLA's flow looks like it's positioned for a big move, but I can't tell which way it will go.
Good luck to everyone out there. 🍀
All investments come with significant risks, including the loss of all capital. Please do your own research before investing, and never risk more than you are willing to lose. I hold no certifications or registrations with any financial entity.
Discussion