MSFT analysis for 3/27

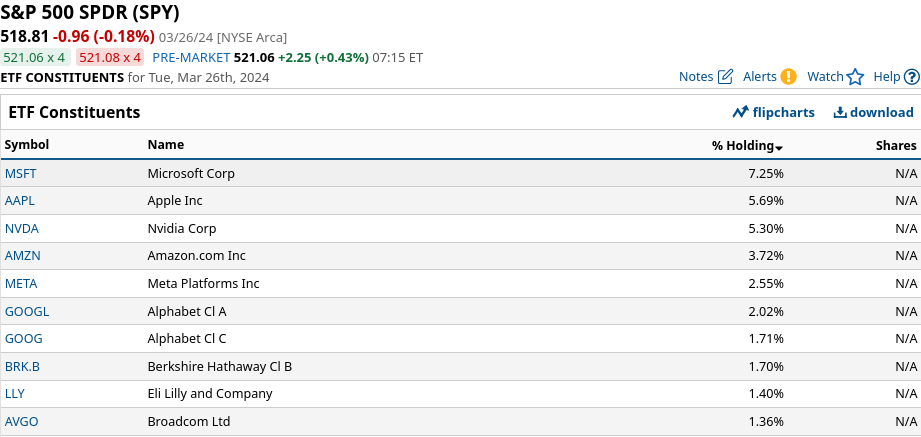
MSFT remains the king of the S&P 500, but what are the trends in play for it right now?

Hey there! 👋 Happy Wednesday and welcome back for a look at what's happening with MSFT, the most heavily weighted company in the S&P 500:
All investments come with significant risks, including the loss of all capital. Please do your own research before investing, and never risk more than you are willing to lose. I hold no certifications or registrations with any financial entity.
Let's see what we can find this morning. 🔎
Quick macro update
I don't trade commodities typically, but I like to keep an eye on some of them to get a better idea of the larger macroeconomic picture. These large forces tend to have subtle impacts on markets and crude oil is one that confuses me quite a bit.
When it comes to macro updates, I love Ilya Spivak's Macro Money segment on TastyLive:
He digs into the reasons why crude oil prices are climbing even while output is at an all time high in the US and consumption isn't at extremes. It's a great watch to better understand broad market mechanics.
Back to MSFT
Let's hit those charts. I like to get a broad view first, so here's a MSFT chart since the COVID lows:
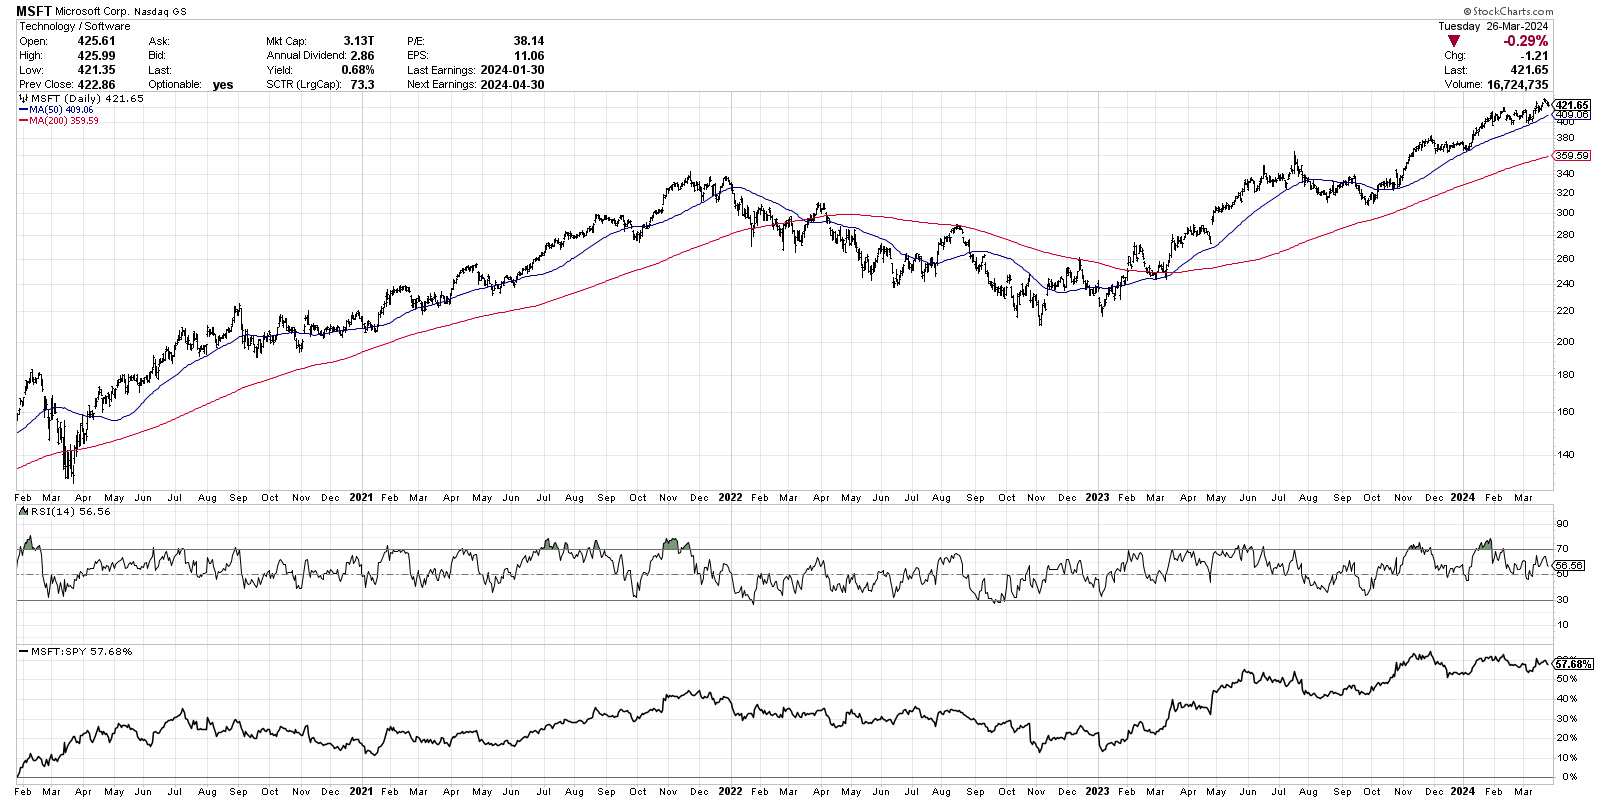
Here's what I notice immediately:
- We had a bullish moving average crossover in early 2023 and they've been a good distance apart except for a little dip in late 2023.
- Both the 50 and 200 day moving averages are strongly positive.
- RSI is middling around 56% and that leads me to think that MSFT is at a crossroads right now without a clear short term direction (medium and long term is clearly up).
- MSFT gained ground relative to SPY ever since the beginning of 2023. Its relative strength bounded upwards from about 15% to almost 60% now.
Let's drop down to a chart for the year and have another look:
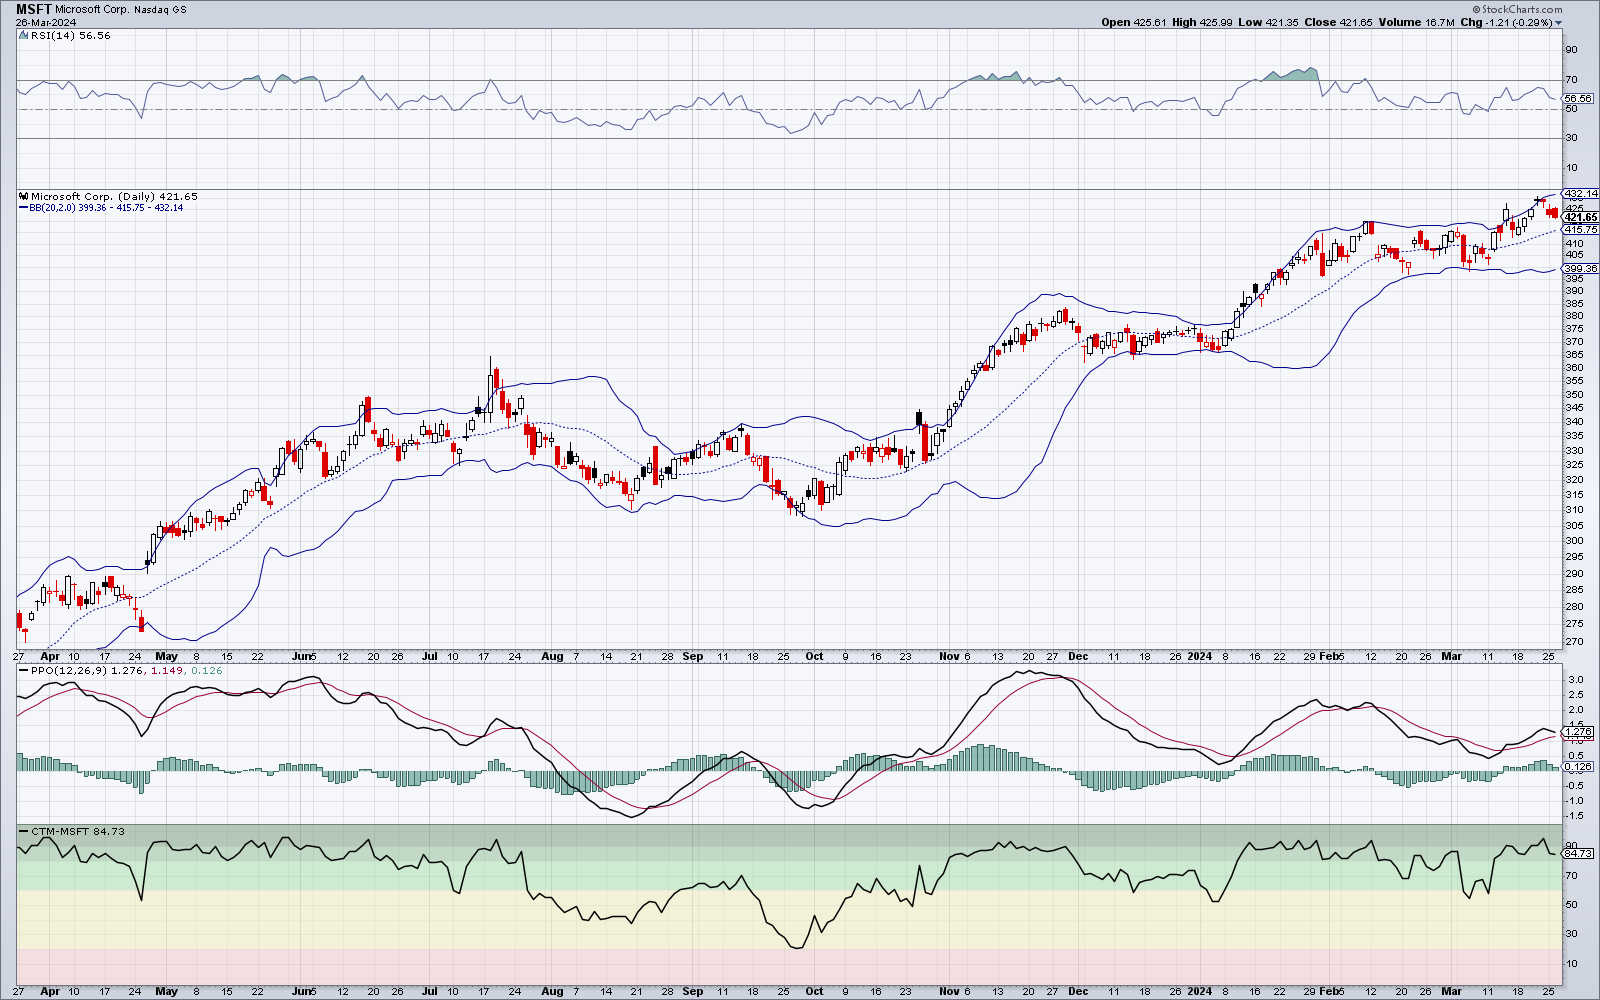
Now we have more momentum indicators on the chart to help us decipher the more recent moves:
- MSFT remains above the center of the Bollinger band but recently bumped down from the top edge of the band.
- The Percentage Price Oscillator is weakening a bit and headed towards the moving average.
- We're in a strong uptrend based on the output from the Chande Trend Meter (but this was obvious to us based on the moving averages previously.
So far, we have strong medium and longer term moves but the short term moves are a bit unclear.
Institutional trades
MSFT went through a nice consolidation in the low $400s recently and sprang out a bit higher into the $420s. The 90 day MSFT chart shows a lot of trades happening around that level, including the #5 biggest trade ever around $412:
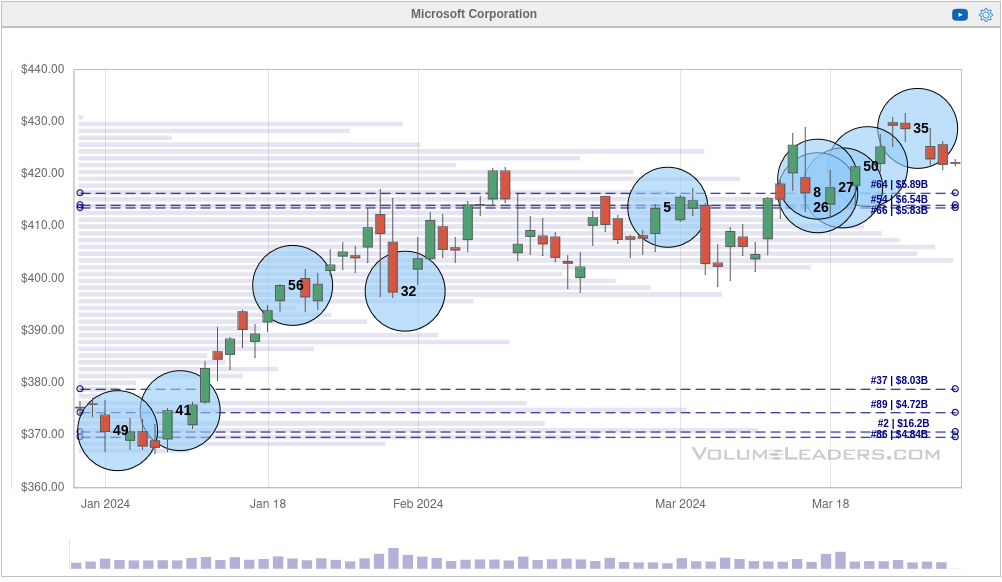
Volume Leaders allows you to filter out "closing trades". These are trades that happen just as the market closes and can often signal what big funds are trading in the market. These are helpful, but you can spot some interesting things if you remove them from the chart.
Here's MSFT since February 1st with the closing trades removed:
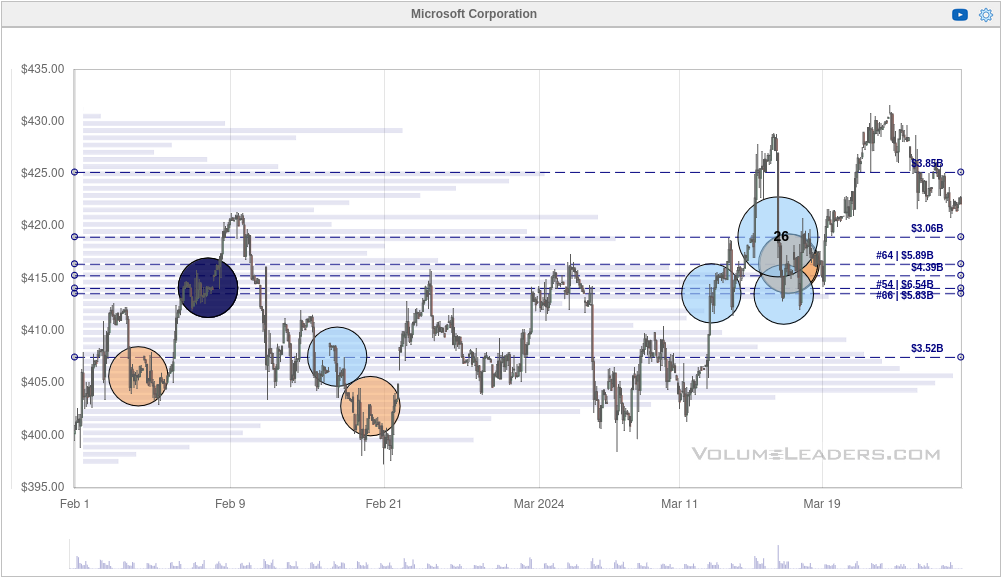
There's a significant amount of action from $400-$415 followed by some big trades around $415-$420 after March 11th. These charts don't provide directionality, but they do tell us where and when these trades were made along with how many shares were traded.
That #26 trade was around 5.6M shares traded just under $419. Some of the other trades around that area are even numbers, such as 1M or 1.5M, and this has typically been a signal of institutions buying in the past (this is not a guarantee).
This is a signal to me that if MSFT were to drop underneath $415, there's cause for concern. A drop below $405 would be a significant concern for me.
Thesis
As I said earlier, medium/long term views are definitely bullish from what I can find.
Has MSFT been on an amazing run and is it likely due for a pullback? Sure.
Do I want to fight the medium and long term trends? Definitely not.
I made a bet on the $410 level holding by selling a 5/17 $410 put last week for $7.85:
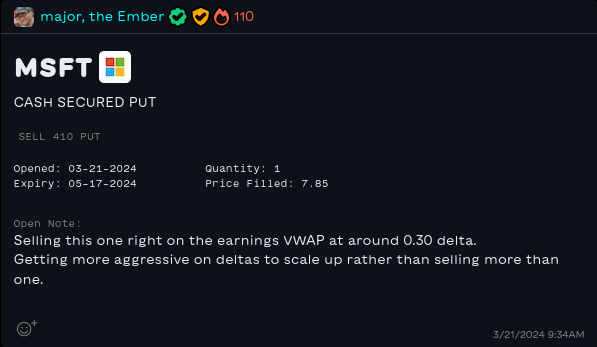
You'll note I also learned a difficult lesson about doubling up on short puts as opposed to moving my deltas a little higher. The volatility swing from selling more than one contract was something I knew about but had not fully experienced yet. I did not enjoy that.
Good luck to everyone this week. 🍀
Discussion