MSFT analysis for January 18
MSFT rolls into an earnings call on January 30 just as it became the biggest company in SPX. What's next as we hover around all time highs? 📈

Earnings are coming up for MSFT on January 30th followed by a dividend on February 14th right in time for Valentine's Day. ♥️
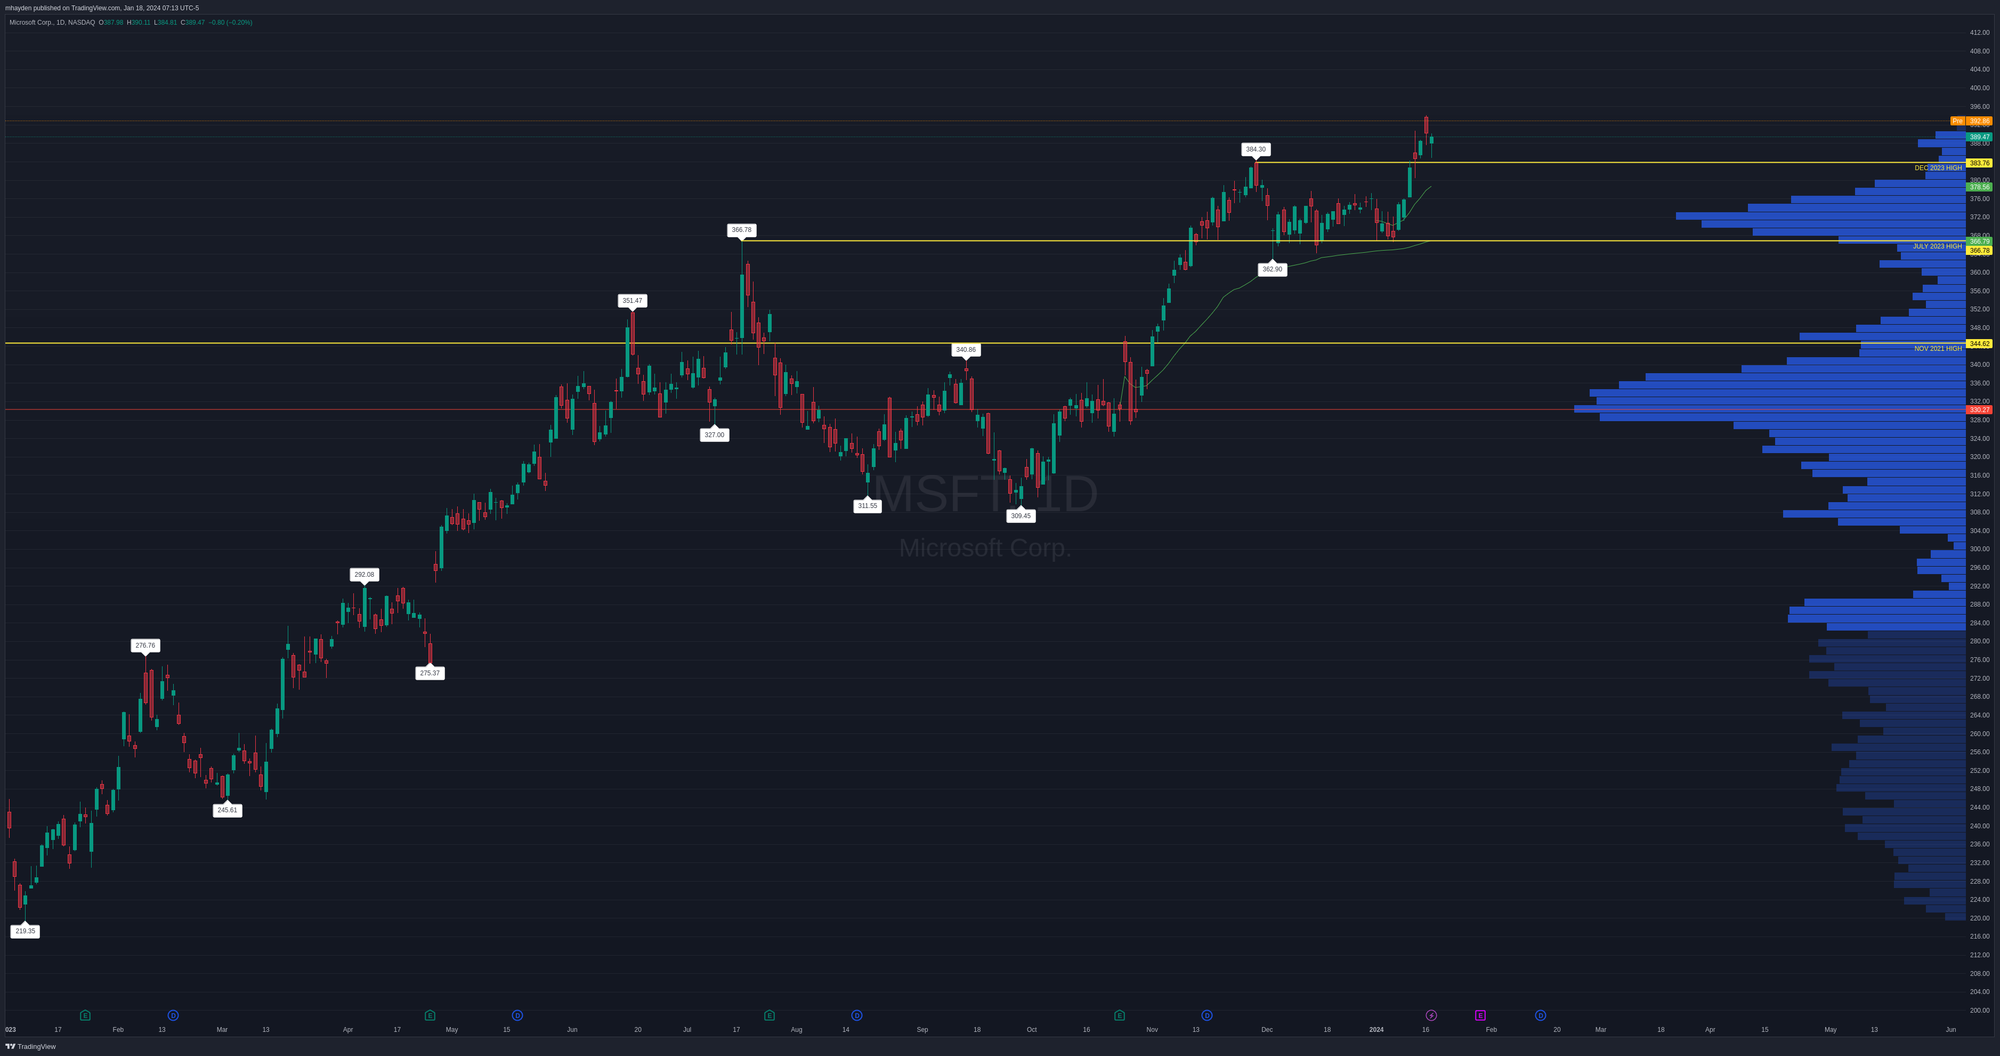
This stock has been on an absolutely incredible run from $219 at the beginning of 2023 to $392 as of this morning. It blasted out of the October lows and hasn't looked back since. Let's get a look at it today as we approach earnings.
All investments come with significant risks, including the loss of all capital. Please do your own research before investing, and never risk more than you are willing to lose. I hold no certifications or registrations with any financial entity.
Let's hit the charts!
Since January 2023
On a long term view, the majority of MSFT's volume over the past year has been between $284 and $390. The point of control (PoC) of the Volume by Price (VbP) indicator shows that most of the volume is centered around $330. That's a good level to watch in case we see a correction down from the recent highs.
One other thing to note here is that the Oct/Nov 2023 rally was done on relatively low volume. The VbP indicator doesn't have many long bars from $344 to $366, but then again, there aren't any massive gaps between candles in there either. (Compare to NVDA's chart to see a large gap.)
After blasting out of the consolidation zone from the summer and early fall, it consolidated again between $366 and $383. We've had another breakout above the December 2023 high recently and it looks like we might be coming down for a retest. Then again, MSFT is trading well above that level in the pre-market today.

Recently
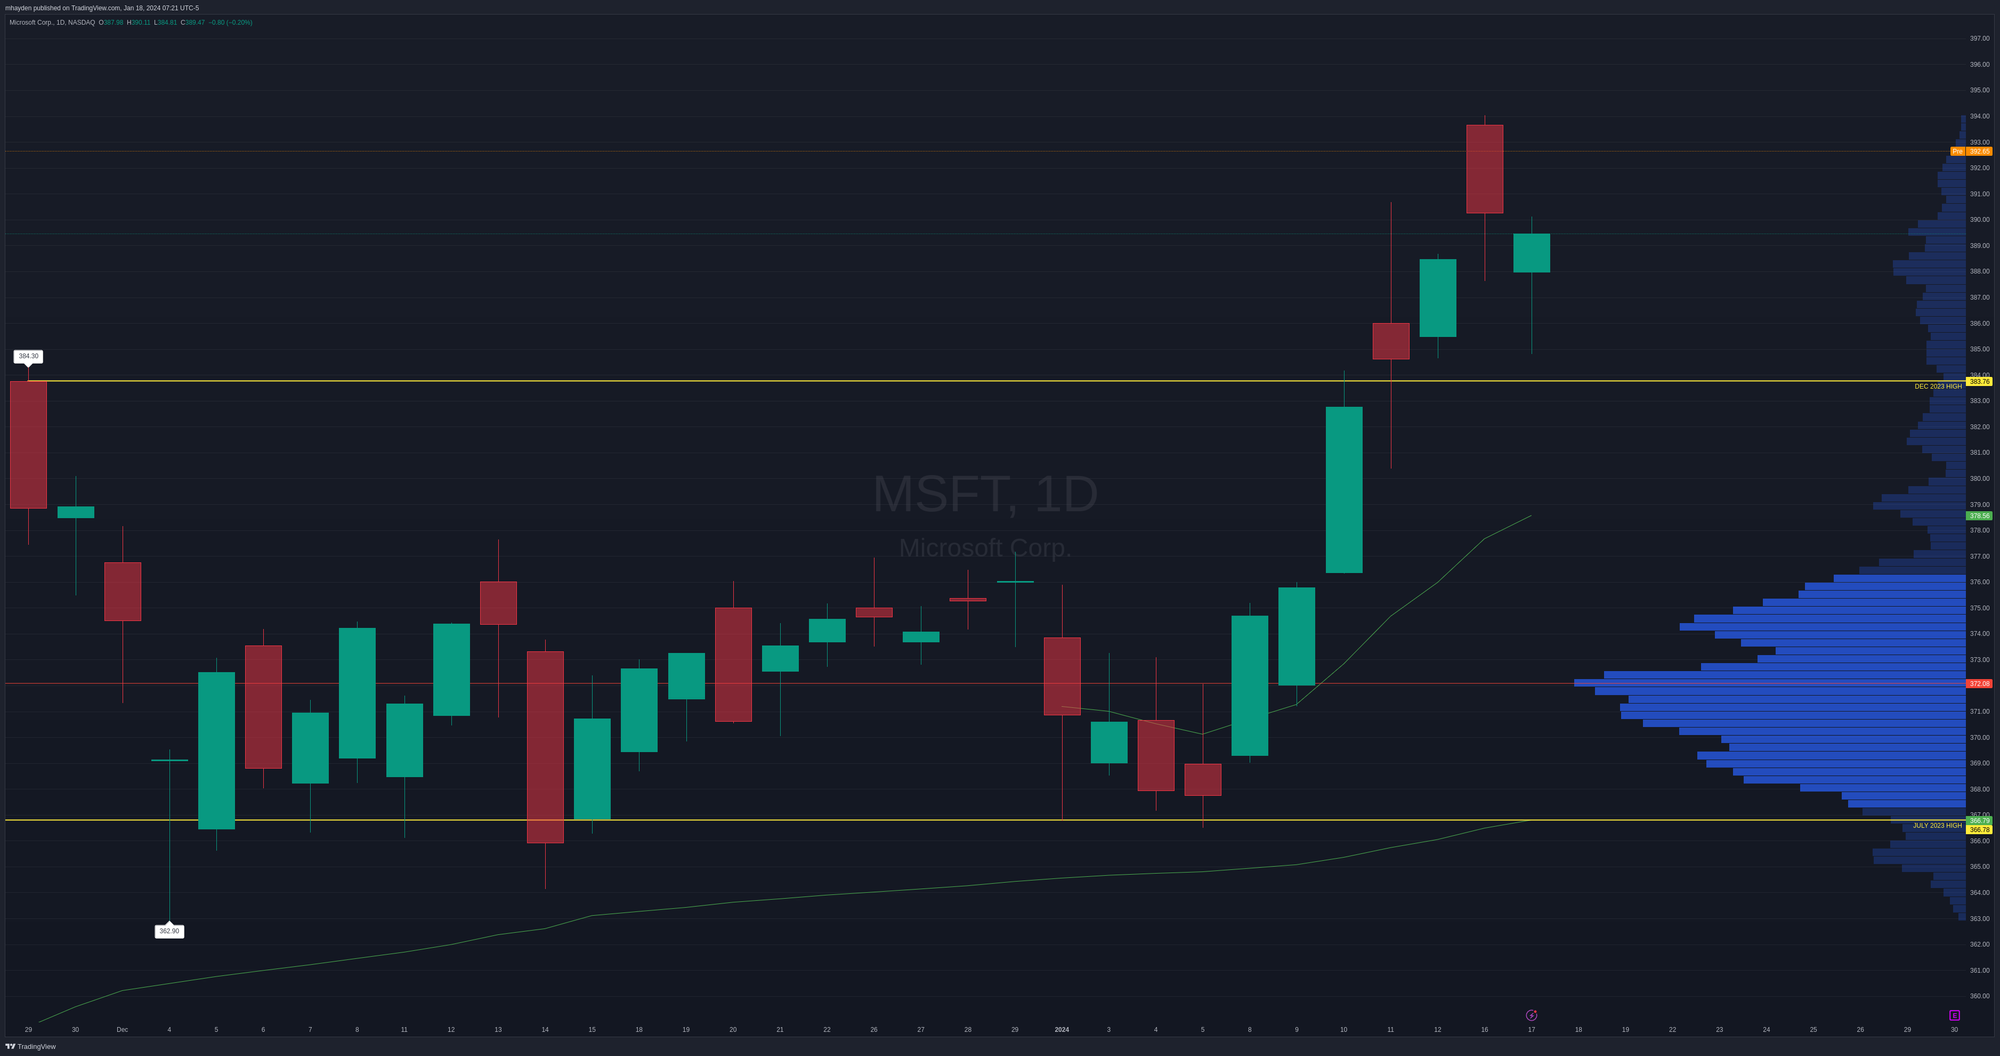
If we zoom into the price action since hitting the high in December 2023, we see a good consolidation in the $360s and $370s. All of this happened above the VWAP line from the last earnings call. MSFT remains above the year to date VWAP line as well. Our PoC sits around $372 from the consolidation we saw since the end of 2023.
My concern here is that there hasn't been a strong amount of volume above the $383 high that makes me feel confident we can hang out up here for an extended period. There's a change that MSFT might consolidate again here for another run, but I want to see how the market reacts to earnings first.

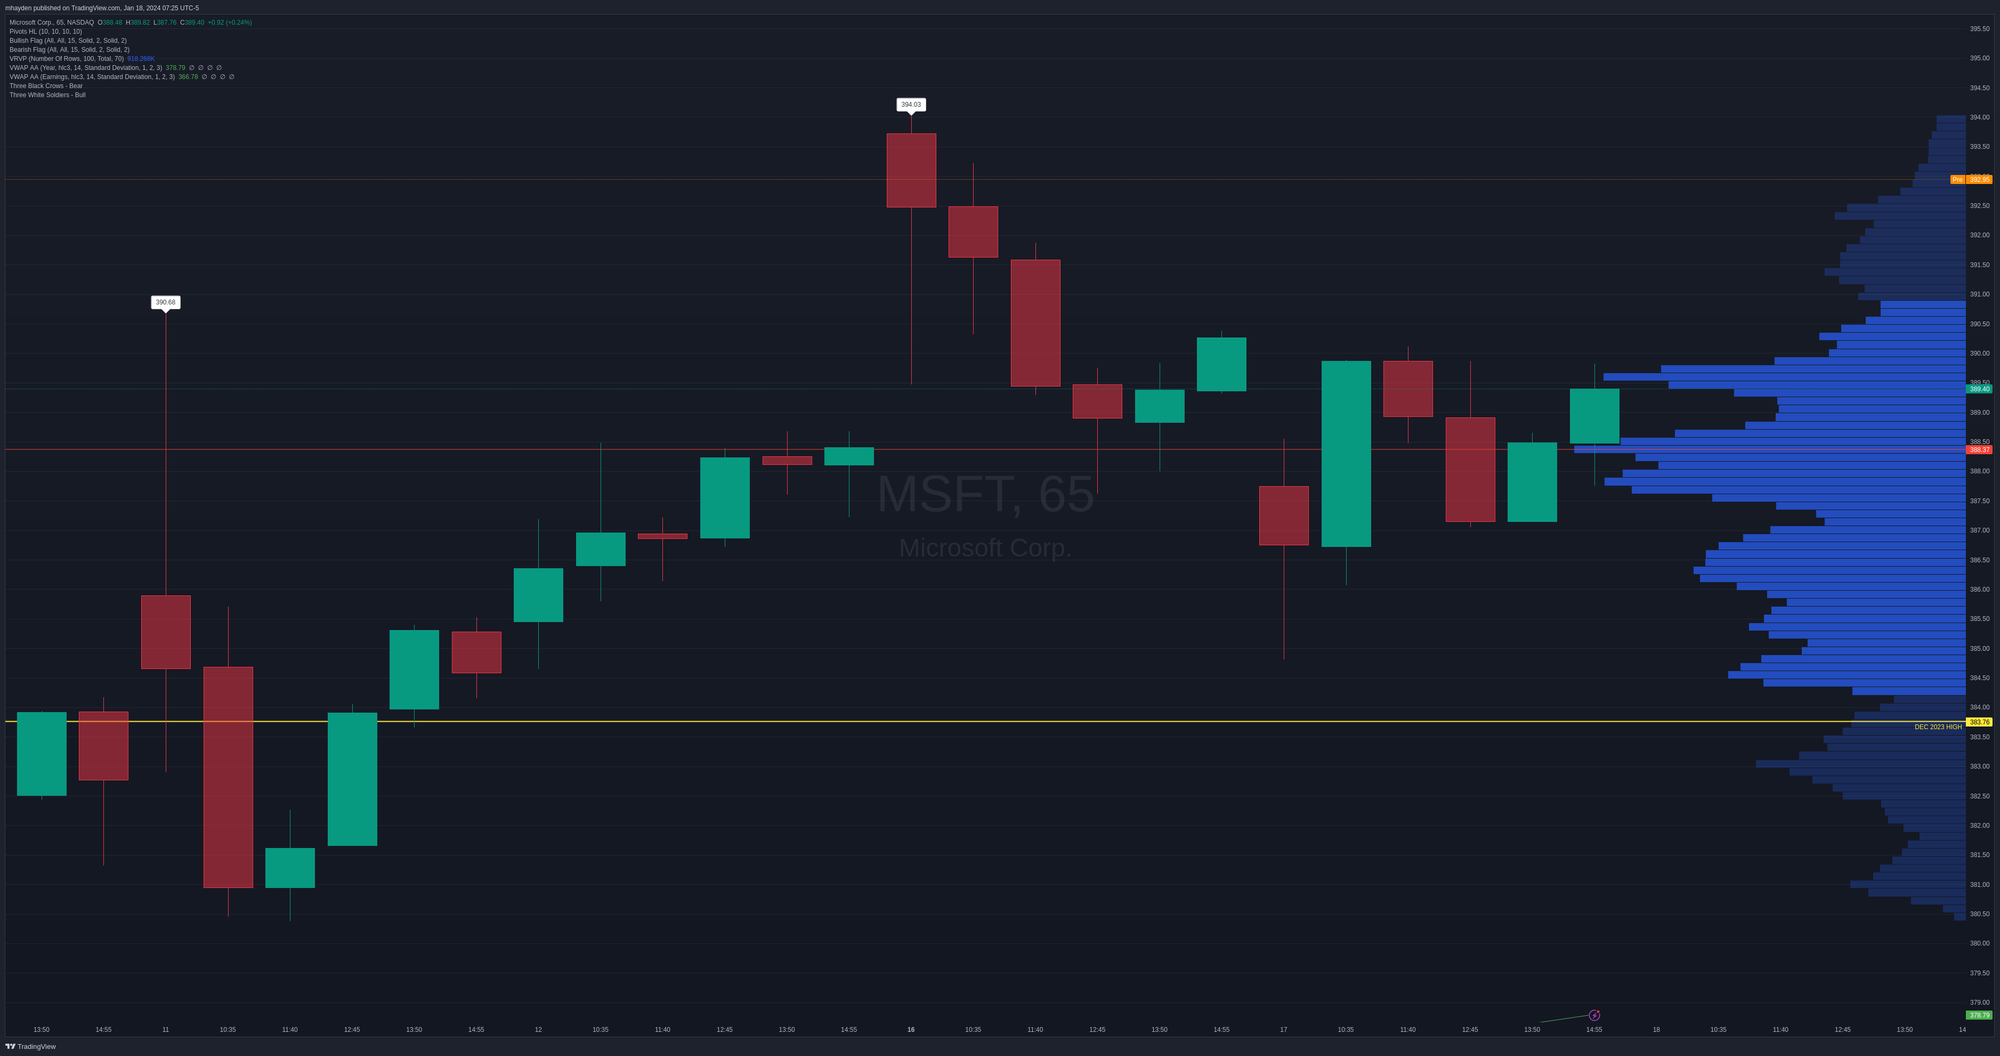
Let's drop down to a 65 minute chart so we have six equal time period bars for each day. This is a view of the price action since we closed above the December 2023 high around $383.
Much of the volume here is around $388 and the trading in the pre-market session today is already up around $393! Short term traders might want to look for trades inside the 70% volume zone from $384.50 to $391. Medium to long term traders might want to see if we retest the December 2023 highs and what the price does after that.

Institutional trades
As a reminder, institutional trading levels give us an idea of where the traders with deep pockets are making their bets. Although we cannot see the directionality or intent of their trades, knowing where they make their moves can help us know where price movement may be pulled.
Much of the volume here is centered around $324-$345. That matches up well with our chart earlier where the PoC was around $330. However, we have some new levels higher up around $370-$380.
It's a testament to just how far MSFT has come when you see that the #1 volume level for institutional traders was at $244.70. 🤯

Let's get a look at what's happening more recently. What have institutional traders been doing with MSFT since the October lows?

That's an incredible amount of volume in the $370-$380 range. 💥 This is one thing that institutions love to do. They try to quietly build a position at a big level with relatively small trades, then they send through a big one.
We had the biggest trade ever made for MSFT in mid-December and that usually signals that the stock will take off. However, it didn't move, so the institutions kept adding more to their position until MSFT broke above $380 recently.
I'll make some bets on $370-$380 being a solid level of support until proven otherwise.
Comparisons
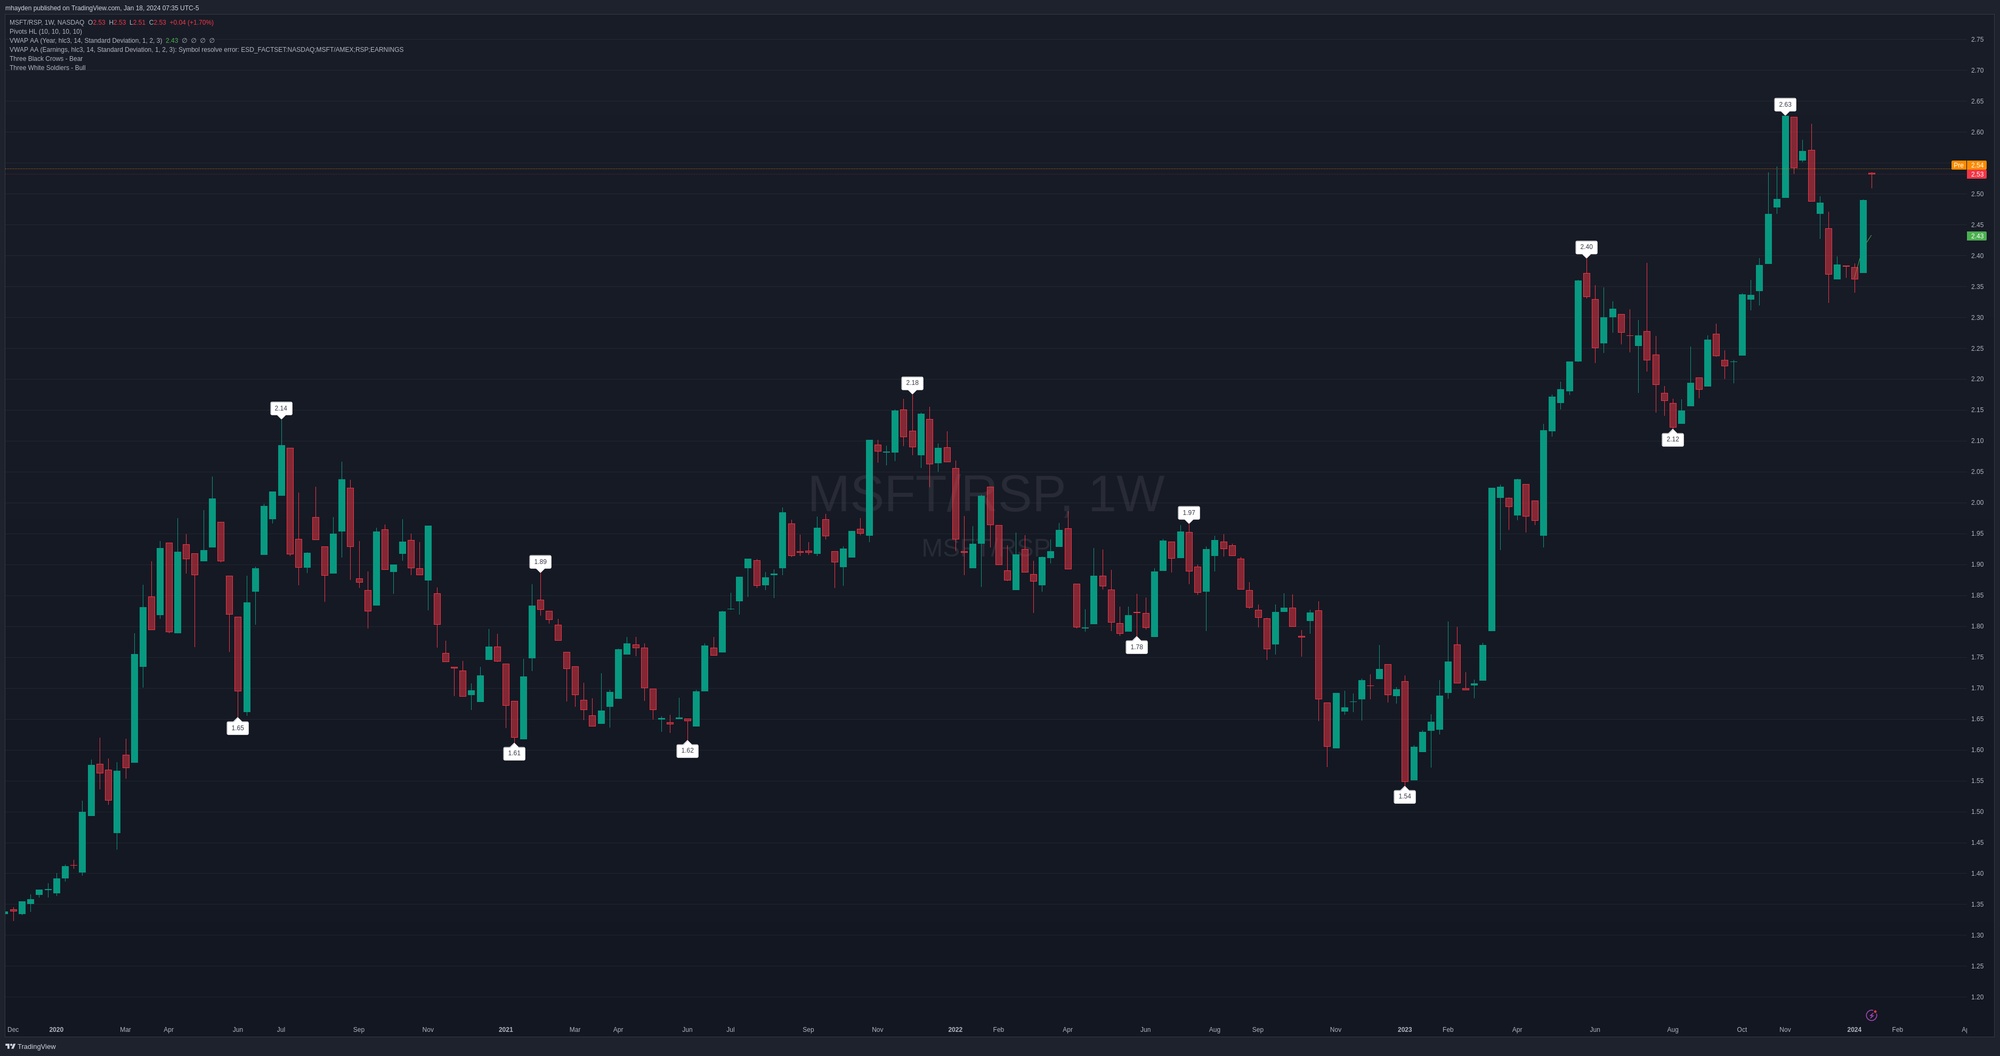
We can compare MSFT to an equal weighted SPX ETF like RSP to get an idea of how it is performing relative to its peers. As you might expect, a look at MSFT relative to RSP since the COVID lows is incredible:

Thesis
One of my goals for 2024 is to follow the market flow and avoid fighting the trend. It's pretty clear that MSFT has a good base of support underneath the current price and has an opportunity to move higher. A bad earnings call could certainly shift the sentiment on MSFT, but there's a lot going well for them lately, especially the growth of the Azure cloud business.
We're getting into uncharted territory as MSFT hits all time highs, so just keep an eye out for potential profit taking or corrections. 😉
I sold a MSFT 3/15 $355p for $4. That was around 0.17 delta yesterday when I sold it, but with MSFT moving up today, it's likely a lot lower delta now. It's tying up about $4,500 in buying power for a potential $400 return, so the return on risk is about 1.1%. That's a little low for me, but I wanted to make a conservative bet on MSFT since we're going into earnings soon.
My exit plan is to buy it back for 50% profit (around $2).
Good luck to everyone this week. 🍀


Discussion