MSFT earnings are upon us

MSFT reports this afternoon and it's difficult to ignore its recent strength. Let's work through the data and analyze the risk. 🦈

Happy Tuesday! 🌄 Microsoft's stock price has been on an incredible run and we get the earnings numbers for MSFT this afternoon once the market closes. AAPL and MSFT are battling for the top market cap in the S&P 500, but will earnings turn the tide in the battle?
All investments come with significant risks, including the loss of all capital. Please do your own research before investing, and never risk more than you are willing to lose. I hold no certifications or registrations with any financial entity.
Let's dig into the data.
Performance
It's difficult to find a time frame where the performance of MSFT wasn't satisfying. 👀
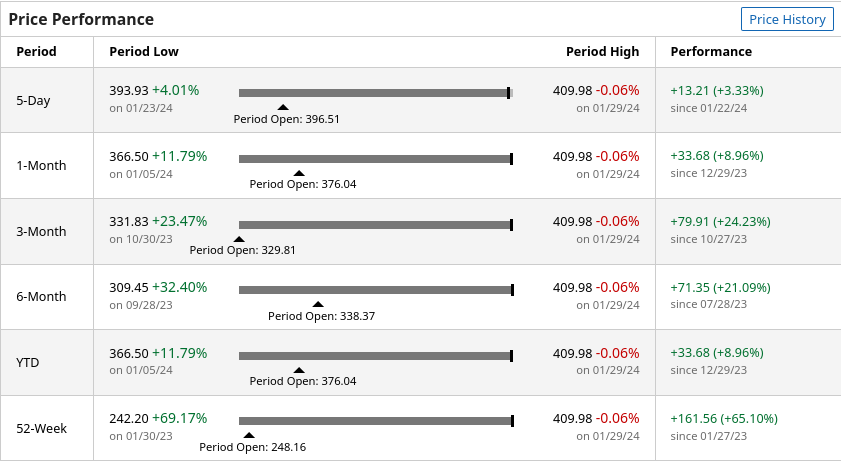
Investors holding MSFT a year ago would be looking at profits of over 65% today. That's not bad for a company with a market cap of just over $3T.
Longer term
MSFT rallied out of the COVID lows and stumbled in late 2021 at the highs as the interest rate hikes began. It ran back up to the $330 area in 2023, consolidated, and then blasted off on another rally.
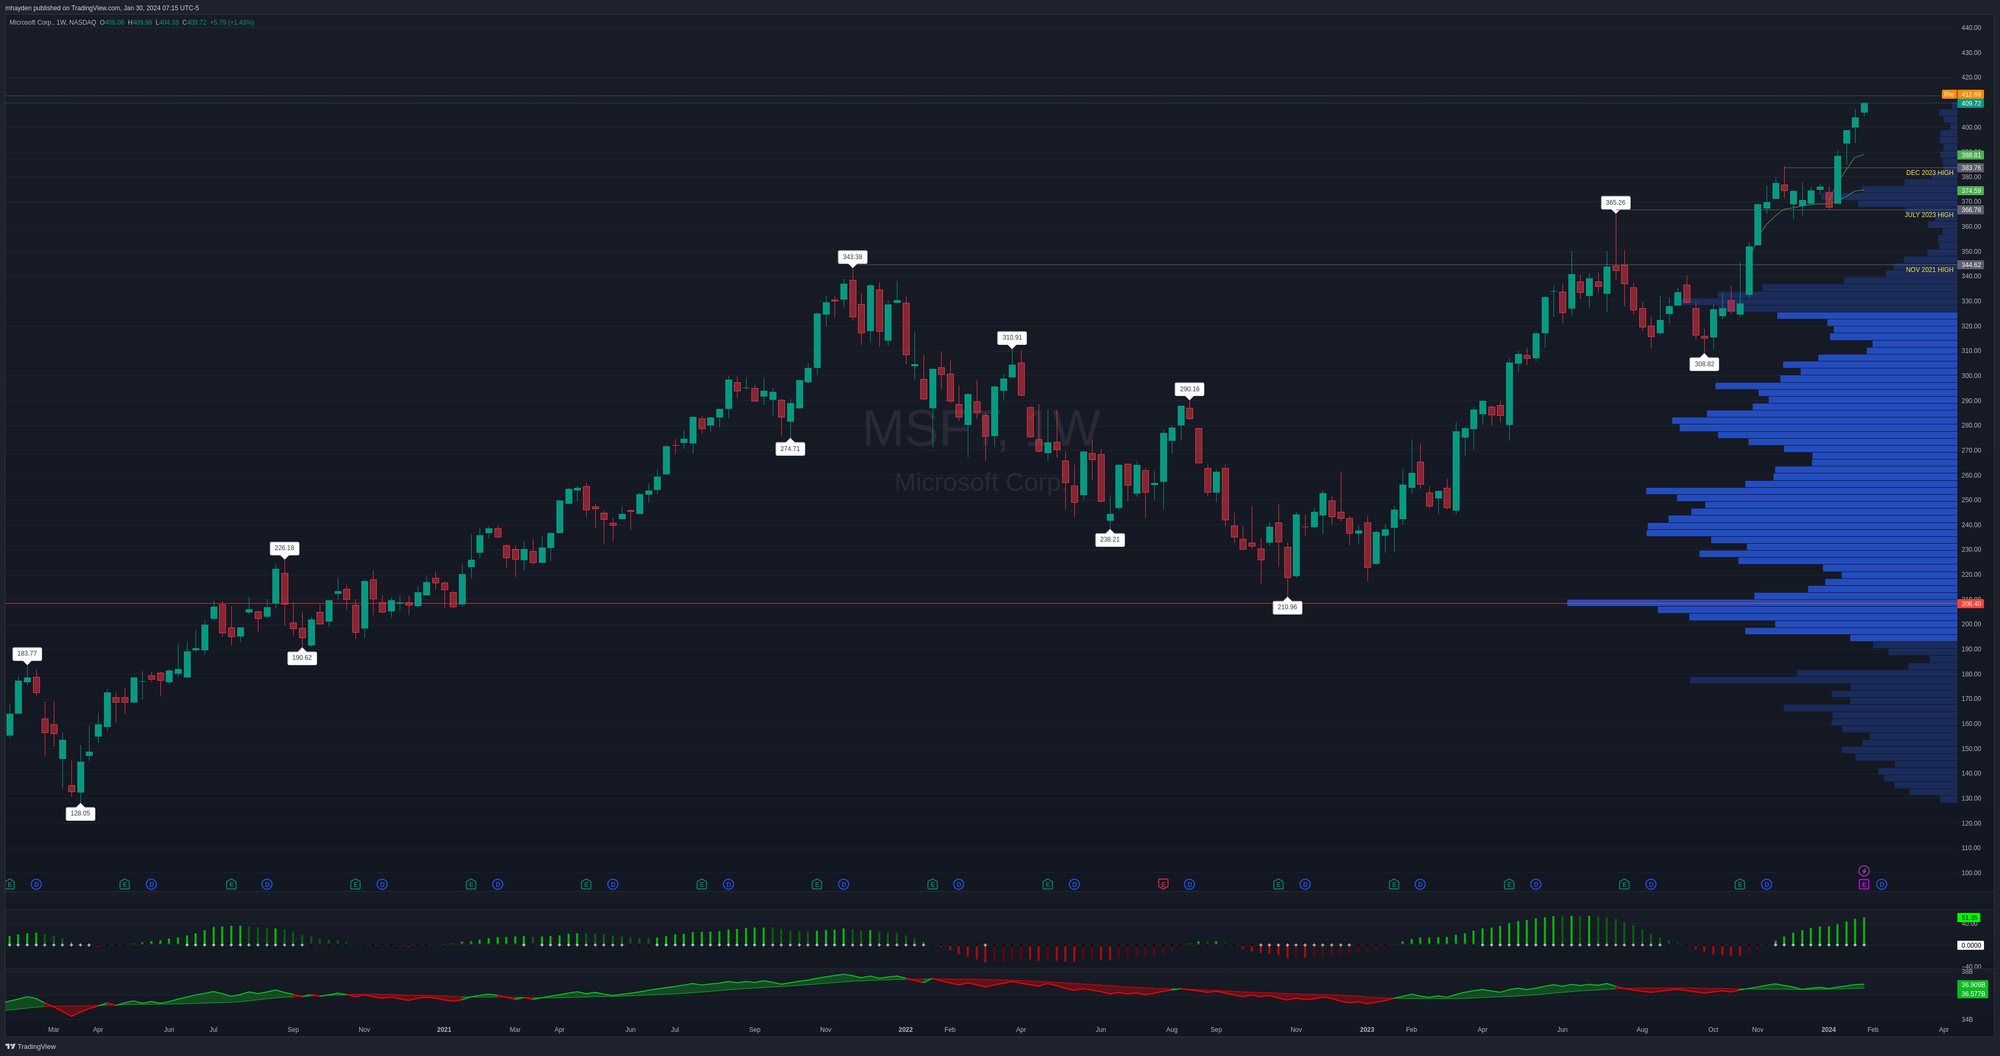
The latest run has made all time highs since the first week of November 2023. That's incredible, and it's certainly difficult to bet against that kind of strength.
Since last earnings
Next up is a daily chart since the last earnings call on October 24, 2023:
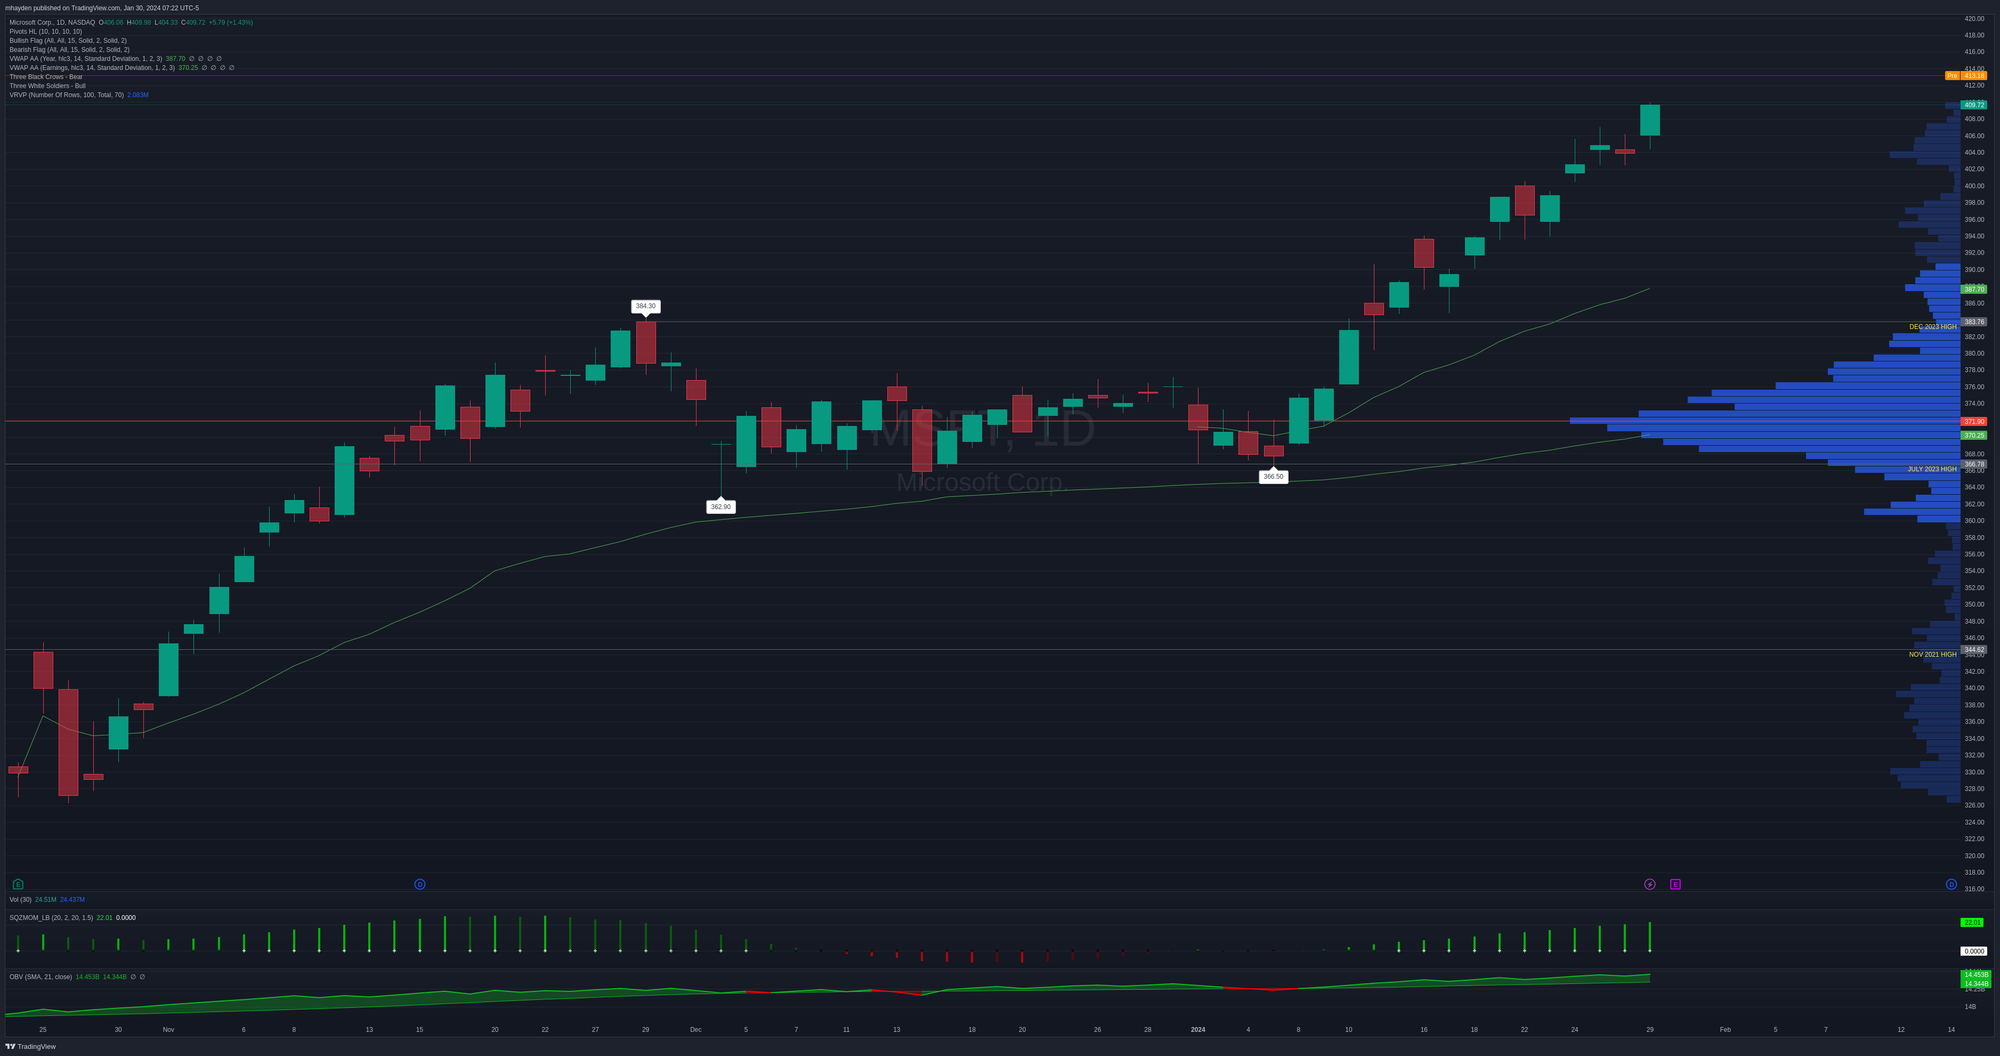
Here's how I see the chart:
- The price is still rallying over both VWAP lines. One begins at the last earnings call and the other begins on January 1. This looks like a higher risk to an upside move.
- The majority of the volume since the last earnings call is pegged around $372. That was a big consolidation zone and will likely provide support if there's a move to the downside through the VWAP lines.
- The on balance volume (OBV) indicator at the bottom shows that volume has supported the recent move and it's holding above the moving average on volume as well.
- The TTM squeeze indicator (second from the bottom) remains strong and the squeeze is on. This leads me to trust the current price movement.
- We have some light volume near $400 that could provide some nearby support, but the heavier volume at $404 might be a magnet if MSFT decides to retrace a bit.
In summary, the risk to the upside looks strong and I can't find any indication that sentiment is shifting from the current trend. Pullback targets look like $404, $387, and $372. On the upside, there's nothing to reference from the past that would limit the movement up. 📈
Institutional trades
As a reminder, the charts from Volume Leaders tell us three main things:
- When did institutions likely make big trades in the market?
- How much did they trade?
- What was the price when they made their trades?
They do not tell us the directionality. That's up to us to infer from all of the other data we can find.
Here's a chart of trades since the last earnings call:
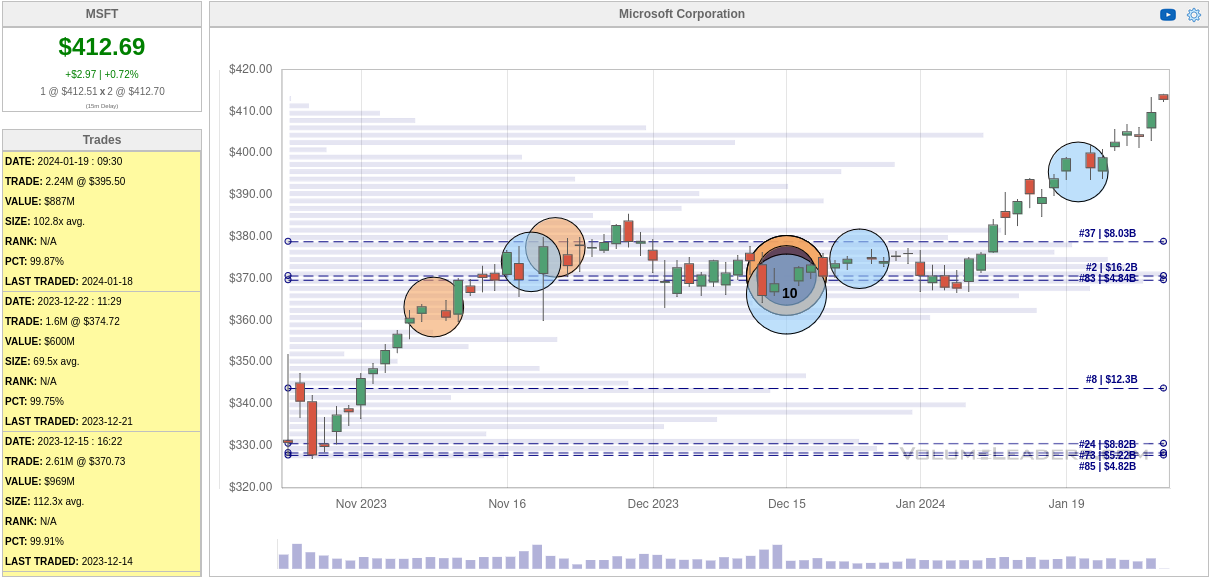
There's certainly a ton of interest from $370-$380 here. December 15th saw some massive trades on lit exchanges (institutions making trades on the public market), dark pools (trades off the public market), as well as late prints (when trades off the public market are reported really late). That's just shy of 20M shares of MSFT traded there from $366-$370. Institutions trading over $7B worth of shares should get our attention. 👀
What happened afterwards? The rally above $380 continued with another trade on January 19th of about 2.2M shares. It's a bit unclear what this trade was, but my first guess is that it was an institution taking some profits.
Let's zoom in more and see what's been happening over the last seven days:
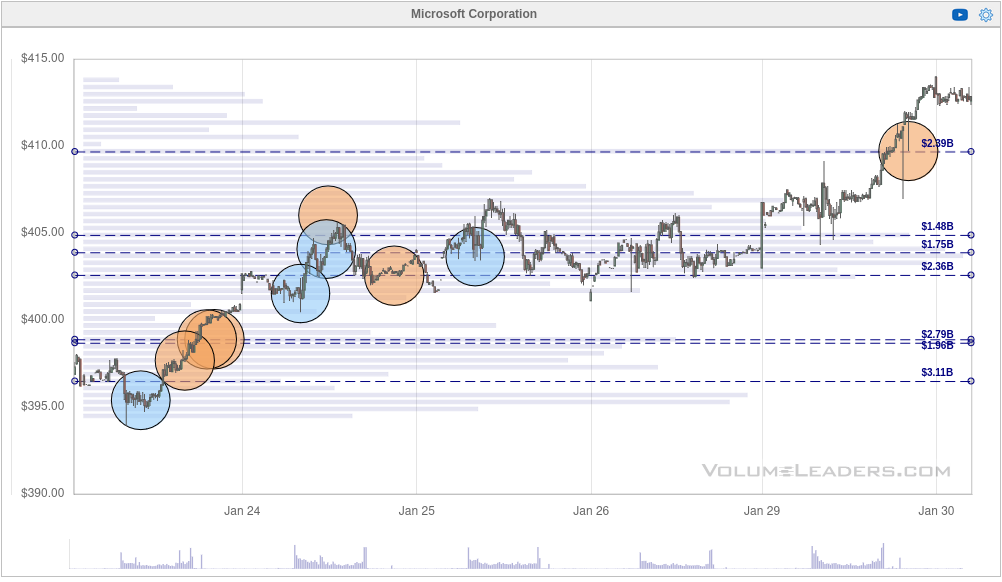
We had another mini-consolidation around $403-$405 where institutions made many relatively small change before MSFT rallied once more. The last dark pool trade (orange circle at far top right) is an interesting one at 732K shares. MSFT was trading around $411, but this dark pool trade hit in the after hours market at 6:35PM on a candle with a really long lower wick. It seems to me that an institution picked up an extra lot of shares at a slight discount and then MSFT moved higher.
Thesis
I hear many people say "THIS MARKET NEEDS TO BE SHORTED!" and I can understand that sentiment, but it seems risky to fight the current trend until the charts tell us that the current trend is in jeopardy. This reminds me of a quote from Tom Hougaard's book:

MSFT is showing us plenty of strength right now. Fighting that trend may seem like the best option, but it's also the highest in terms of risk from my perspective.
Upside moves for MSFT move us into uncharted territory, but it's been working on all time highs since November 2023. If we see some move to the downside, I'd expect to see price movement move towards $404, $387, and $372. I really like the $370-$380 zone based on the chart and the institutional trades since the last earnings call.
I sold a pair of March 15th short puts on MSFT and I've been gradually rolling them as the price continues to run. I'm currently sitting with two short $380 puts for March 15th and I'm still deciding whether to carry them through earnings or not. On the one hand, I like the level I picked and there's plenty of theta left in the options I sold. On the other hand, MSFT could fall through $380 and I'd be looking at a loss.
Earnings are dangerous times since sentiment can shift abruptly based on factors that are extremely difficult to predict. Expectations for MSFT are high right now, so a great report could still send the stock down. However, better than expected results could send MSFT much higher. Just take a look at SMCI's monster moves yesterday. 🤯
Good luck to everyone today! 🍀
Discussion