MSFT update for October 8th

We're two weeks away from Microsoft's earnings call and the stock is showing some short term weakness. Let's dig into the levels to watch as MSFT reaches a crossroads in October.

Let's get another look at Microsoft's data to see what the #2 stock the S&P 500 is doing lately. But first:
One last thing:
All investments come with significant risks, including the loss of all capital. Please do your own research before investing, and never risk more than you are willing to lose. I hold no certifications or registrations with any financial entity.
It's nerdy data time! 🤓
Charts
MSFT went on a great run starting in late 2023 and then it met some resistance at the highs in July. Since then, it made two higher highs and might be making a second higher low this week (but the pattern isn't complete):
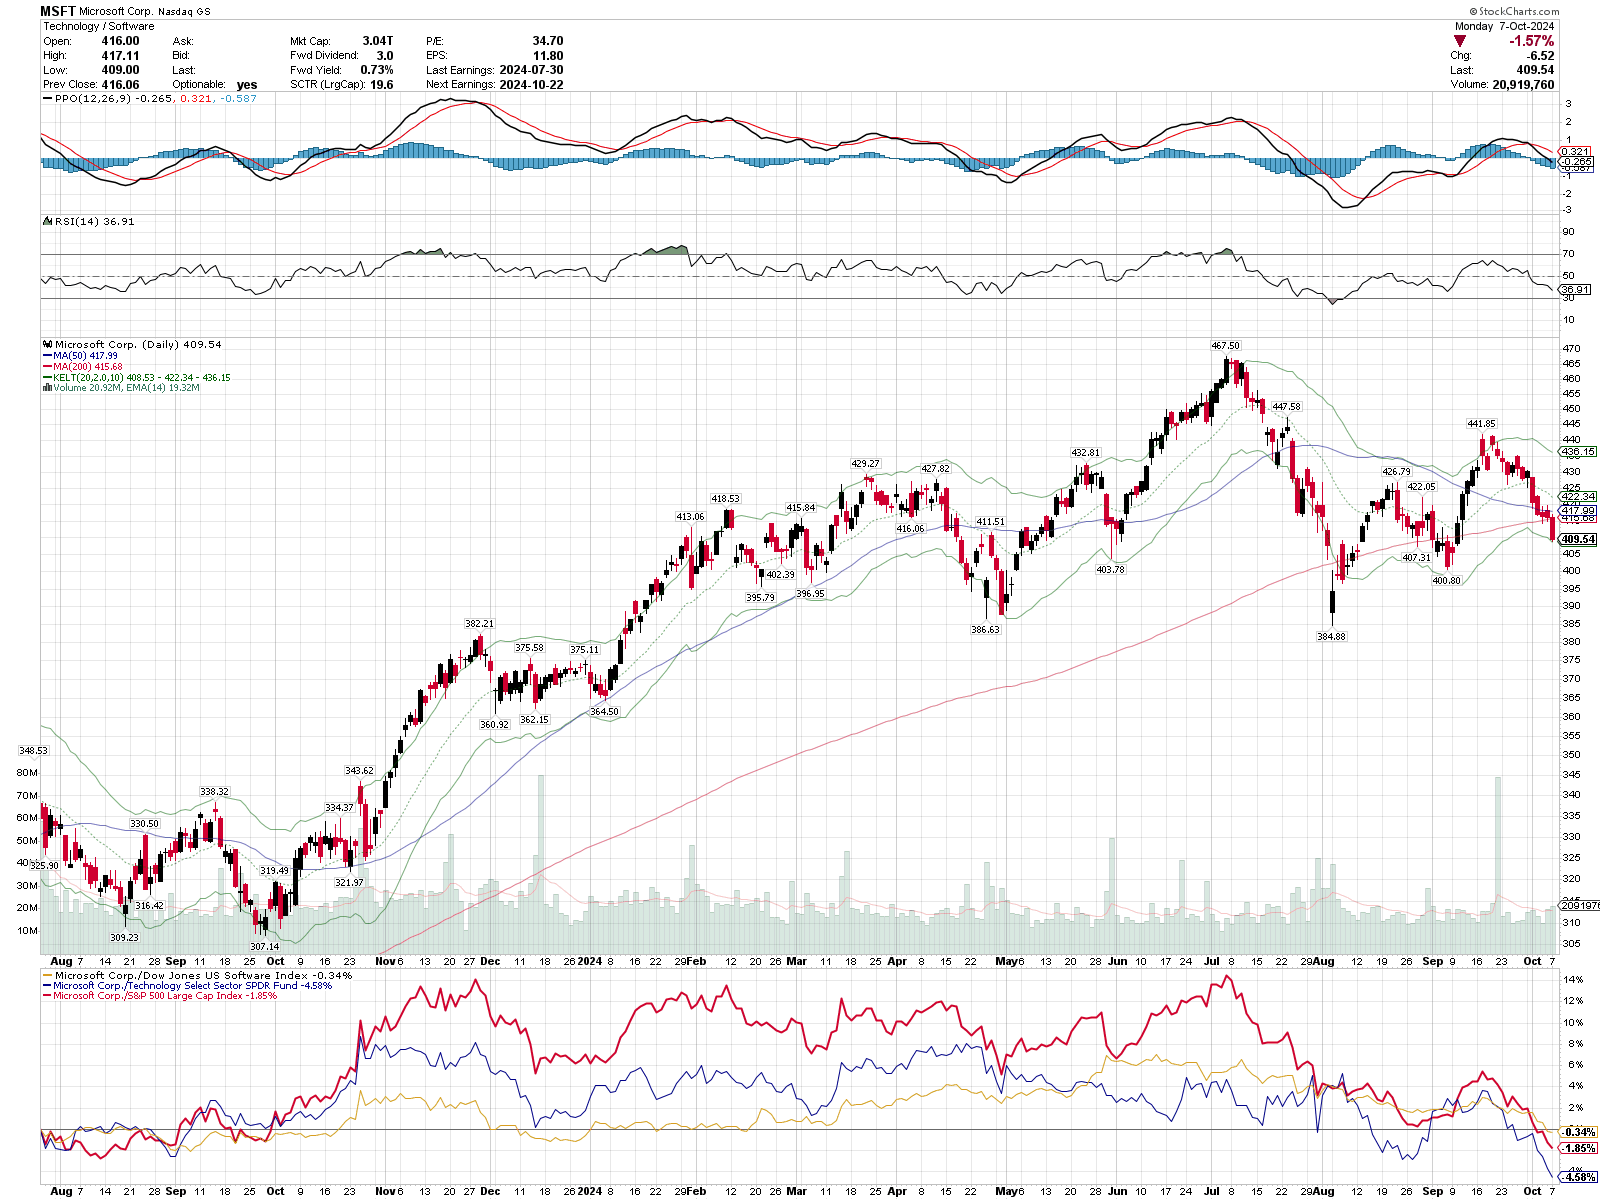
Starting from the top:
- The PPO line dropped below zero after sailing through the signal line at the end of September. That's a sign of weakening momentum.
- RSI has fallen into the bottom half again.
- The candlestick chart shows that we've broken just under the 200 day moving average and we're resting on the 2 ATR Keltner channel as of yesterday's close.
- MSFT's relative strength to its sector, industry, and SPY has fallen below zero relative to the end of 2023.
I've gotten in the habit of drawing my support and resistance lines on the monthly charts lately so I can identify some longer term patterns. StockCharts makes this difficult since the annotations don't carry over between time periods, but TradingView handles this a bit better. Here's a daily chart from TradingView:
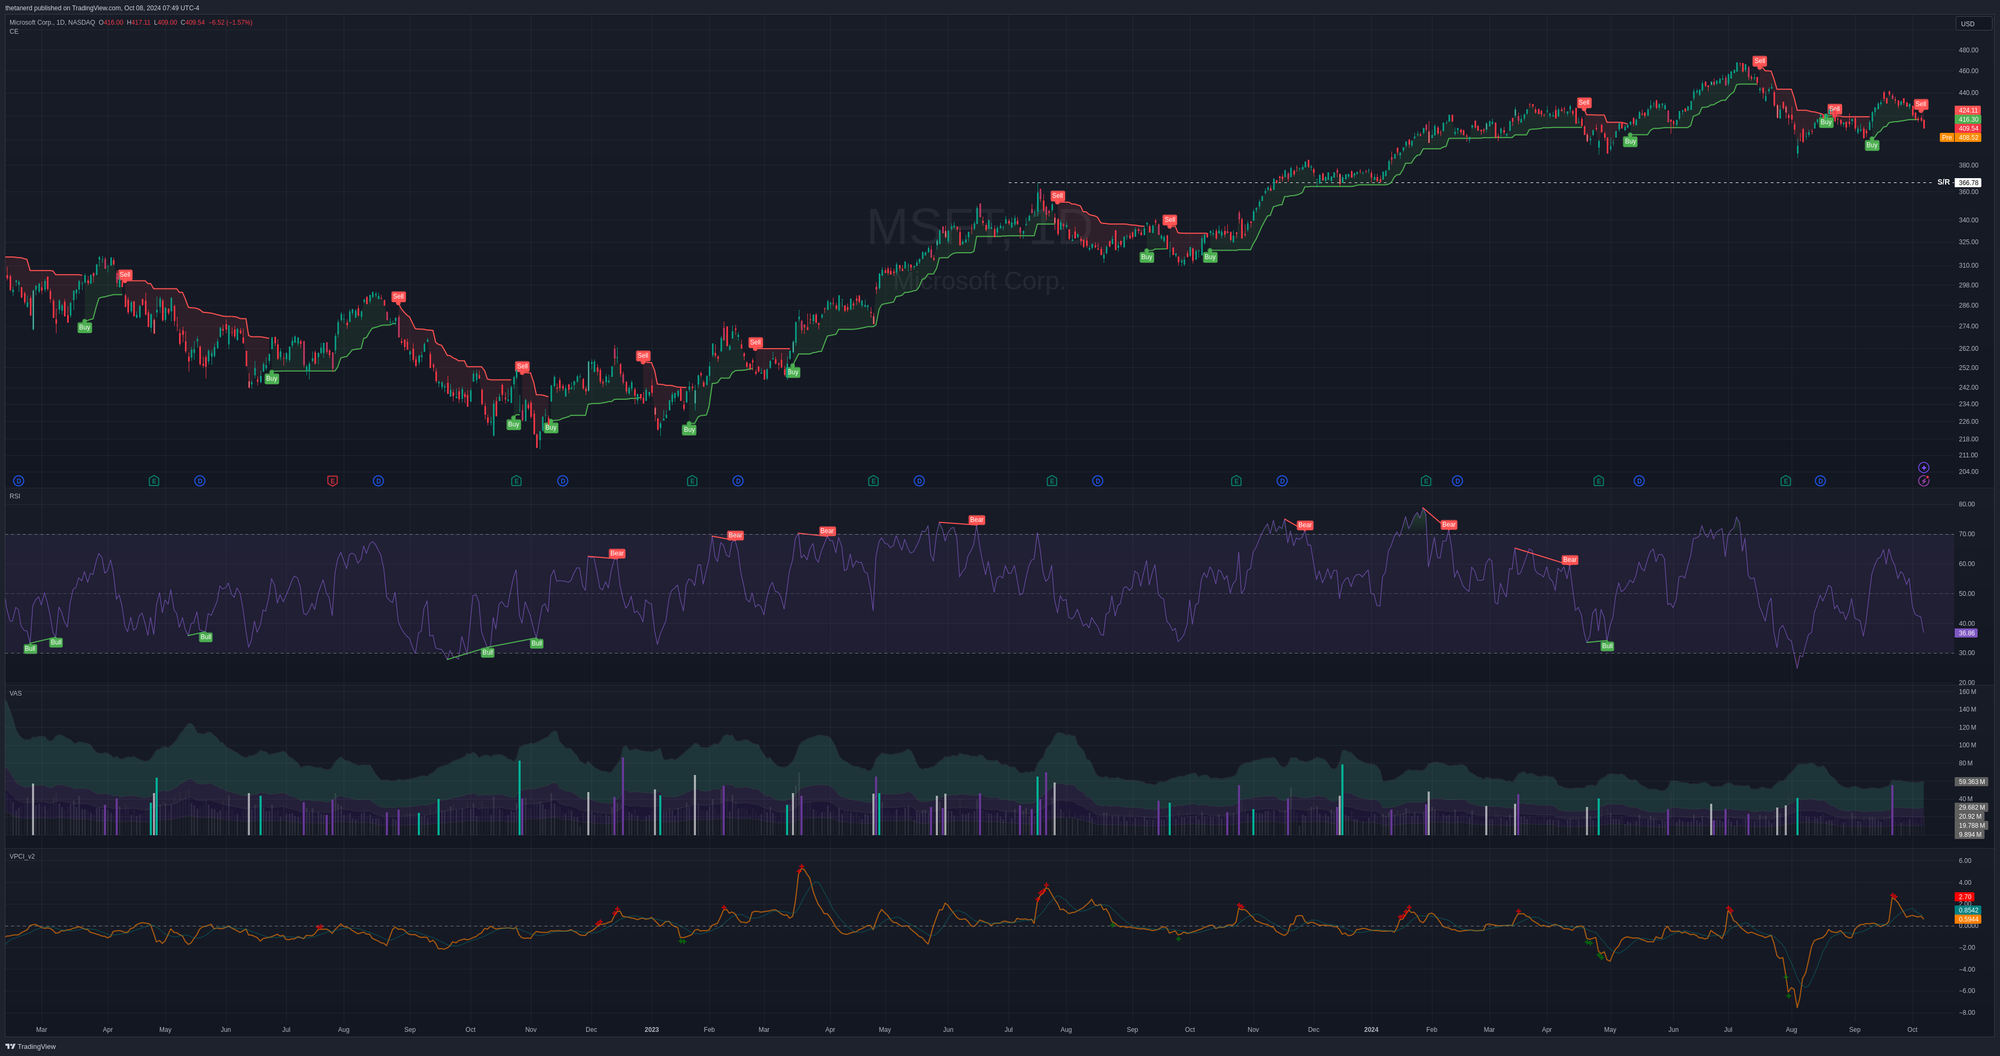
Rolling from top to bottom:
- I found a monthly support/resistance zone right around $366 that could be a place where we go for a retest if the current pattern breaks down and we do not make a higher low.
- The red/green lines around price are part of the Chandelier Exit indicator. It uses the Average True Range (ATR) to note when price breaks the ATR band and it flips from buy to sell or sell to buy. It's much like adding a buy/sell indicator to the Keltner channel indicator. We recently entered a sell pattern.
- The purple line below the candlestick chart is RSI and again, we're in the bottom half. We might post a higher low here soon, but we might not.
- Next up is a volume analysis indicator. Purple highlights bearish volume and cyan highlights bullish volume. The white columns note very high volume that might be bullish or bearish. It's been fairly quiet recently outside of a bearish blast on September 20th.
- Finally, the VPCI indicator is at the bottom. That's the Volume Price Confirmation Indicator. It looks for situations when volume is leading price action and when it isn't. The most recent highs came with several red plus signs and that's a sign from the indicator that the volume was not leading the price movement. I take that as a warning that the recent high wasn't sustainable.
At this point, I'm looking for MSFT to decide between:
- Putting in a higher low
- Running down to retest the July lows or perhaps the support/resistance line at $366.
Institutional trades
Volume Leaders is extremely helpful for identifying strong volume areas from very large trades made via dark pools or lit exchanges. These are trades often made by large institutions. Here's a chart covering the 5 biggest trades in the last 30 days:
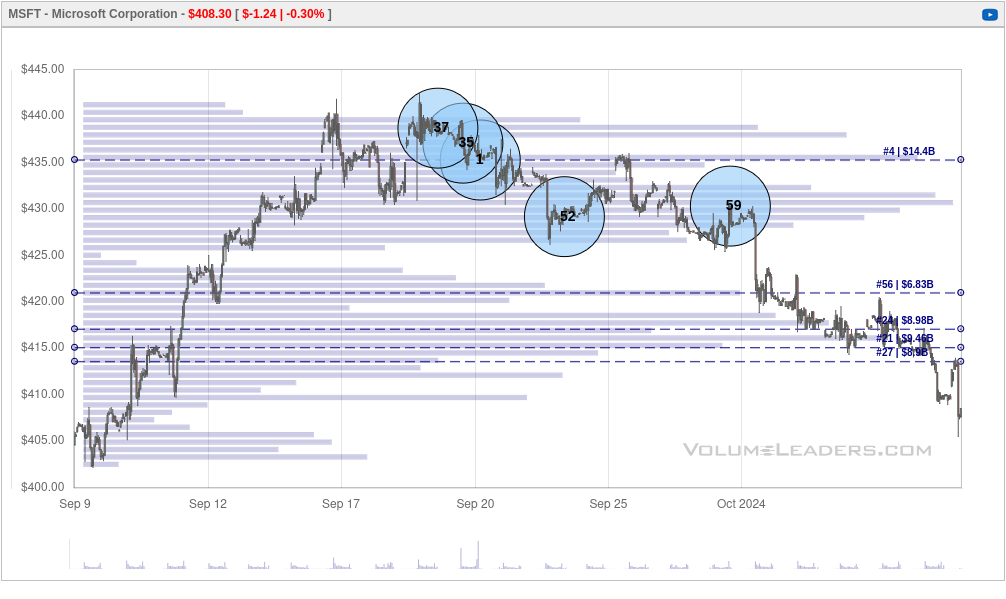
MSFT saw a flurry of trades at the highs, especially as it came down off the peak around $440. The #1 trade arrived around $435 and it's been rolling down since then. This is another example where traders made smaller bets (#37 and #35) and then sent the big trade once price confirmed their suspicions.
Let's take another look at the past year:
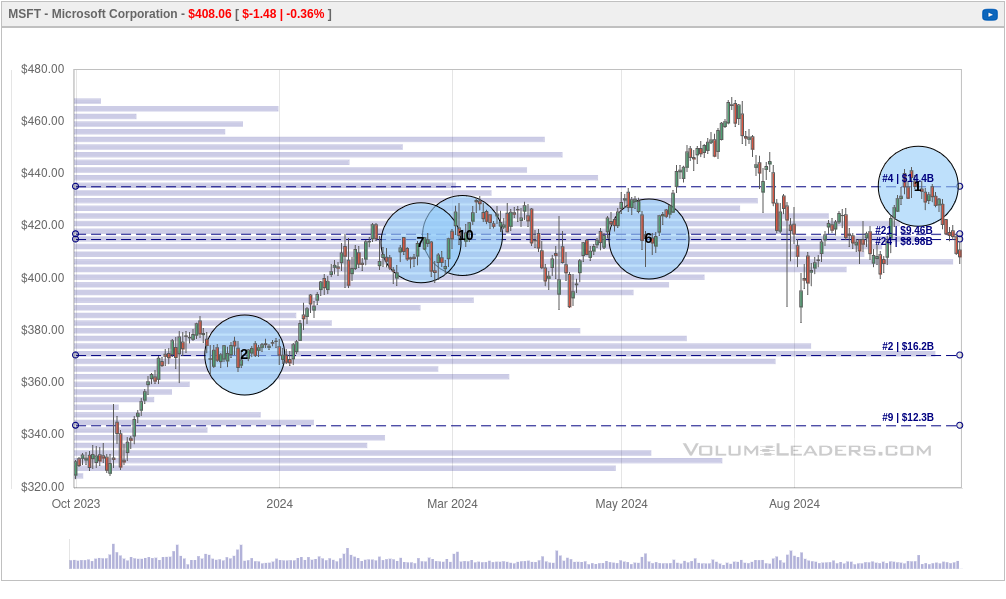
The big levels are pretty clear on this chart. The #2 trade sits around $370, which was the support/resistance level I identified on the chart earlier. We also have plenty of trades right around $415 (#7, #10, #6) that were breached recently. When price falls below those trades, it's a good time to get concerned about being long MSFT.
The next big spot to watch will be that high volume level around $370.
Sentiment
This next chart comes from SentimenTrader and it uses several different pieces of data to generate a sentiment chart for MSFT. The green level means "go long" and the red level means "watch for a reversal".
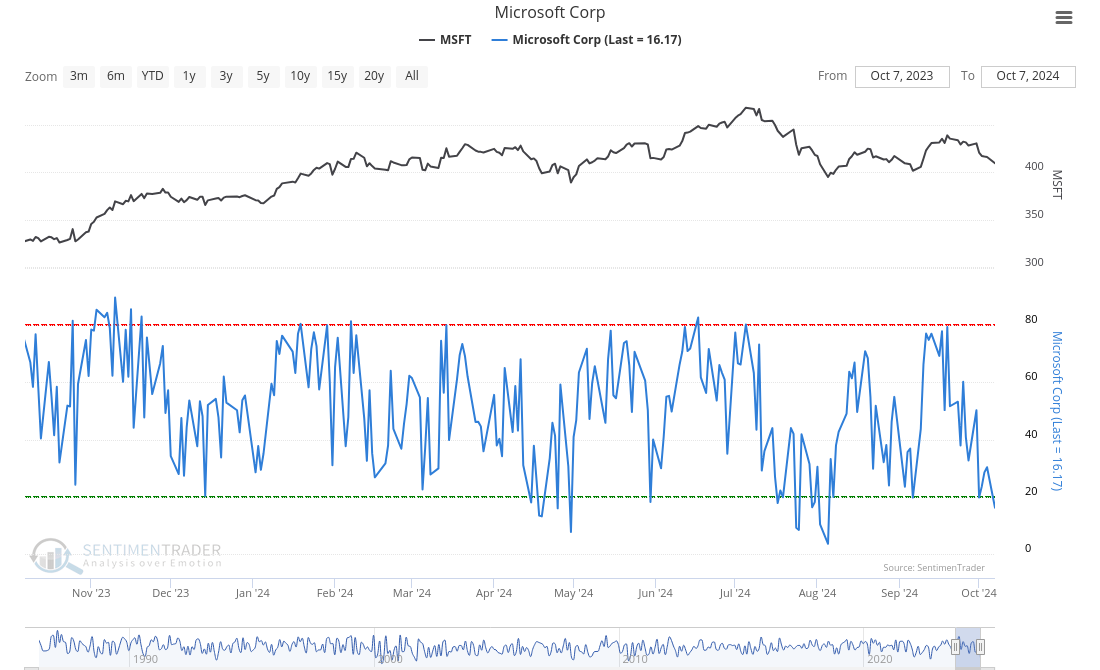
We're sitting at a fairly low optimism level for MSFT as it stands today. There are two ways to look at this:
- MSFT has been beaten up pretty badly and optimism is low, so it's a great time to buy.
- MSFT is losing momentum and traders aren't optimistic, so it's a great time to short.
Notice that when MSFT's sentiment breaks below the green line, it often marks the bottom for price. It took a few trips below the green line for MSFT to begin a new uptrend back in July/August, though.
Thesis
MSFT definitely ran into trouble at the recent highs and it sits at a crossroads today. Will traders help put in a higher low or will we revisit the levels around $370?
The average directional index (ADX) argues on the monthly time frame that the trend is still intact, but the weekly and daily are showing no trend right now. Volatility is up about 1.3% (using Tasty's IV index) over the past five days in MSFT alone and we're two weeks out from the earnings call.
I'm sitting on some short puts on MSFT around $405 and they're not looking particularly good at the moment. My plan is to stick with them a bit longer until I can determine which way the chart is breaking.
Good luck to everyone this week! ☘️
Discussion