New ticker: OXY!
OXY is a new ticket for me and I plan to trade it just like the others: using charts and options data. 🛢️
Happy Thursday! 👋
I try to keep my list of tickers short so there's less data to track, but I've decided to add OXY into my rotation for a while along with AMD and TSLA. Occidental Petroleum does lots of exploration for oil and they do petrochemical manufacturing in the US and other countries. They're also a big sponsor of my favorite baseball team, the Houston Astros. ⚾
Energy might not be as wild as semiconductors and electric vehicles, but it has a decent amount of volatility on its own. OXY has made some decent moves lately and I'm going to trade it using options data and charts.
All investments come with significant risks, including the loss of all capital. Please do your own research before investing, and never risk more than you are willing to lose. I hold no certifications or registrations with any financial entity.
Let's get started! ⚡
Options flow
Yesterday was quite bearish, but flows over the past five days are a bit tougher to decipher.
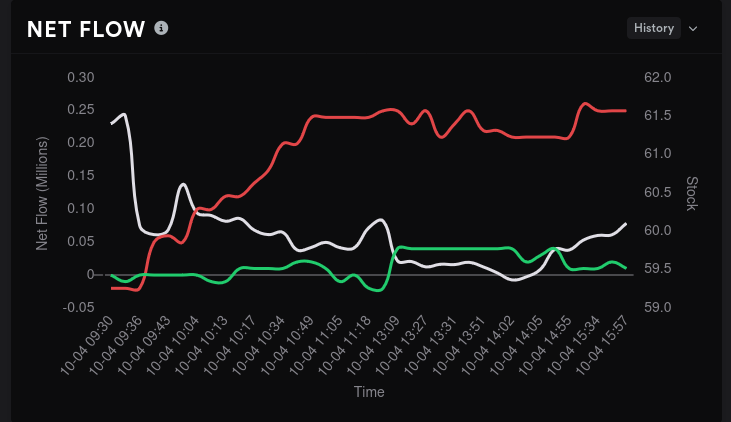
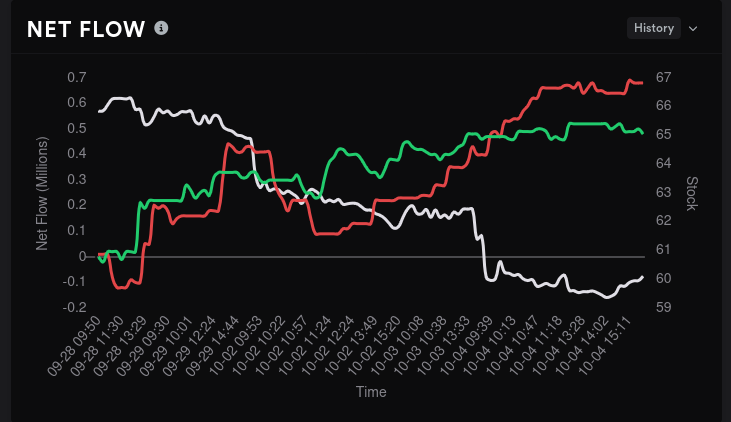
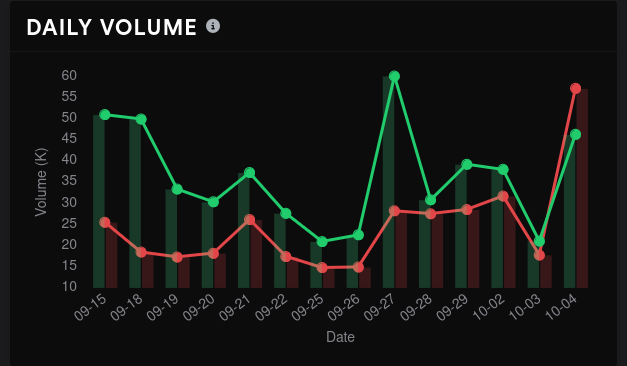
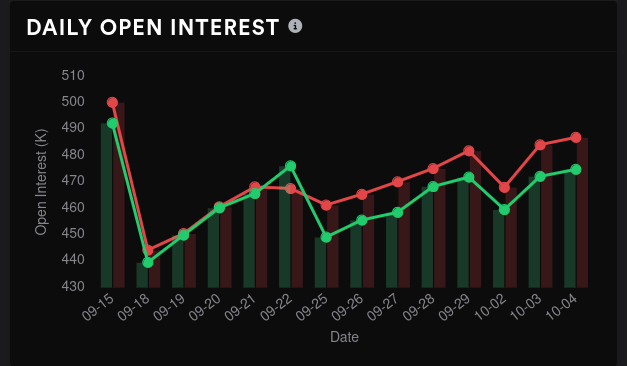
Volume cranked up yesterday to really high levels with puts leading the pack. Open interest has crept up since the drop after September's OPEX.
Vanna
Aggregate vanna from Volland shows vanna slightly positive at the extremes, but there's a big negative bar right at $60. OXY sits just under $60 this morning, so this bar likely has little effect on the price right now.
Reminder: Vanna needs room! Vanna is strongest around 0.15-0.35 delta. When price is sitting very close to a big vanna level, that level has almost zero effect on price.
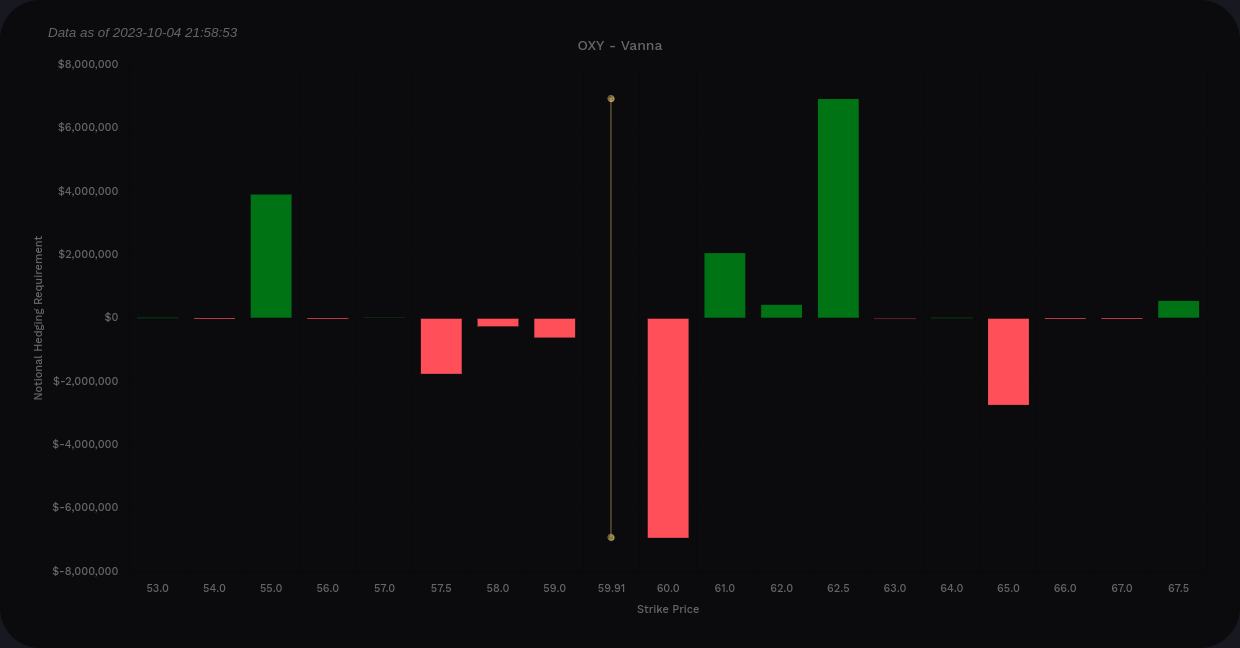
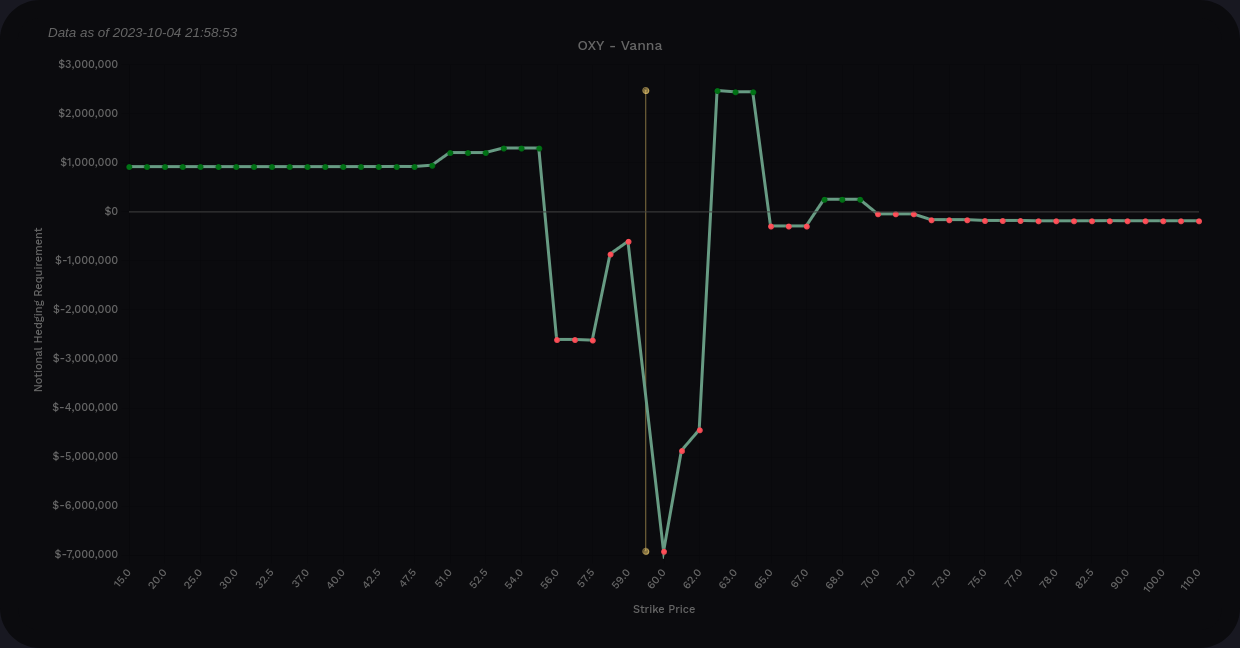
10/20 looks a little more bullish with a decent sized magnet at $61 if we get an IV crunch.

11/17 looks to be where we get the big negative bar at $60.

Gamma exposure
OXY has an interesting GEX profile on aggregate with some fairly wide negative GEX ranges. Everything from $62.50 to $70 seems to be in play with some big levels at $65/$70. Price is currently sitting on a positive GEX level that should repel price in one direction or the other.

10/6 looks to be a big expiration, followed by 10/20 and 11/17. OXY earnings are on 11/7!

10/20 shows more negative GEX at the lower end of that $60-$70 range. Light resistance shows up at $70.

11/17 looks more bullish with a distinct price magnet at $70. $60 shows up as a resistance level here.

Dealer positioning
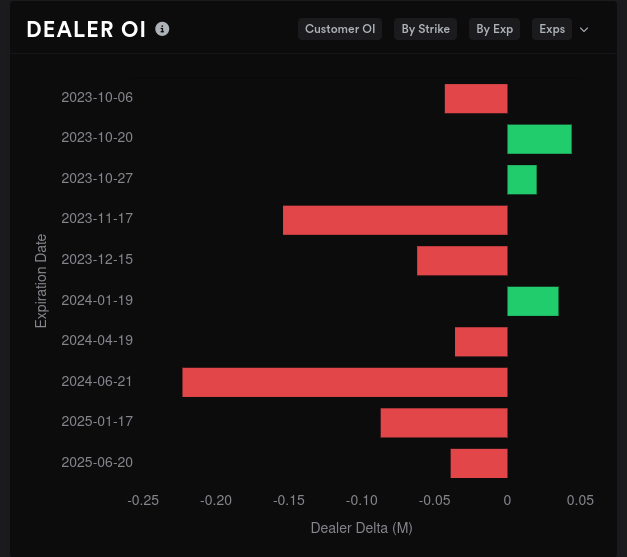
Dealer deltas are unusual for OXY since it doesn't backtest well with the typical parameters like AMD/TSLA do. Normally, buying when dealers are short is a good idea for those tickers. However, that seems to clip profits quite a bit for OXY on the backtest.
With that said, dealers are slightly short on OXY right now and that implies customers are long.

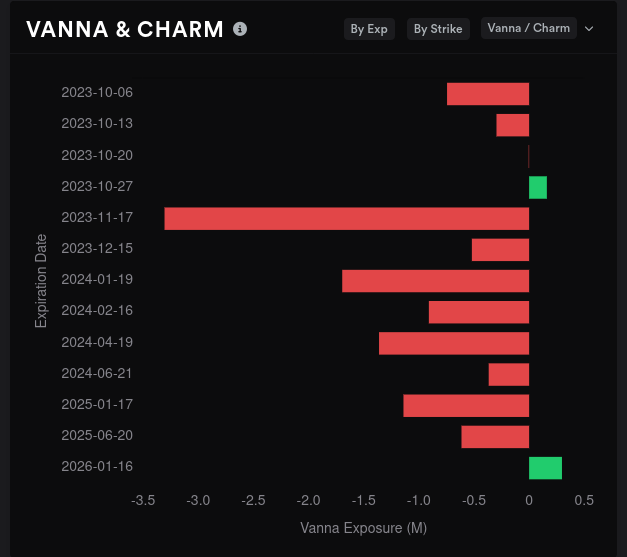
OXY's vanna profile is quite negative over multiple timeframes which suggests that IV crunches might not help much with price moves to the upside. At first glance, dealer open interest looks wildly bullish, but remember to check that X axis!
These OI bars are weak. I like seeing bullish bars here but I'd much rather see larger bullish bars.
Whales
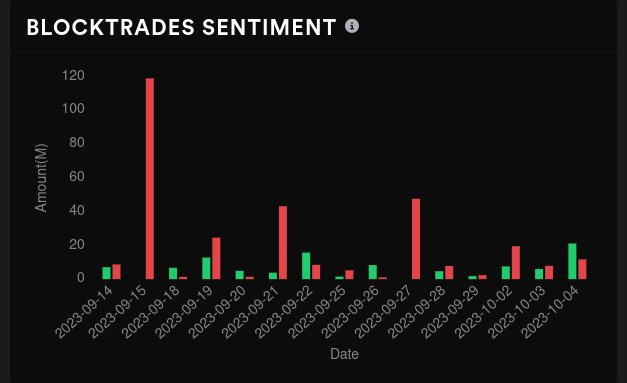
This week's big money trades for 10/6 show traders going bearish on $67/$68 and this matches up with our GEX levels.

There isn't much data for 10/20, but 11/17 shows traders picking sides. $65 took a bearish move but $60, $67.50, and $75 have all moved up on the bullish side.

Dark pool trades
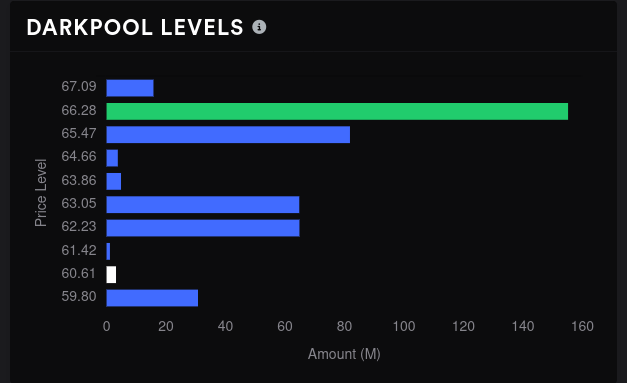
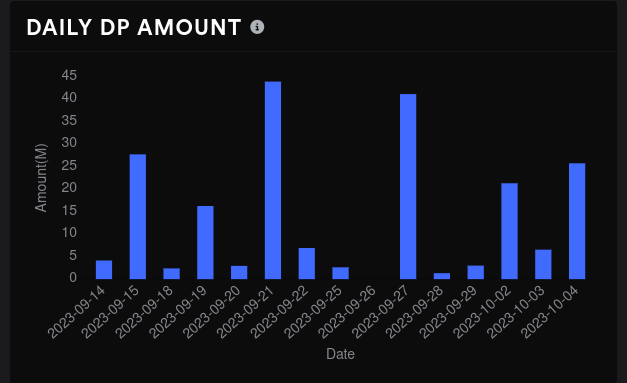
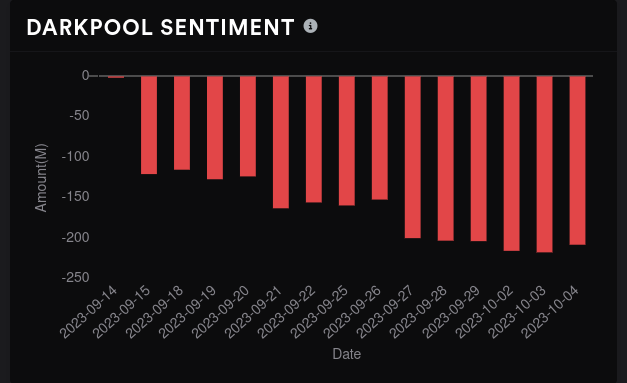
OXY has some very spiky dark pool trades and this makes it easy to see the volume levels. $66.28 is the largest one and that seems to be our limit for price based on the GEX levels through 10/20. We're in a bit of a gap right now at $60, but there's a decent volume bar at $59.80 that could provide support. Volume was up yesterday and the bulls appeared to win the day.
Chart
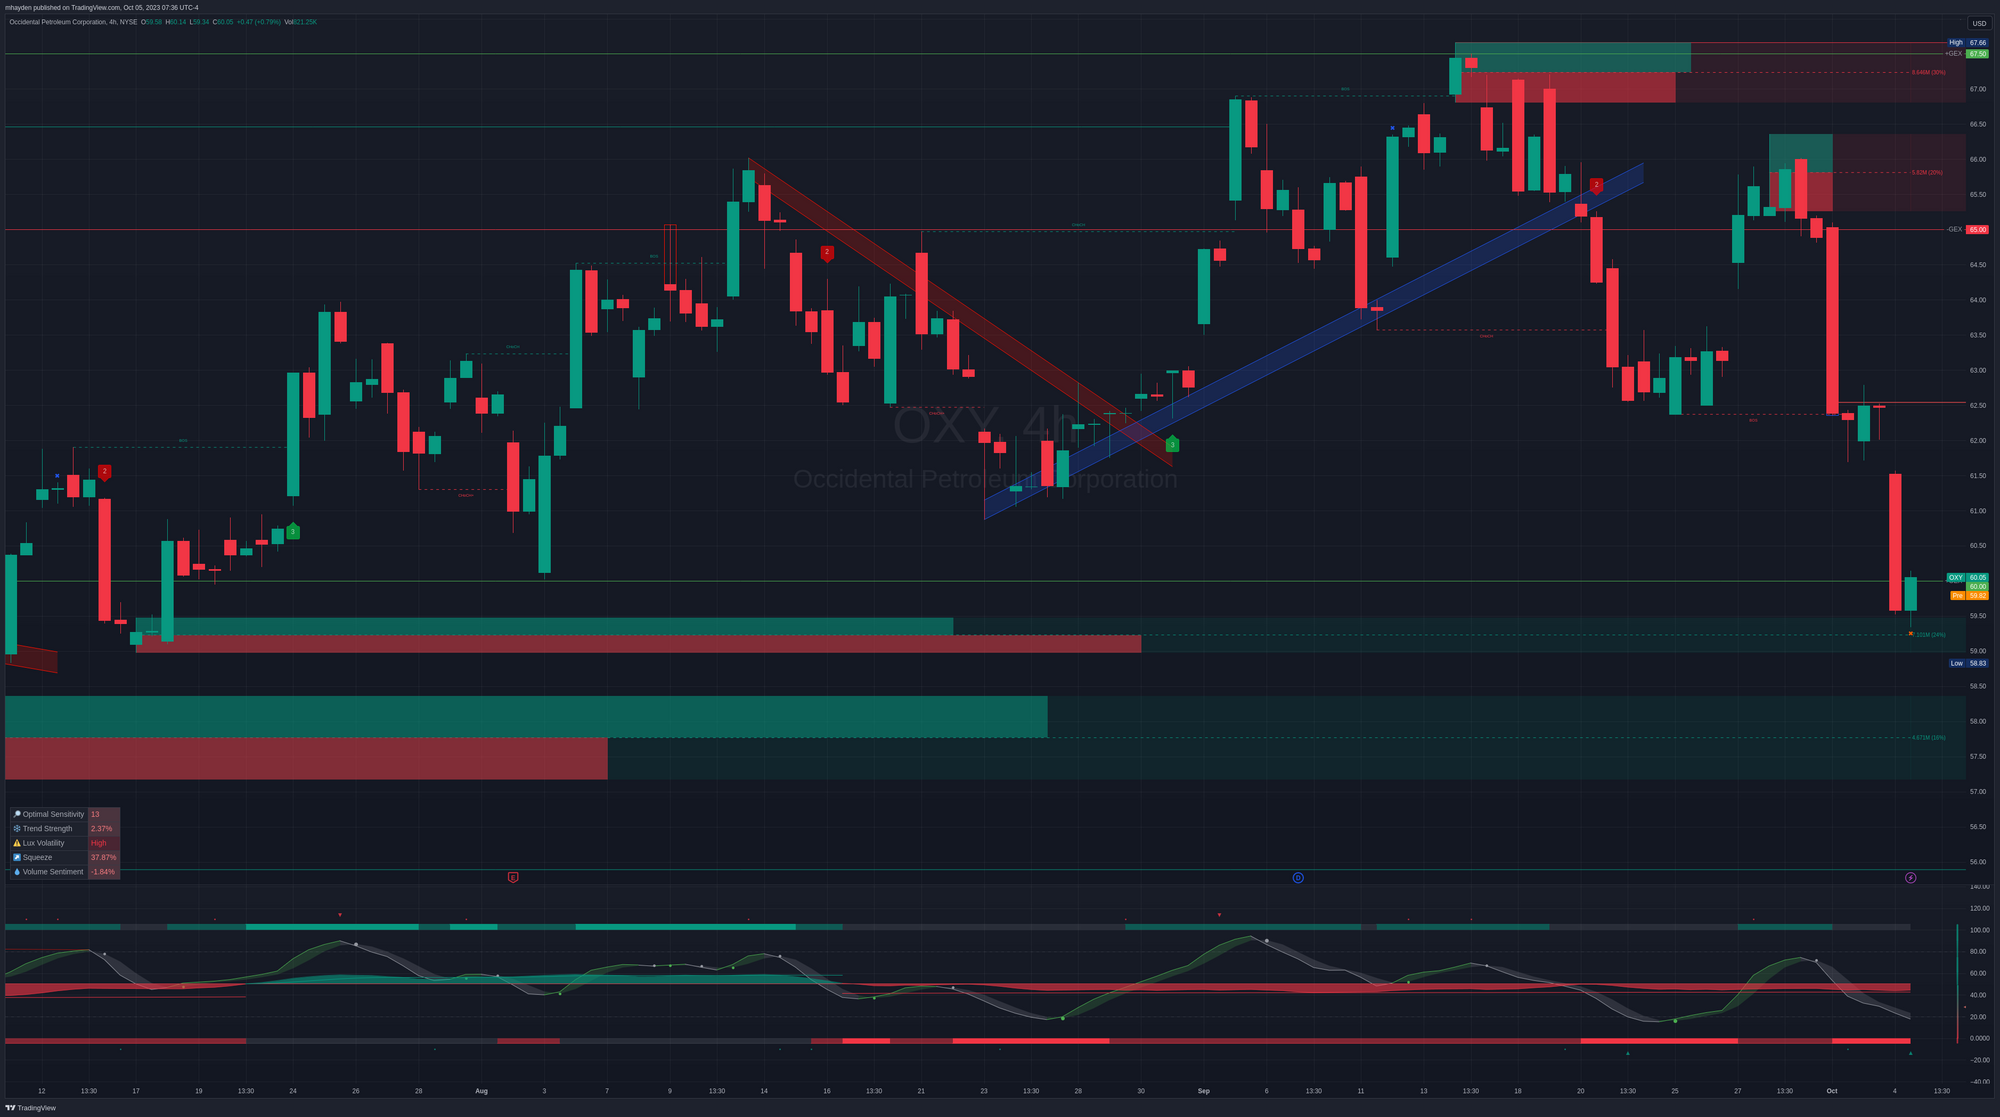
OXY broke a trend line back on 9/20 and eventually fell down to this $59-$60 level. We finished yesterday right on the $60 positive GEX level and we're just above a decently sized order block (24%). One of the LuxAlgo indicators suggested that yesterday was a good time to close a short OXY trade. Another one marked a strong sign of a bullish trend occurring.
All of our negative GEX is above the current price and centered mainly on $65.
If we're headed down, there's an order block at $59 and another one around $57-$58.50. The first one looks more bullish than the second, but it would be nice to see OXY test these levels and come back out to the top side. The next support level looks to be around $48 but that would require a much larger drop.
If we're headed back up, we have a fair volume gap around $62.50 on the 15m time frame that needs to be filled. There's also a break of support (BOS) there on the 4 hour chart. Above that, there's another order block right after the negative GEX magnet at $65 and then GEX looks to limit any more upside moves around $67.50.
Thesis
OXY (and the energy sector in general) has been knocked down a bit lately, but there's plenty to look at here and see a potential turnaround. All of the negative GEX, the biggest dark pool volume level, and most of the order blocks are above the current price. Indicators are suggesting a bearish tilt that is just beginning to turn.
I've shorted some puts in the lower $60's for 10/20 as a bet that we've just hit our lowest levels here. The energy sector is volatile and challenging to predict, but so are the other sectors I trade. 😜
If we do manage to enter the upper $60's, I'll consider selling some covered calls as long as they don't cross that earnings date on 11/7.
Good luck to everyone out there today! 🍀


Discussion