NVDA analysis for April 5

As NVDA consolidates at the highs, what is the data telling us? How should we react when it decides to make its next move? 📈

Howdy and happy Friday to you. Yesterday's market slide certainly set things up for an interesting Friday of trading. I'll dig into NVDA today to see where it might be headed after its recent consolidation at the highs.
All investments come with significant risks, including the loss of all capital. Please do your own research before investing, and never risk more than you are willing to lose. I hold no certifications or registrations with any financial entity.
Let's get into the data!
Charts
Let's start things off with a fairly basic daily chart since the fall of 2023. I've highlighted the recent area of consolidation with an orange box and I'm using 45 and 200 day moving averages. Most of my trades are around 45 DTE (since I trade 30-60 DTE short options) and I like the 200 day as a good longer-term measure of a stock's trend.
NVDA kept trying to kick off a rally last fall but it didn't really get moving until January 2024. Other than a droop around the last earnings call, there's not been much of a correction in NVDA since the start of the year:
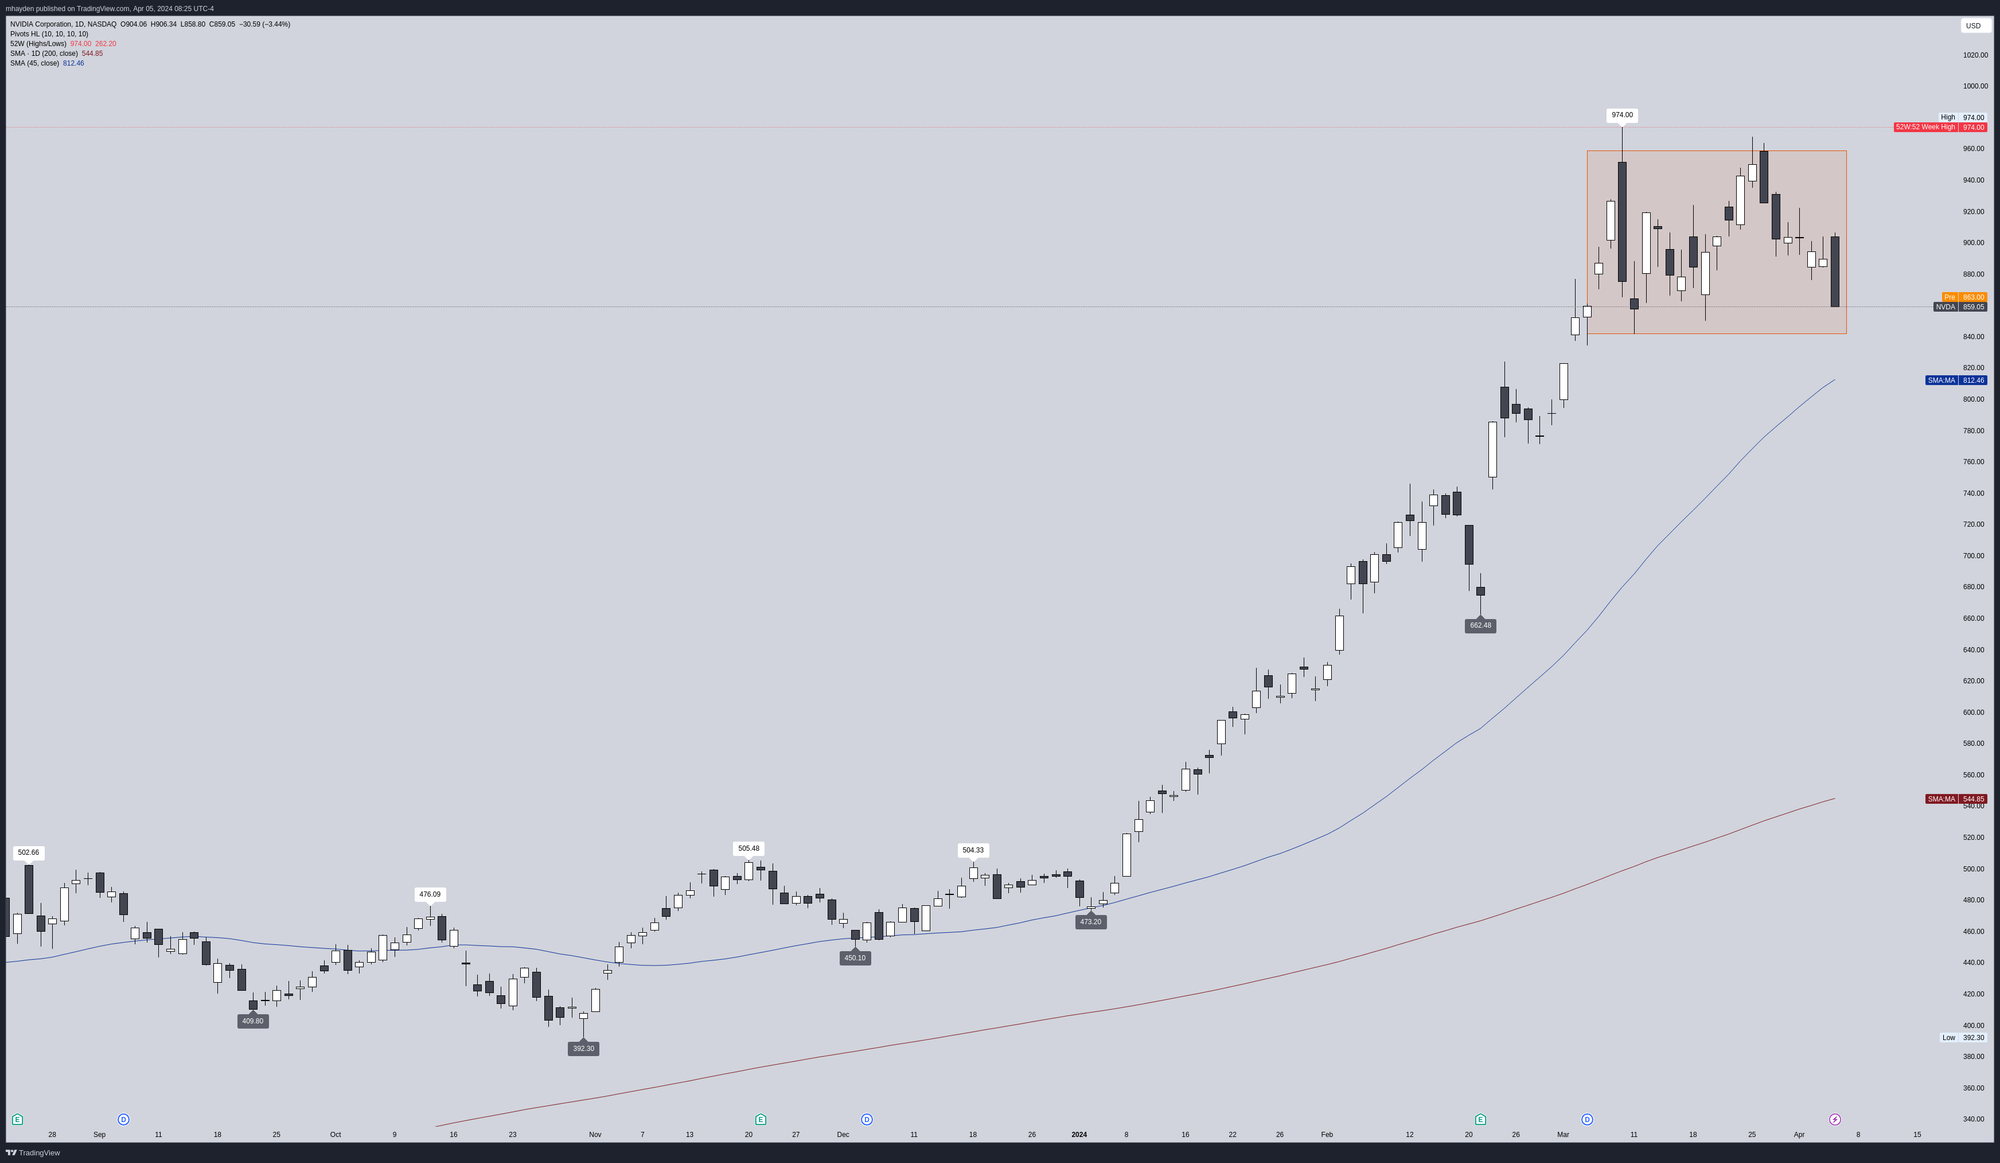
We're near the 52-week highs now around $974 and it's astonishing to remember that the 52-week low is $262.20. 🤯 Does that mean NVDA can keep rallying at this pace? Are we going back to where we were last fall? Let's keep digging to build a plan.
Let's add two indicators that examine volume to see if we have traders supporting these big moves. On top is the on balance volume indicator, but it's been adjusted to become an oscillator. Next is the Money Flow Index which is similar to the RSI but it incorporates price and volume data. It tries to show oversold and overbought situations, but I don't use it for that. I usually look at both to find convergence and divergence with the current price.
There are three bearish divergences in the OBV indicator here:
- November 2023: The rally tried to get going, but it fell back to $450.
- Jan/Feb 2024: The stock rallied higher, but volume didn't support the move. NVDA corrected around earnings down to $662.
- March 2024: Volume is decreasing as NVDA ran near the 52-week high line.
The only bullish confirmation I can see here is the one before the big rally kicked off in January. However, the bearish divergence from early 2024 didn't mean much when the stock rallied from $500 to $800. 👀
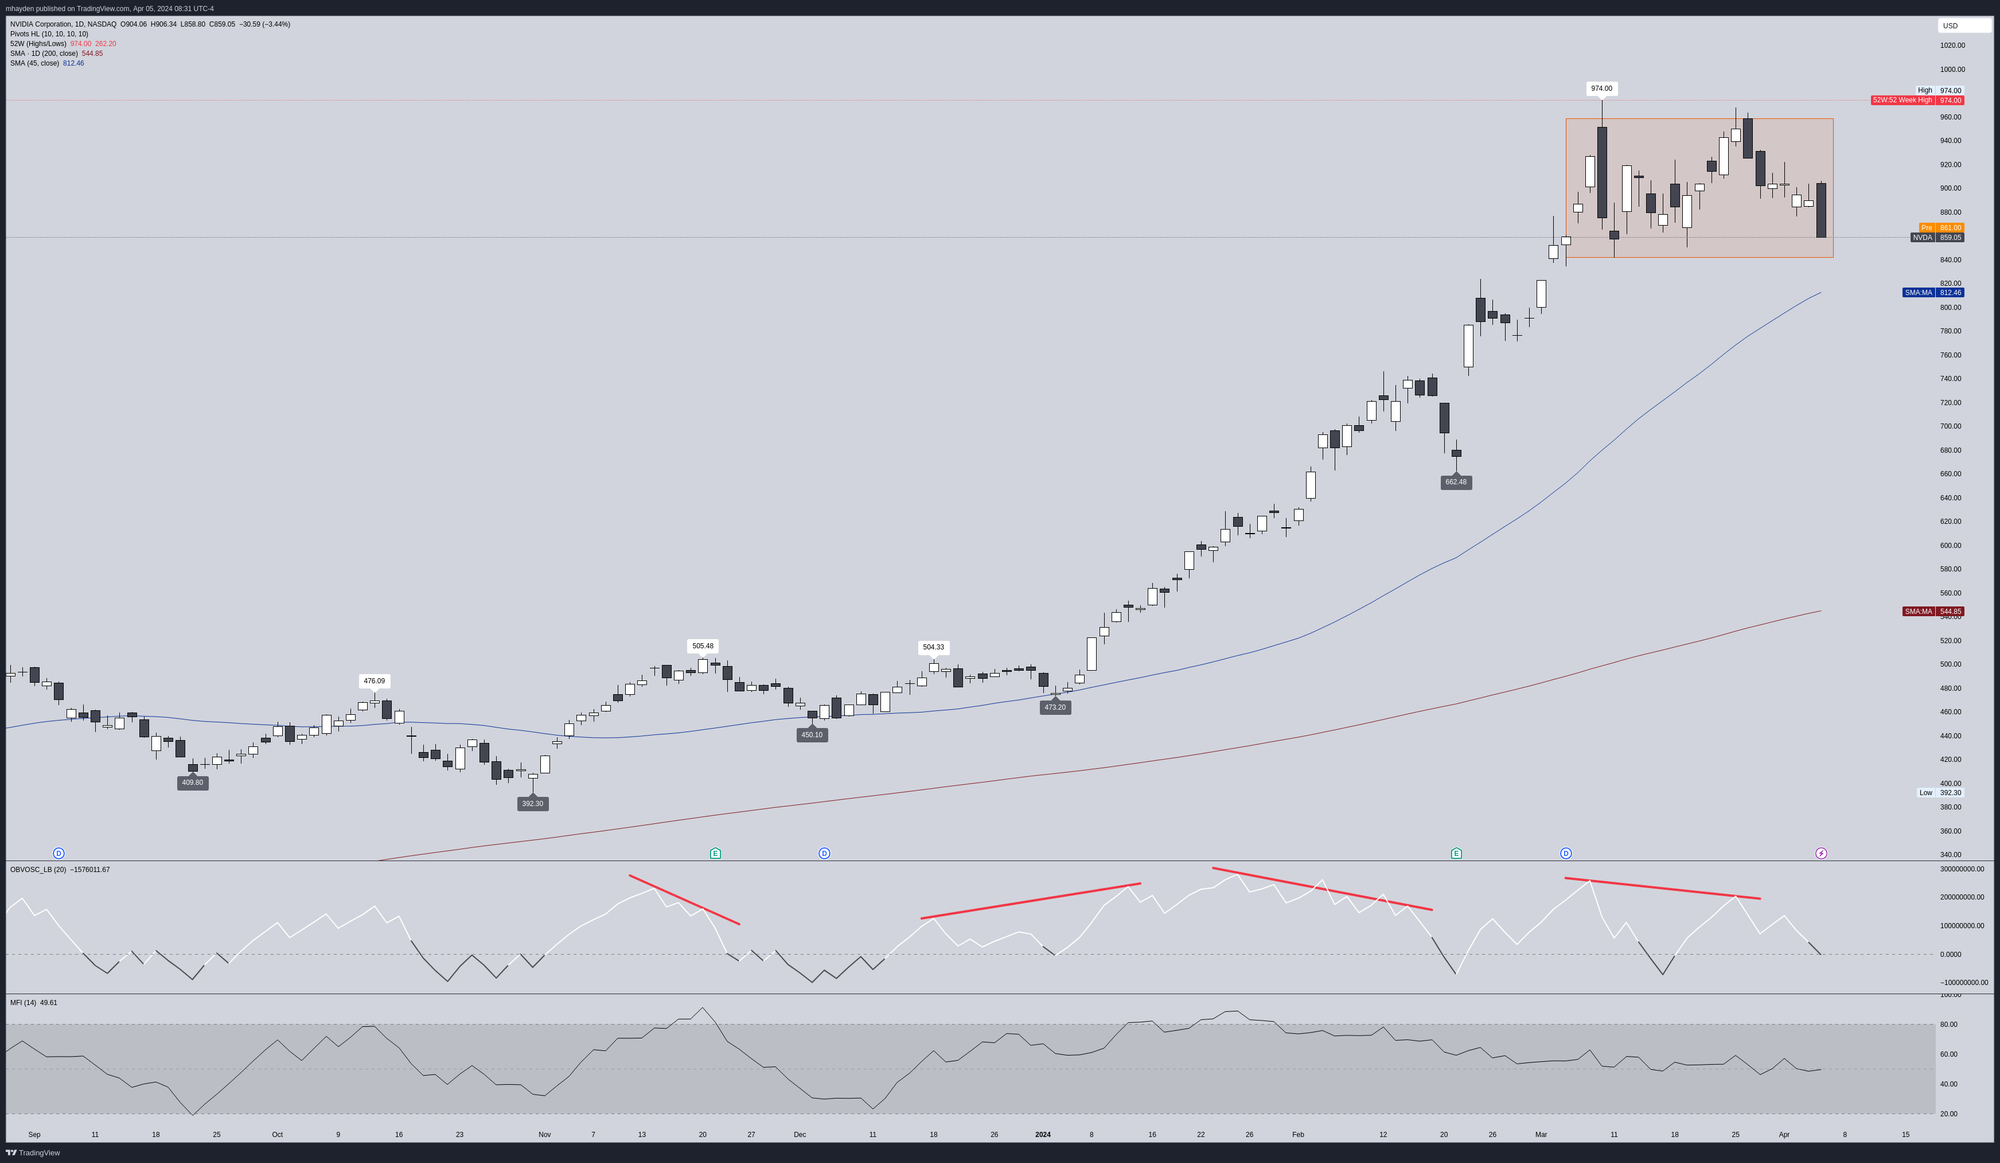
Since the beginning of March, we have a few things coming into play:
- We have a slight bearish divergence in volume as we attempted to make a second high that was lower than the 52-week high. Note that NVDA has done this before a big rally in the past and I like to see volume fall during a consolidation phase.
- MFI remained fairly flat during the recent consolidation. That tells me that buyers and sellers are in a battle here with no clear winner.
- Both moving averages still have a very positive slope, which indicates longer term strength.
- We don't really have any blow-off tops lately on NVDA (as we do with AMD).
At the moment, this has all the makings of another rally after the consolidation. I would get bullish on NVDA once more if it can break the 52-week high once more. If NVDA were to slip under the gap around $820, I'd definitely be looking for a bearish play.
Institutions
Let's check some Volume Leaders charts to see where institutions have been interested in trading NVDA shares. First up is a chart since March 4th, the day after the gap up to about $840, including closing trades:
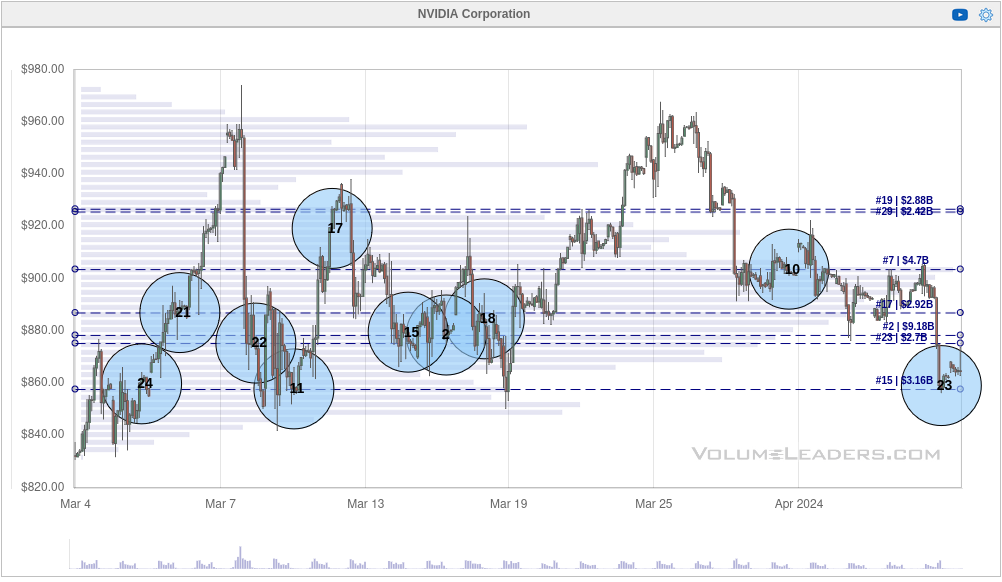
It's difficult to see with all the data, but the #2 volume level is right around $878. There's also a level at the bottom where institutions have been quite interested. That's about $857. Institutions have been extremely active in this recent consolidation area.
Let's remove the closing trades and pick apart what's left:
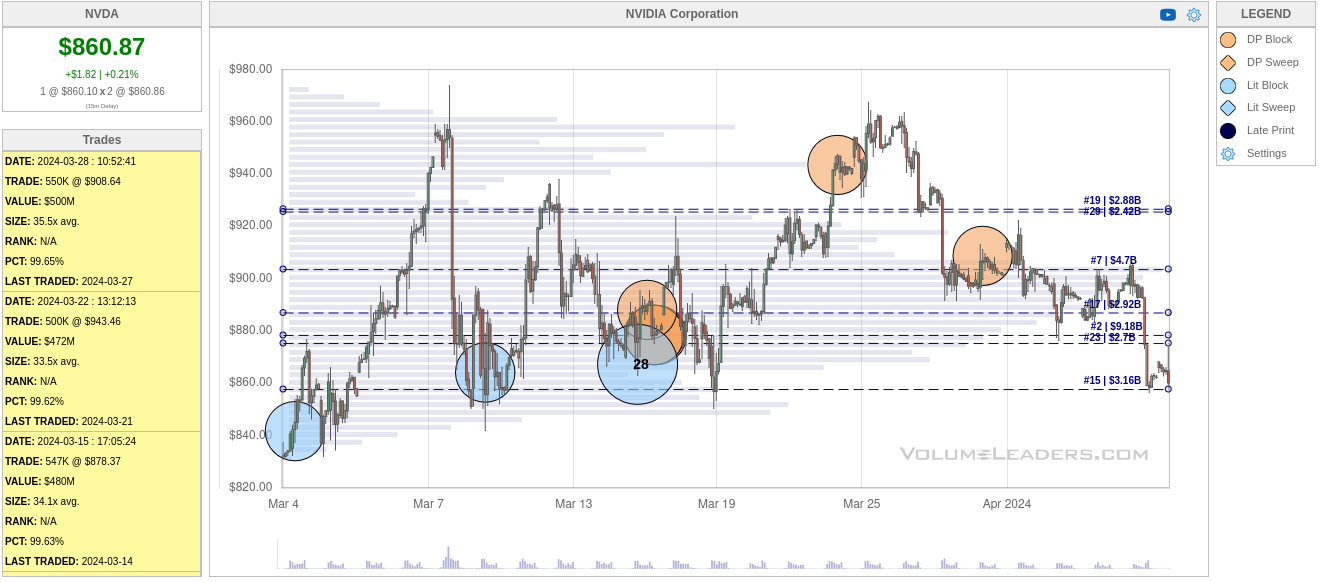
The trade that sticks out to me here is the 28th biggest trade ever at $867.17 for 1,772,953 at a total of $1.54B. This also seems to be a level that was defended during yesterday's drop. There was a flurry of dark pool trades for 500-800K shares each right after that #28 trade. There's something pretty special about this $867 level.
We can adjust the chart further and see only the dark pool (off exchange) trades:
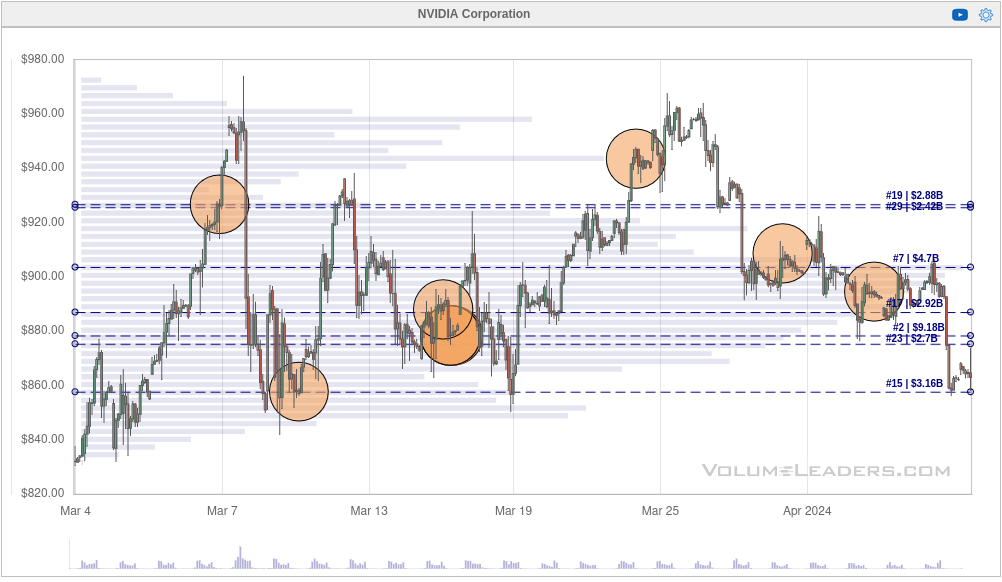
The area around $860 is defended fairly well here and anything $920 or above looks out of reach for the moment. However, there aren't any massive trades at the highs here which lead me to believe institutions are getting out or going short. This will be an interesting one to watch.
Other analysis
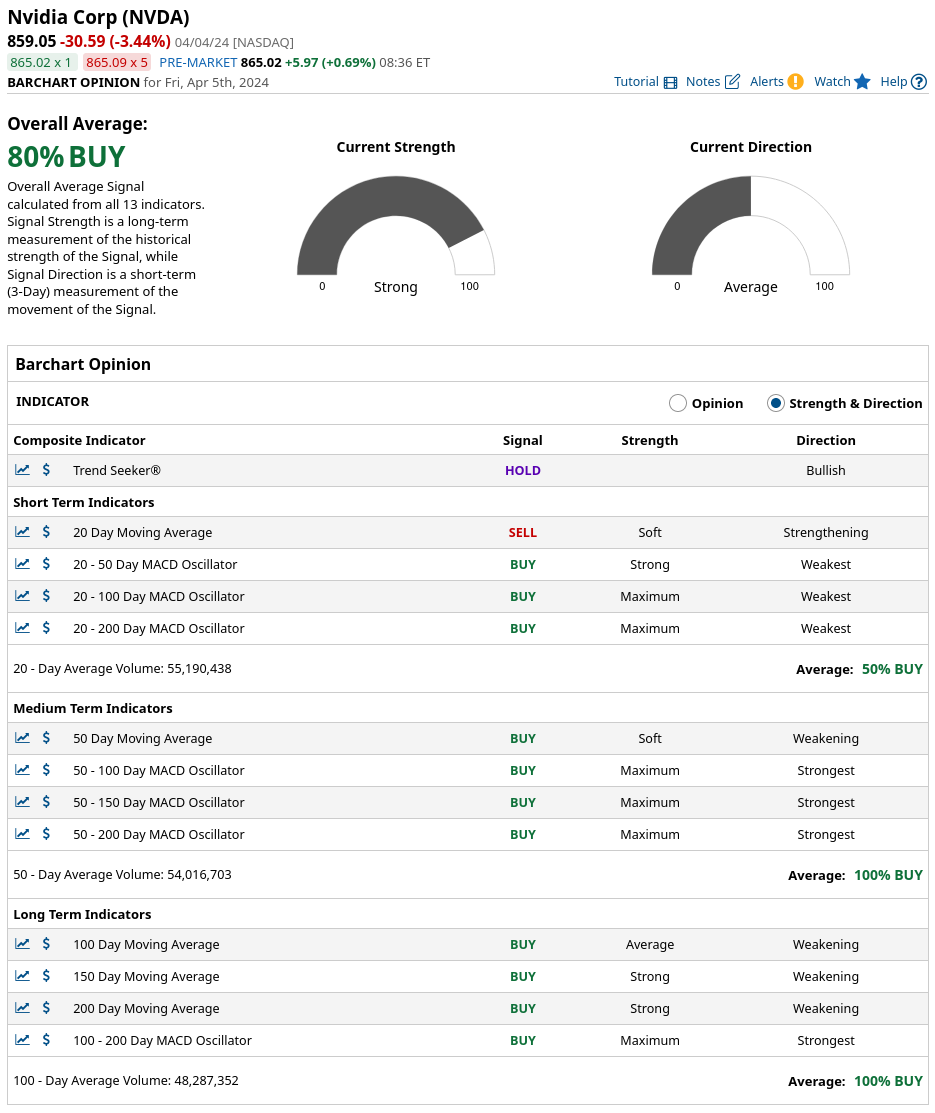
Barchart's opinion (based on lots of various indicators) suggests that the current direction is questionable, but the long term moves are definitely strong:
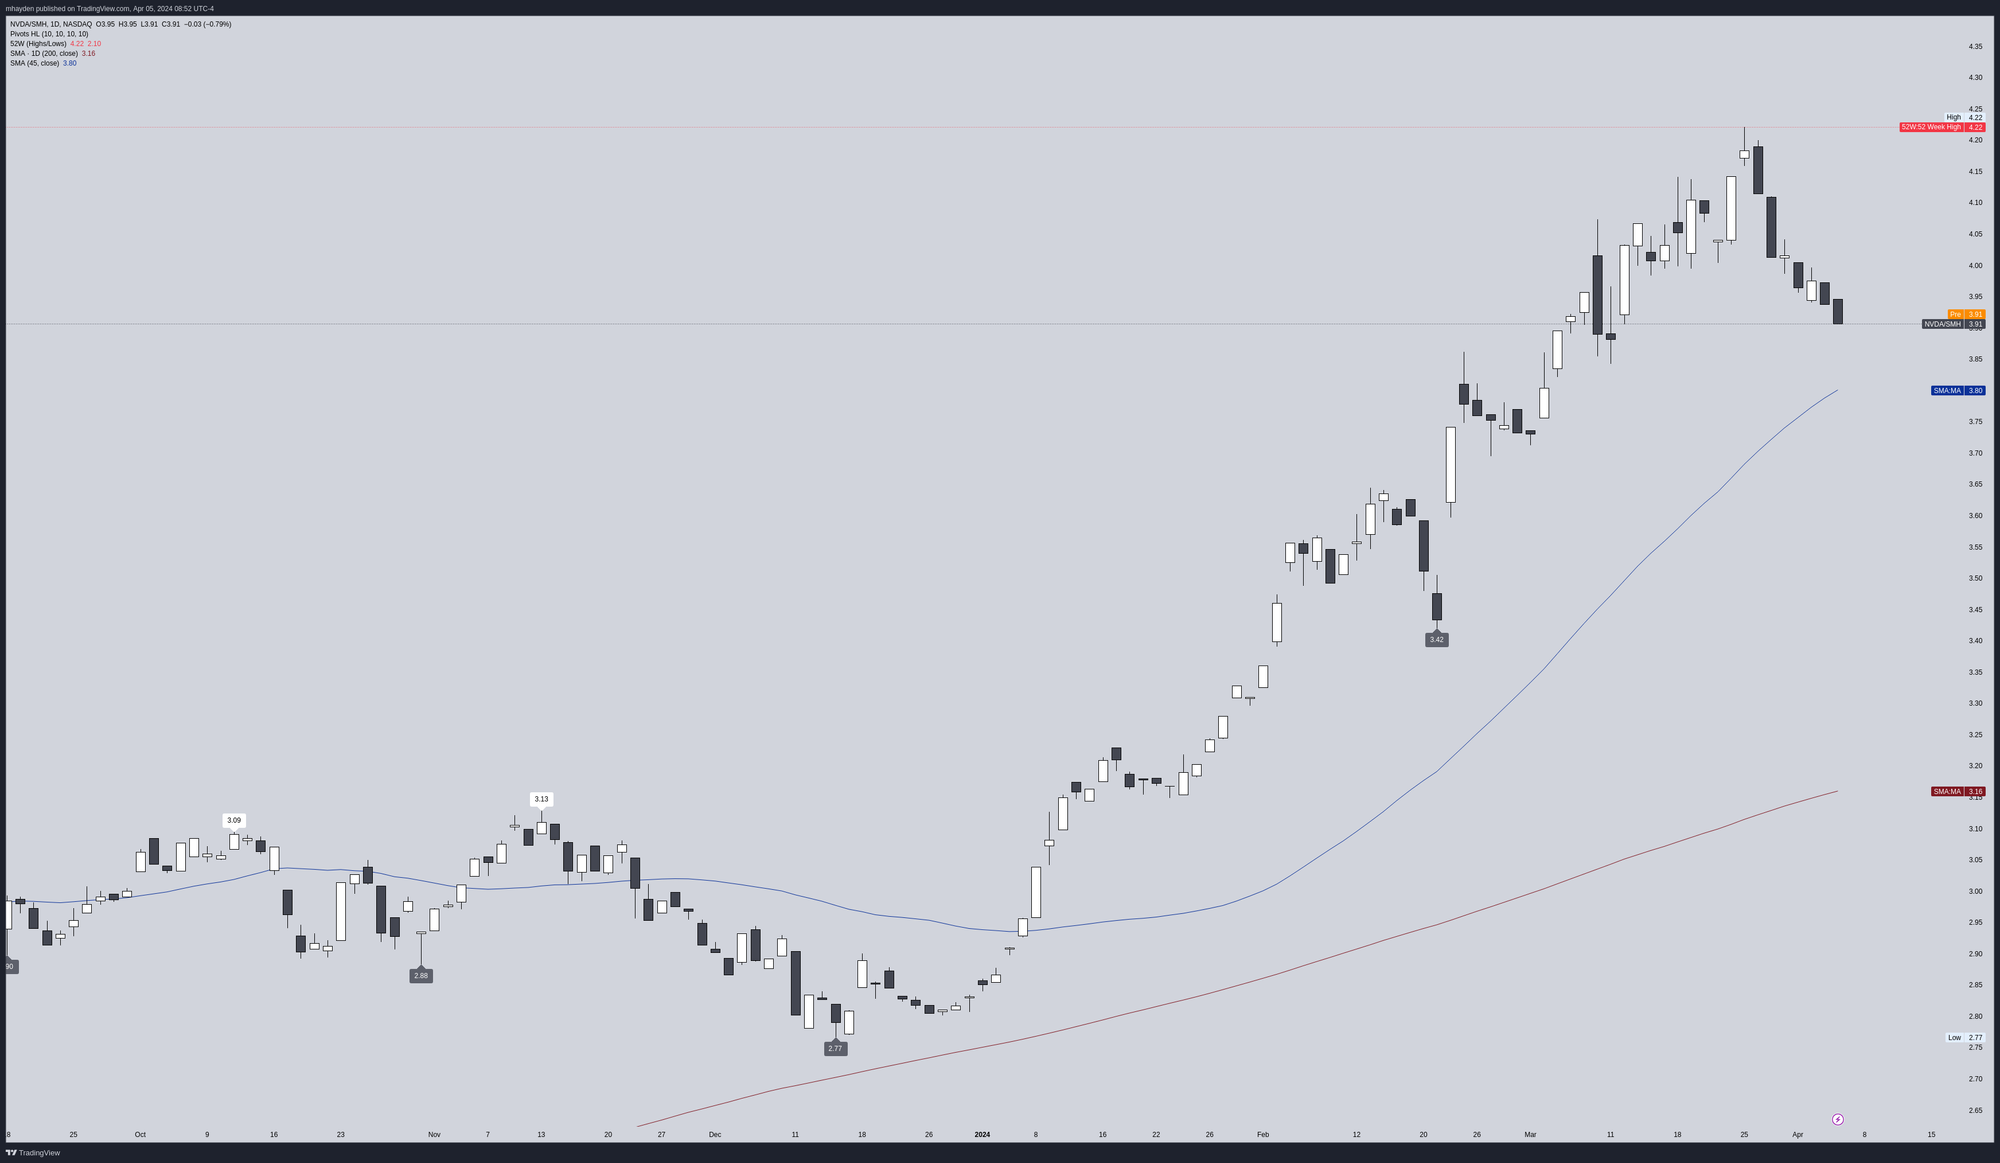
We can examine NVDA relative to other indexes, too. For example, NVDA relative to SMH seems to be losing strength:
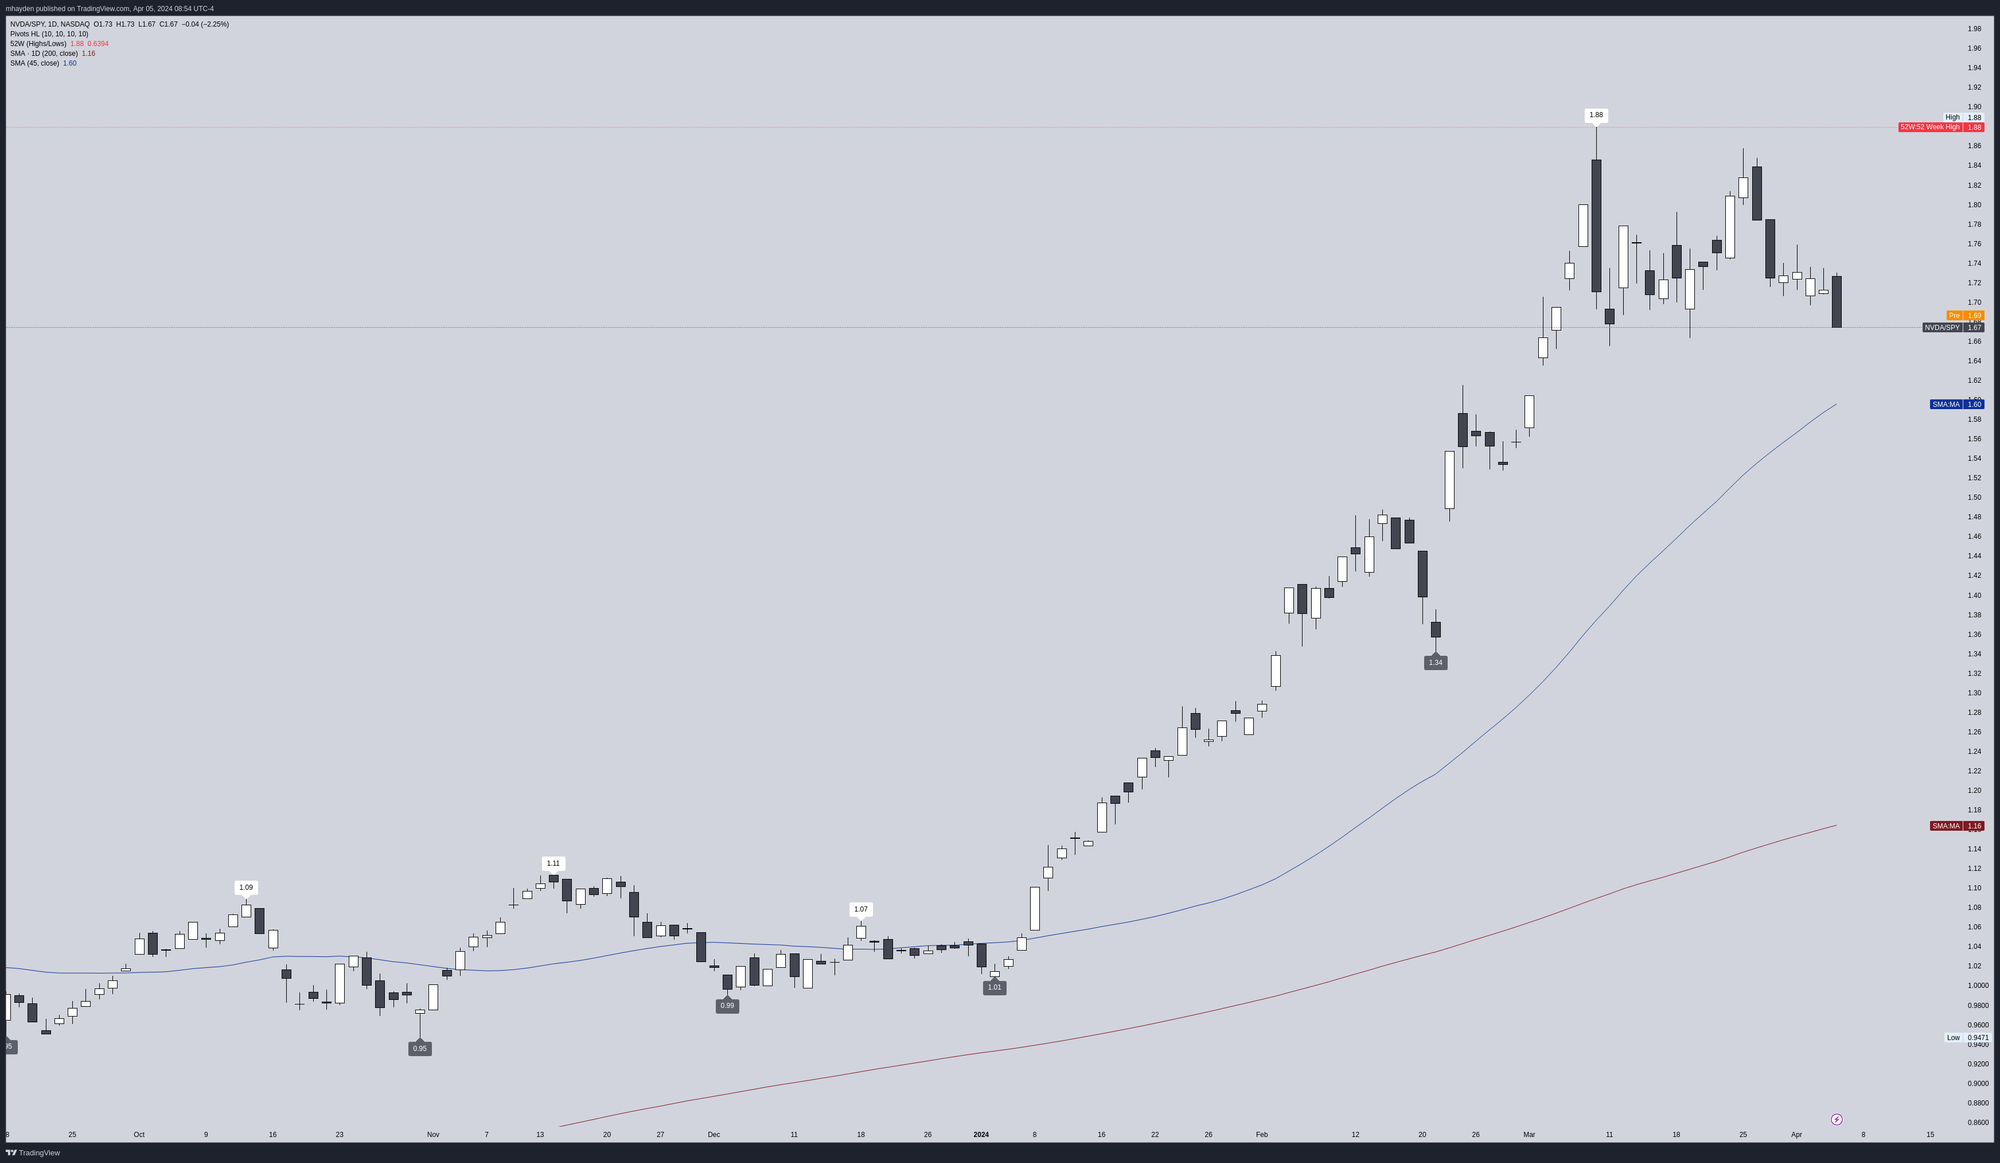
NVDA is such a large percentage of SPY that the comparison doesn't tell me much, but it's worth a look anyway:
Thesis
NVDA looks poised to consolidate and breakout at some point soon. It's difficult to tell which direction that breakout could go. The current rally is broadening out across the market and this could be one of those moments where traders are looking at laggards in the S&P 500 or even the small caps for a rally play. That takes some attention away from the big companies such as NVDA, MSFT, META, and AAPL.
From a fundamentals standpoint, NVDA's earnings have increased four quarters in a row and they've guided higher for the next earnings call on May 22. Income, revenue, and margins are all going up. Anyone who integrates with them, such as SMCI, DELL, or VRT, has gone up drastically. GPU competitors such as AMD and INTC are losing strength.
NVDA's current consolidation and the overall market conditions have made me scratch my head a bit, so I've made a defined risk play with a short put spread in NVDA:
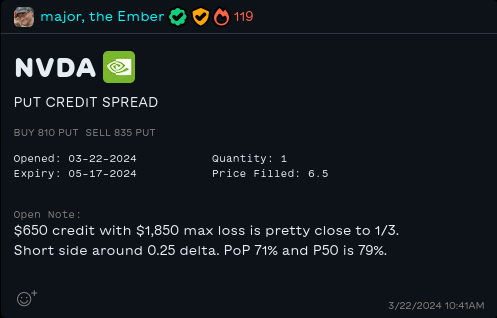
The current price makes a short put fairly capital intensive (almost $20,000 of margin required) and I'd like to avoid a position that large for the moment. My goal here is to take 50% profits on this spread or manage it when it reaches 21 DTE.
Good luck to all of you out there today! 🍀
Discussion