It's NVDA earnings time 😱

NVDA earnings hit the wire tonight! Let's dig into some charts and see what institutional traders have been up to lately. 👨💻

That time of year has come around once more: NVDA's earnings call. We get a look at their latest results after the close of the market today, and as usual, everyone is making their bets on how this will affect the overall market.
All investments come with significant risks, including the loss of all capital. Please do your own research before investing, and never risk more than you are willing to lose. I hold no certifications or registrations with any financial entity.
Let's dig into the data in front of us today and determine whether there's more risk to the upside or downside. 📈
A word about earnings
Before we start, how about a quick message about making trades around earnings calls?
I've seen lots of different scenarios:
- Options buyers lose on bullish and bearish positions because of IV contraction after earnings
- The earnings data is stellar, but the stock sells off
- The earnings data is horrible, but the stock goes through the roof
- The price goes one direction as soon as the earnings data hit the wire, but then it goes an entirely different direction once the company has the earnings call itself
My rule of thumb is this: if I have trades on that I would normally have on for a particular stock and earnings approaches, I usually leave them in place. I rarely try to make new trades right around the earnings call. That's a recipe for disaster.
Zooming out
Let's start with a broad weekly chart since the 2020 COVID lows. NVDA made a nice rally in 2021, fell back a bit with interest rate worries in 2022, but launched a rally off an inverse head and shoulders. NVDA has been on an absolutely wild rally since 2022.
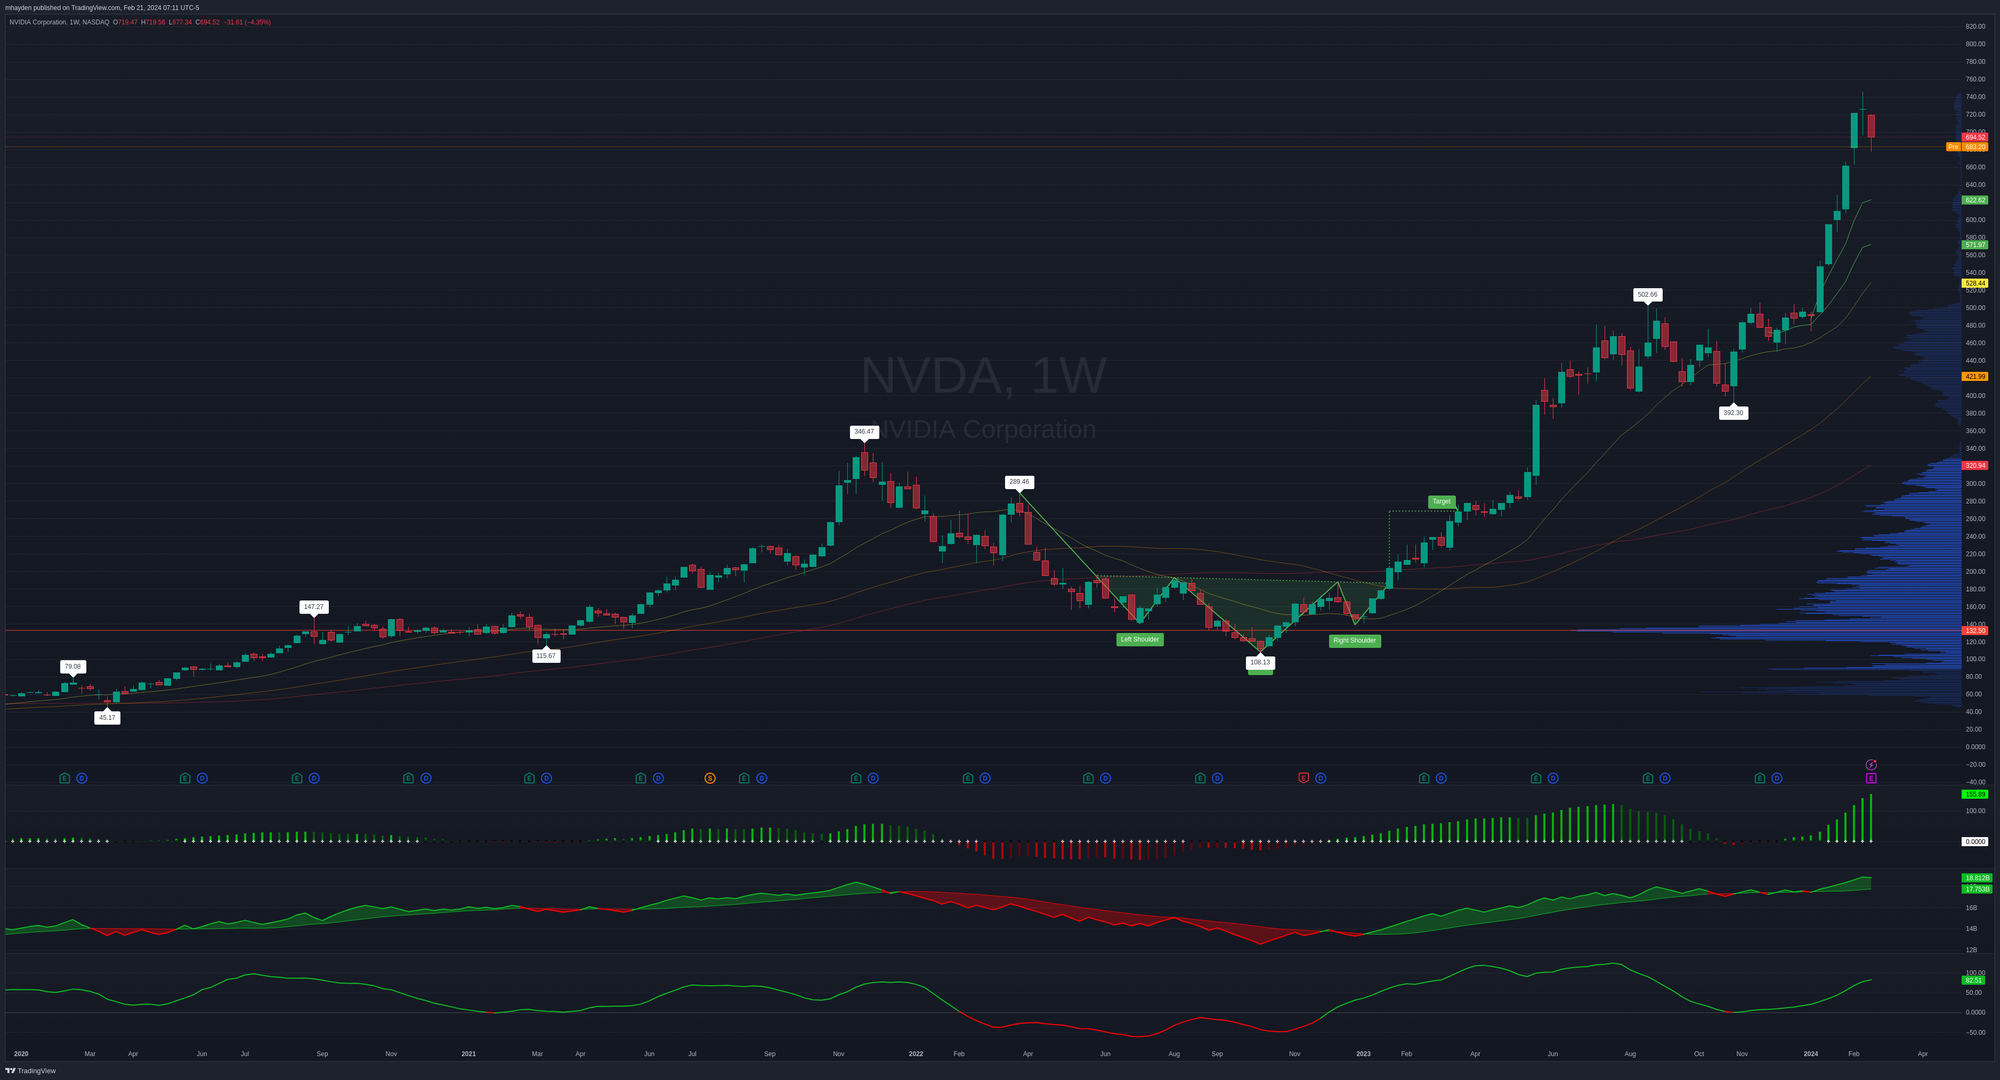
I'm a technical trader and the recent rally checks a lot of boxes for me:
- Rally cooled and consolidated in the $400's before moving higher
- Every indicator shows strength right now
- NVDA remains above VWAPs and properly stacked moving averages
The only concerning bit for me is that volume past $500 has not been as strong as I'd like to see. That could put NVDA on a weak foundation going into earnings.
The 2024 rally
The second half of 2023 was mostly a consolidation period in the $400's before a big move up in 2024. I'll switch it up to a 195 minute (2 bars per day) chart here since the low on January 3rd, 2024:
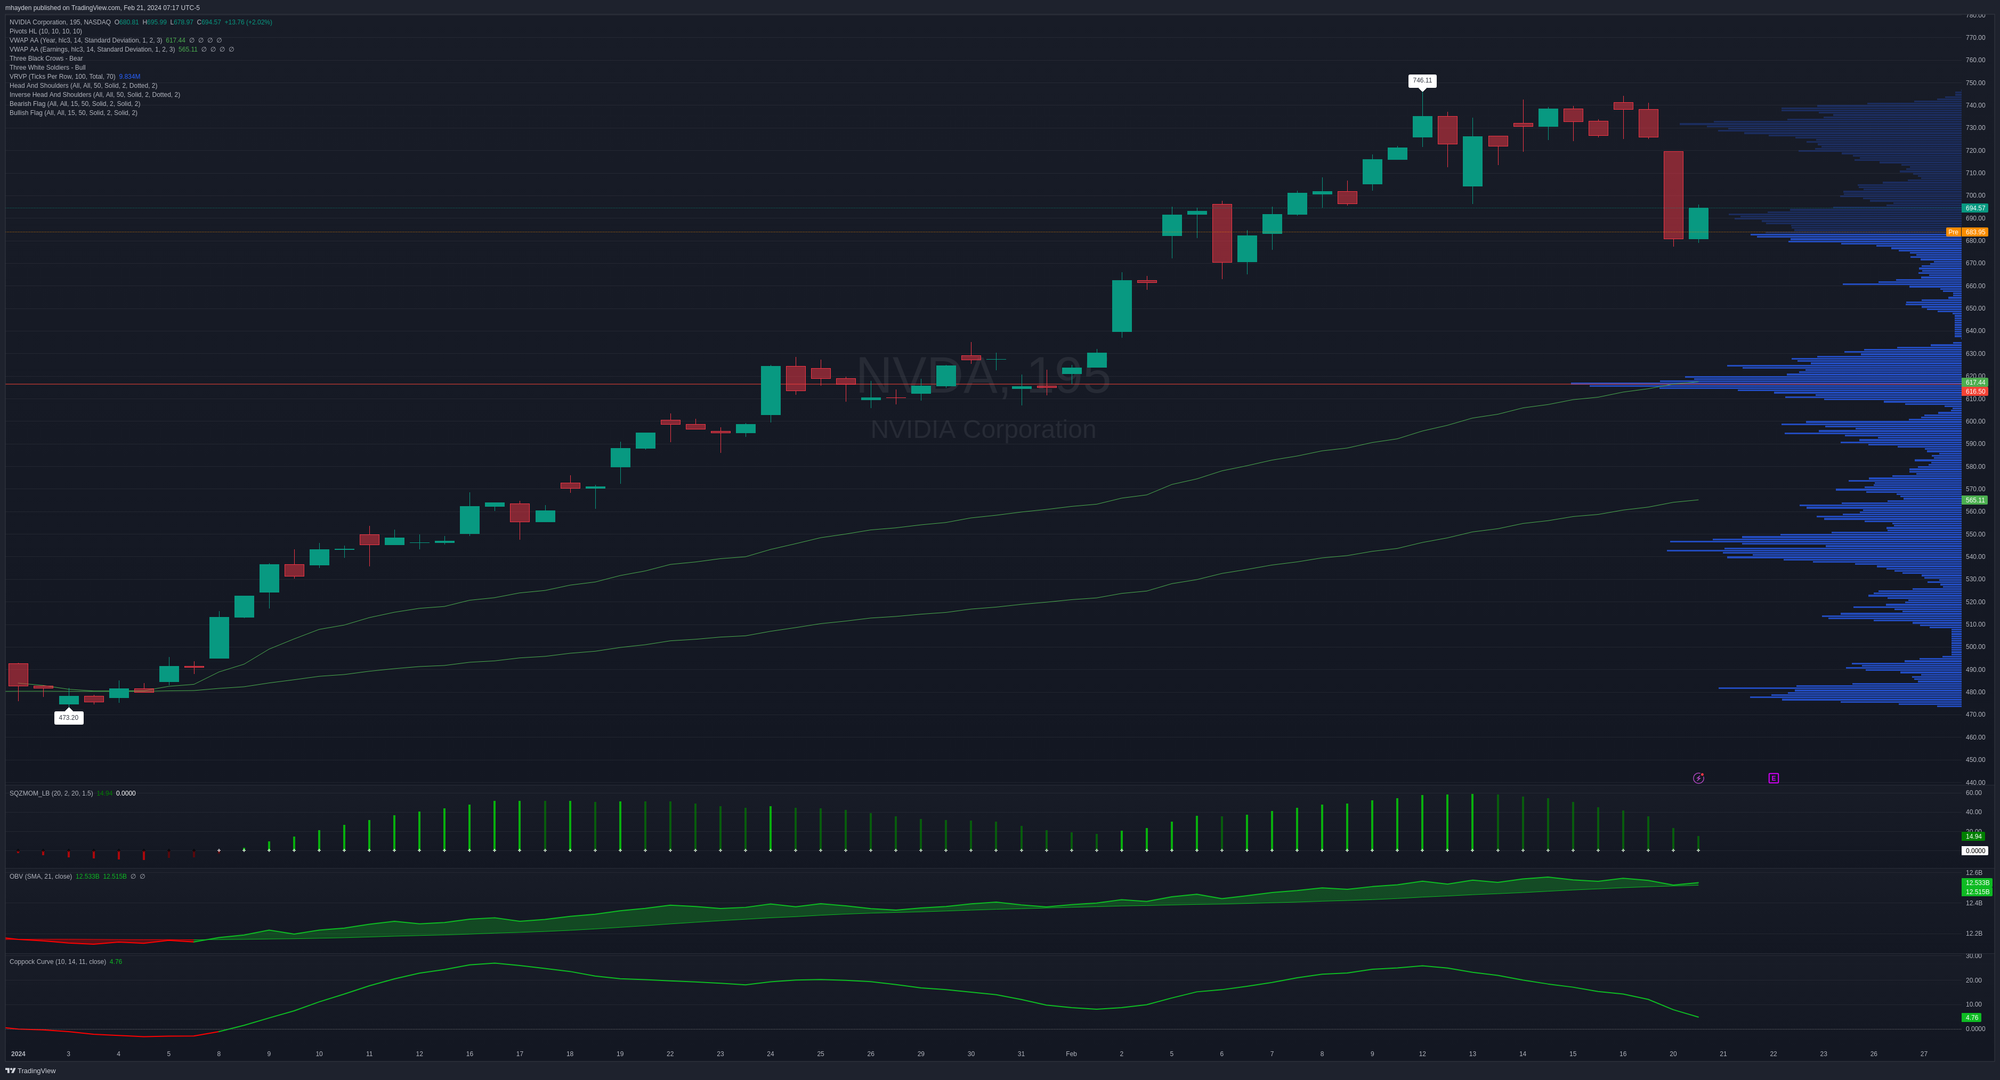
NVDA remains above its YTD and earnings VWAP lines and the on-balance volume indicator shows that volume is supporting the upwards move we've seen so far. However, the Coppock Curve and TTM Squeeze indicators are pointing at some weakness. This could be pre-earnings jitters or it could be another consolidation area.
The highest volume area sits around $616, but we have lots of spots without much volume, especially elsewhere in the $600's. These areas sometimes show up as resistance since price likes to seek out higher volume areas, but they can also be spots where gap downs can occur after the market is closed.
That $616 area is also interesting since it's the same level of the VWAP from the beginning of the year. VWAP lines often provide support and they're a good sign of weakness when price drops through them.
Institutional trades
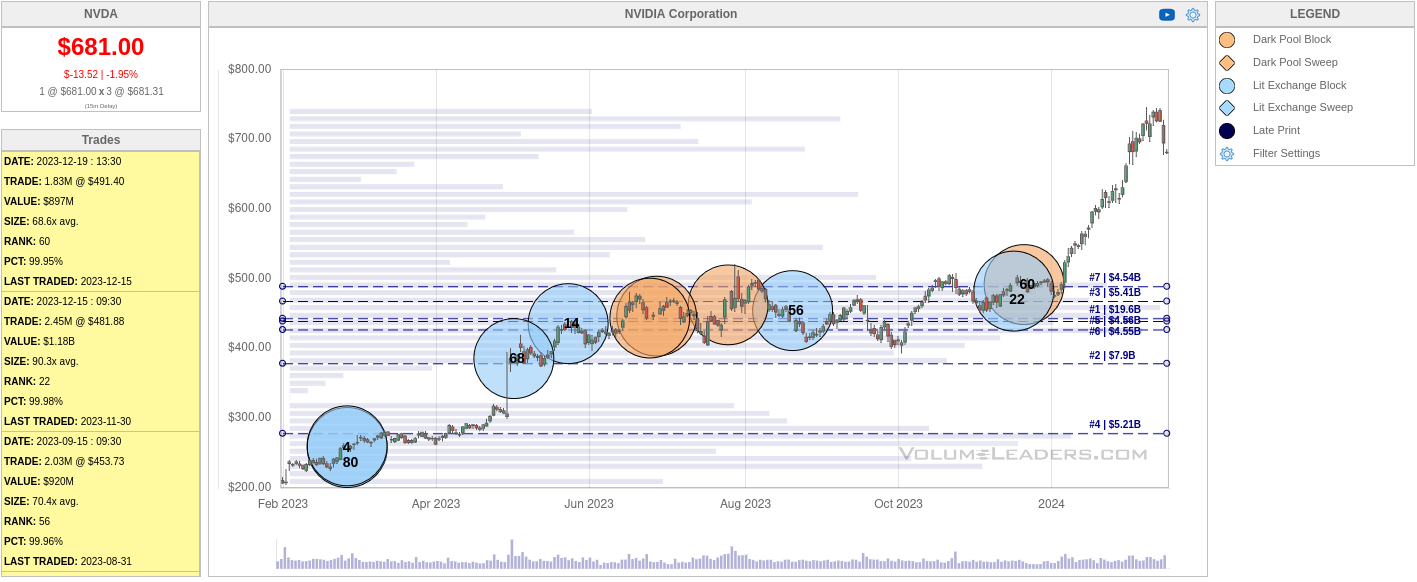
Volume Leaders offers charts that show where big trades are made. However, these charts don't show directionality. All we know is when the trade happened, how big the trade was, and the price at the time. It's up to use to infer what was happening at those times.
Let's start with a chart showing the past year. We have tons of activity from $400-$500 here and that lines up with the volume indicator in our stock charts. This is another one of those examples where NVDA began consolidating and institutions started making some big trades as quietly as possible. However, I don't see any trades recently that suggest big money is leaving NVDA.
How about the trades since the last earnings call in November? We see the end of the consolidation trades and some new trades here at the top. These could be areas where institutions are taking profits or we could be starting a new consolidation area. These trades here at the top are smaller, so it could be a sign that institutions are reducing their overall risk going into earnings but not exiting their entire positions.
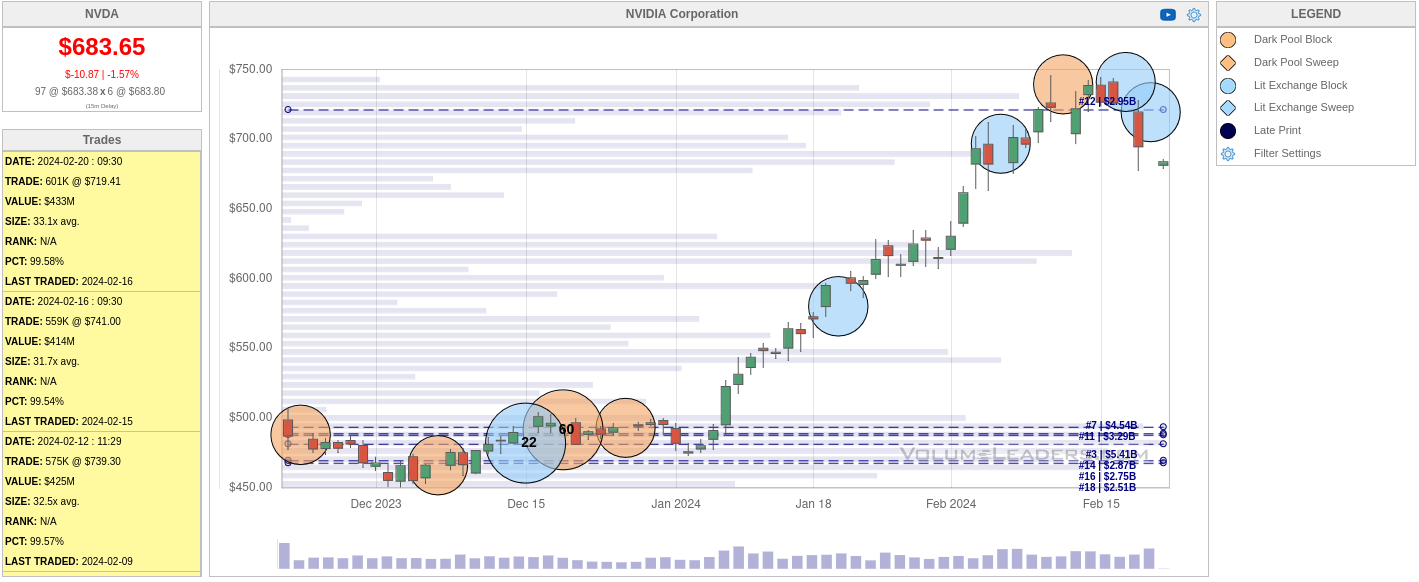
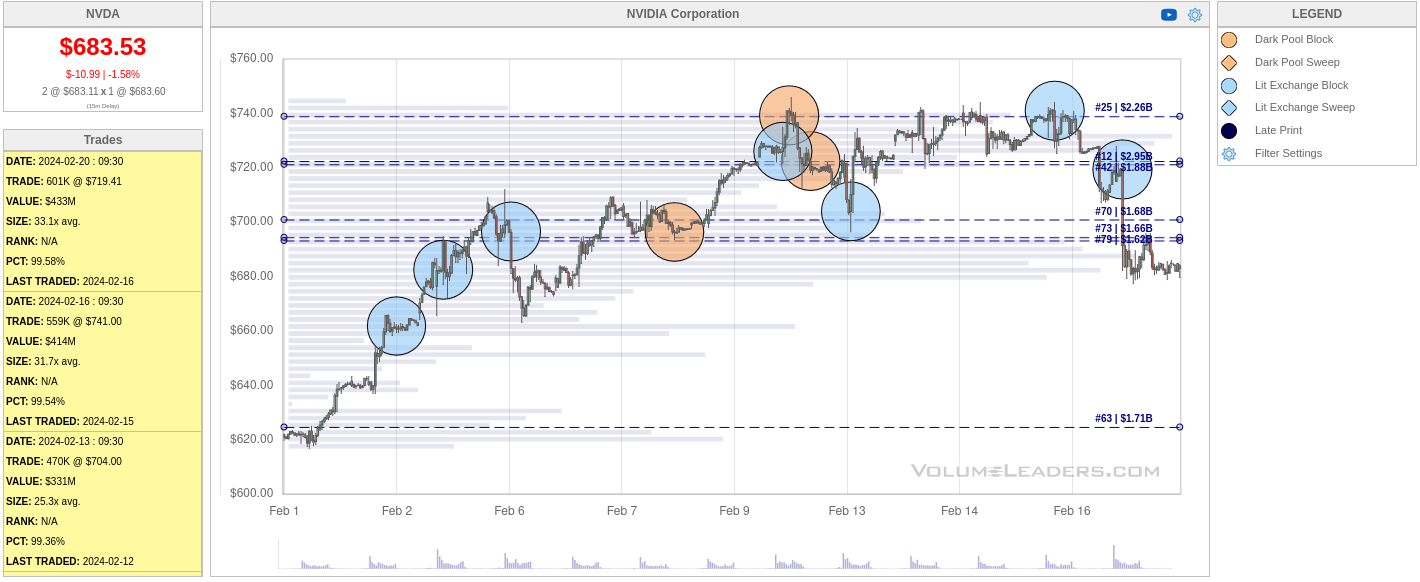
Our last chart shows the trades made in February. The run above $700 doesn't seem to be working out very well as we have several rejections here around the $740 level. Multiple large trades were made around $740 as price bounced down and we seem to be stuck around $690 from yesterday. $620 appears here as a potential support level with almost $2B in volume.
Thesis
NVDA's rally certainly looks great, but it's on a weak foundation lately. We have large gaps in volume in the $500's and $600's that price might be able to slash through in after hours trading. The consolidation and institutional buying in the $400's is undeniable, though.
The biggest risk I can find on NVDA's chart is that $500-$700 zone where there's not enough volume to support the price.
I sold two $655 puts a while back that expire on March 15th. They're down a bit right now since I sold them and my breakeven is around $640. This is a bit above a bigger volume level around $620 where the YTD VWAP sits today.
These are definitely risky trades, but I made them based on NVDA's price action and I don't consider them an earnings play. If I had long NVDA shares going into this earnings call, I might trim a little, but I doubt I'd be selling my entire position.
Good luck to everyone out there today! 🍀
Discussion