Time for an NVDA earnings special!

It's the NVDA pre-earnings special! 🎉 Let's dig into all of the data and see if we can make a guess at where we're going today.

All eyes seem to be on NVDA this week as they report earnings after the bell today, August 23. I don't trade NVDA right now, but I do trade AMD and there's a high chance that AMD gets pulled in one direction or the other by today's earnings call.
This post will feature NVDA exclusively and I'll get back to my usual analysis tomorrow. 😉
All investments come with significant risks, including the loss of all capital. Please do your own research before investing, and never risk more than you are willing to lose. I hold no certifications or registrations with any financial entity.
Let's get into the data!
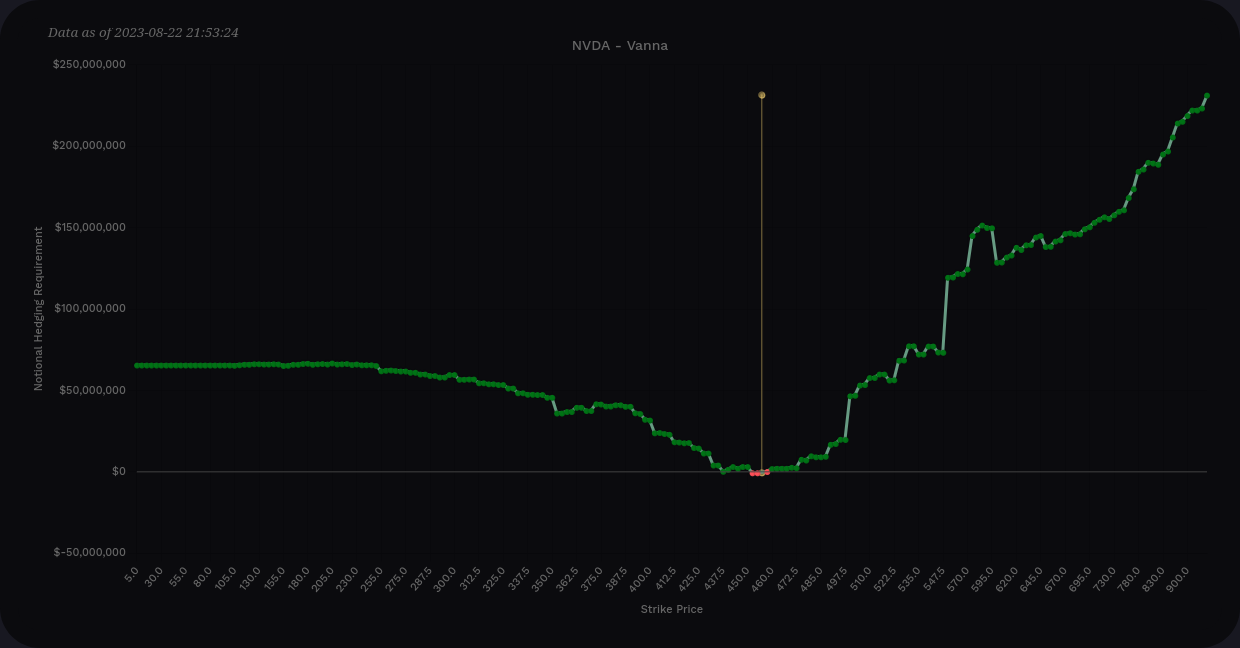
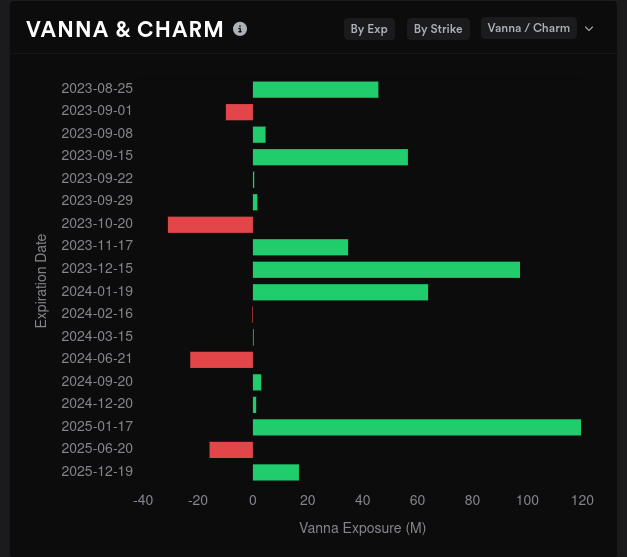
Vanna
I'm a firm believer in vanna effects, especially when implied volatility (IV) will make a strong move in one way or the other. IV typically drops after earnings and we can get some bullish moves from positive vanna in these situations.
NVDA's aggregate vanna is almost entirely positive except for some negative vanna around $600. $550 is the largest positive bar with $500 coming in second. This leads me to think that a significant drop in IV could pull us towards $500.
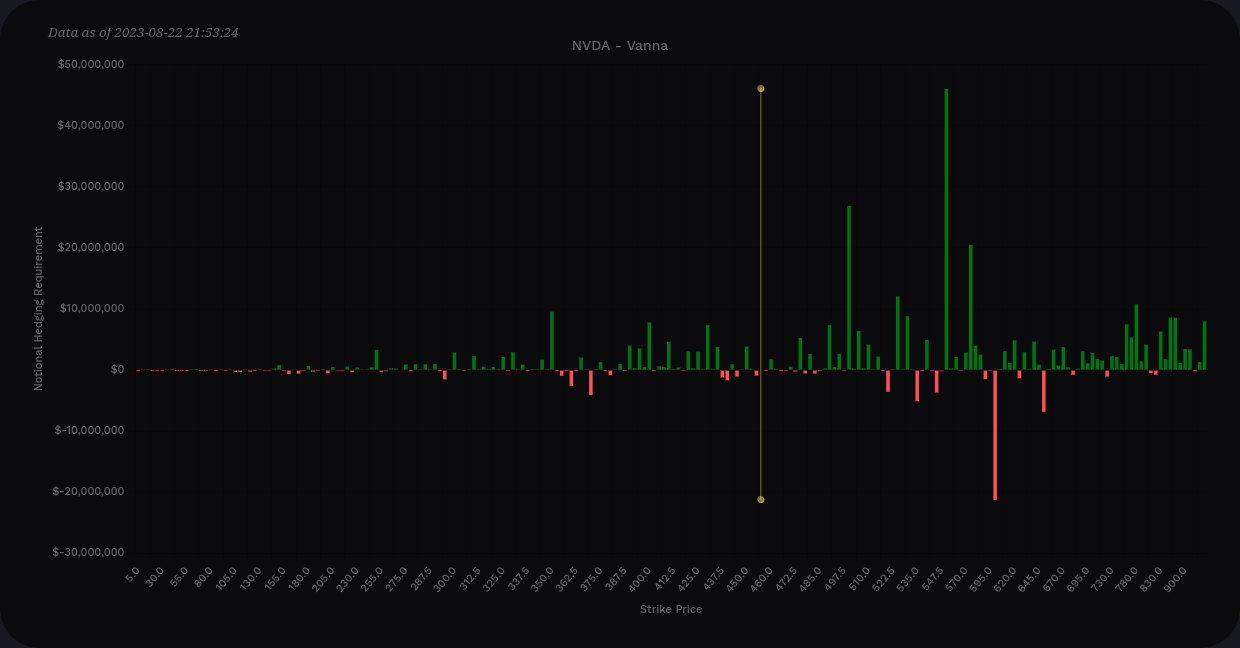
However, if something goes wrong and NVDA begins to drop, especially in conditions where IV is increasing, we don't have much resistance to moves down. $350 looks like a spot where we might slow a bit, but that's rather small.
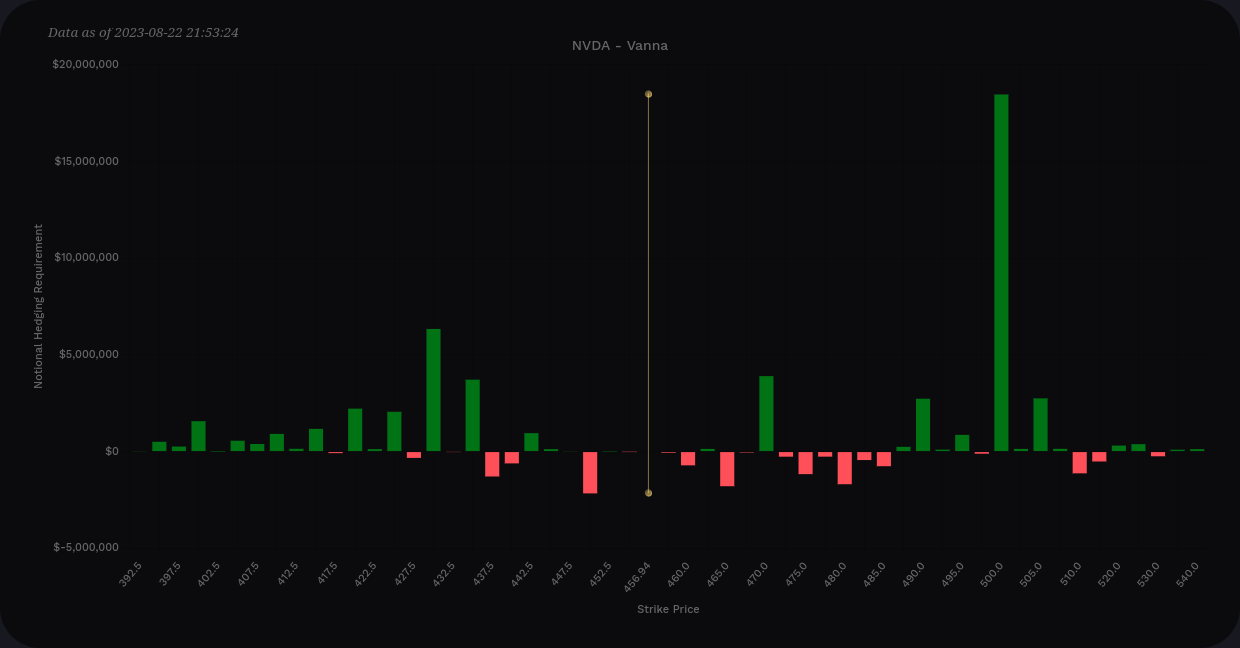
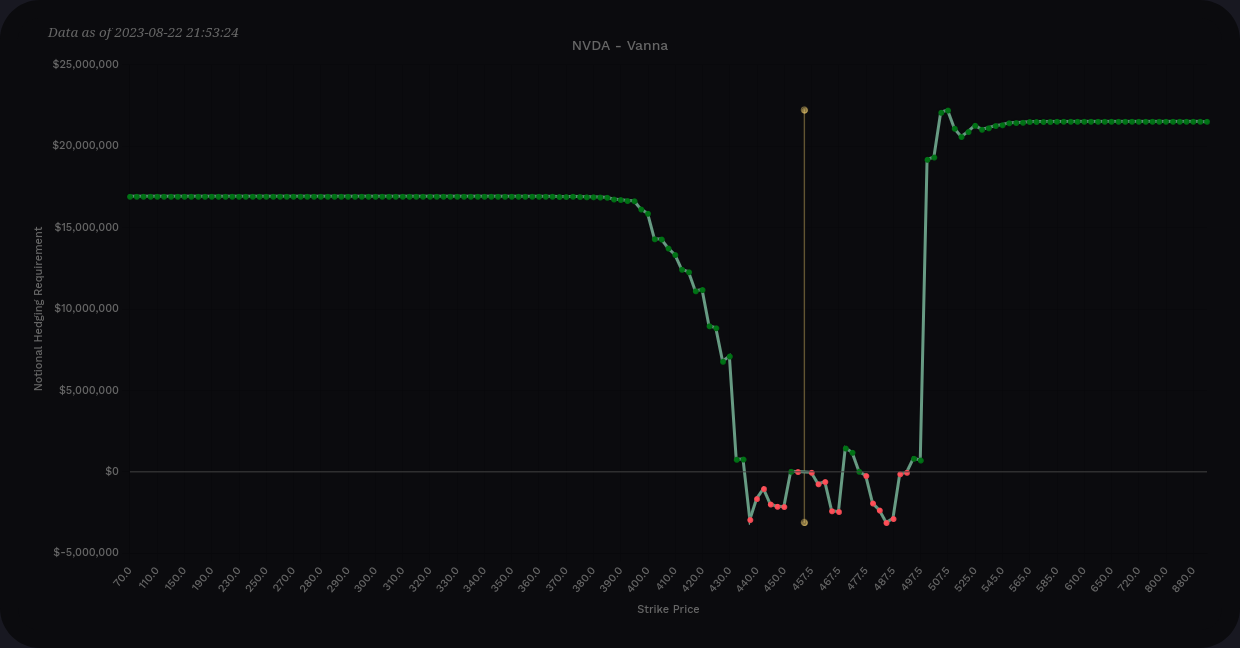
Let's isolate the 8/25 expiration. We are still positive across the board with $500 showing up as the biggest pull for price if IV drops. $430 might resist a downside move slightly, but there's not much here to slow a downside move.
Options positioning
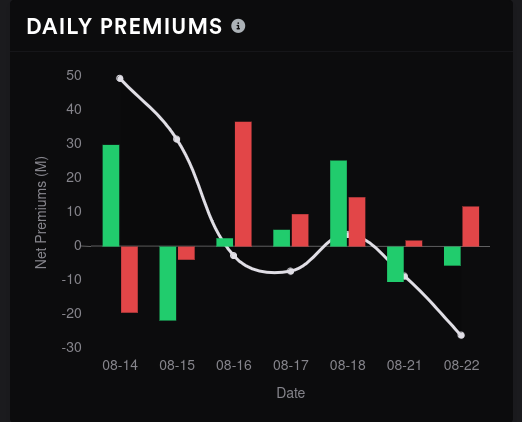
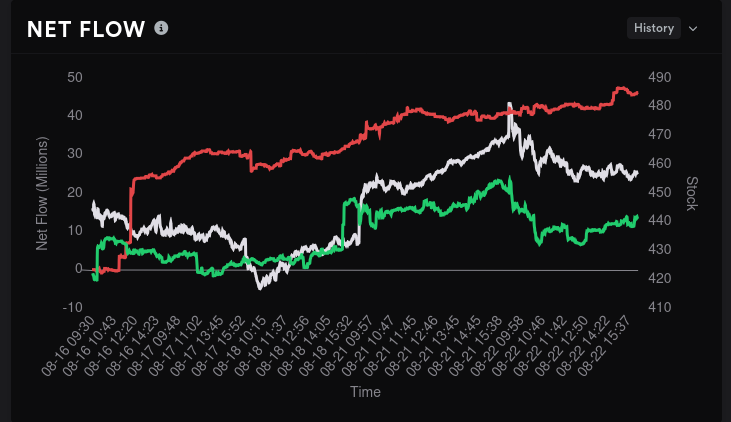
NVDA's overall flow has been bearish over the past five days, mostly coming from aggressive put buying on 8/16 and short calls on 8/21.
Normally, I would use 15 day dealer greeks buildup to determine whether customers were short or long, but the backtest here doesn't show much of an improvement. Also, dealers and customers seem to be just about even on bullish and bearish contracts anyway.
Options are priced for a move to the downside as of this morning.
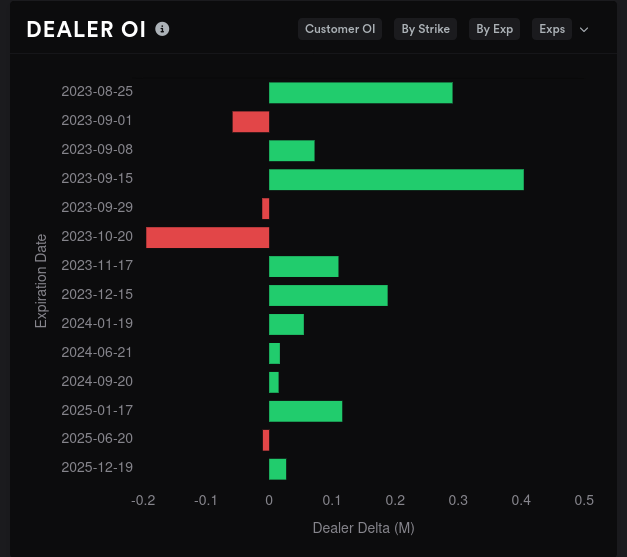
Dealer open interest suggests that 8/25 and 9/15 are bearish, but check the x-axis. The dealer deltas are very small for all of these bars. This tells me there's plenty of indecision in the market for NVDA. On the vanna side, almost every expiry has positive vanna stacked up. Contracting IV should apply bullish pressure to NVDA's price.
NVDA's aggregate GEX shows the largest price magnet around $460 and that's just above the current price. $400 and $500 also show up as large negative GEX bars. There's more resistance to the upside than there is the downside, which worries me if price starts moving down. Just as we saw in the vanna charts, if NVDA starts to falter, there's not much to slow it down for a while.
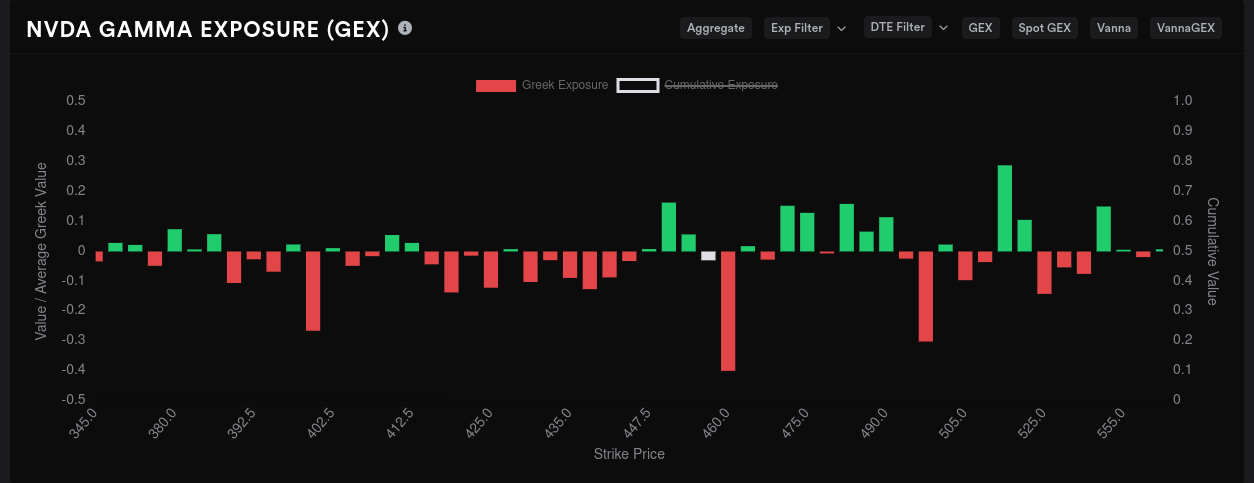
If we isolate 8/25 data only, the $460 stands out even more. $480 shows up as resistance to the upside. Again, the downside looks like a disaster. There's not much to slow down the price if it starts moving that way. 🎢

What are big options traders doing? On aggregate, some traders went strongly bearish on $460 and continued going bearish during the week.
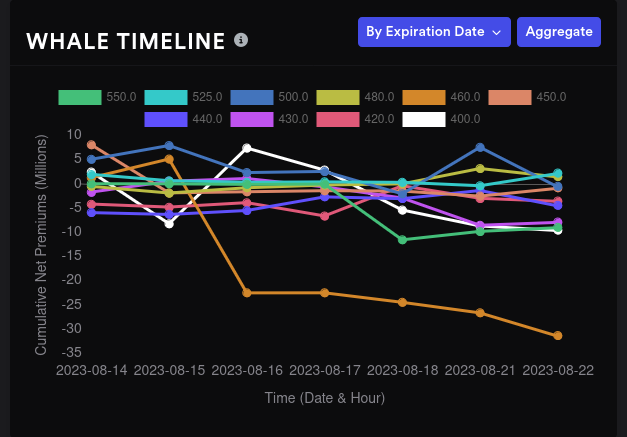
If we limit the whale data to 8/25 only, we see the $460 moving here:

The next OPEX, 9/15, shows that some big traders went sour on $400 only to pull back those bets. $500 went very bearish yesterday.

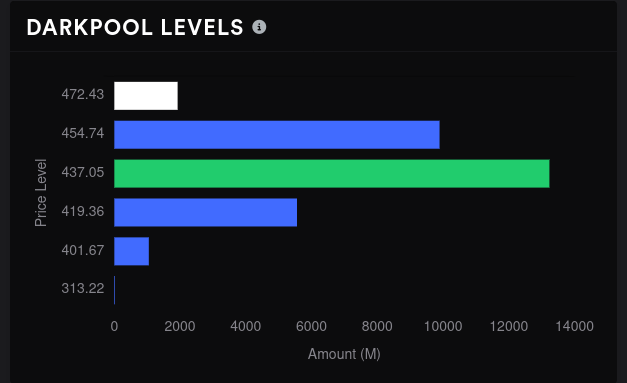
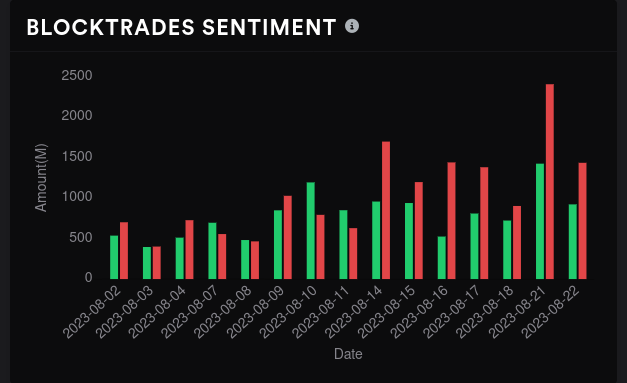
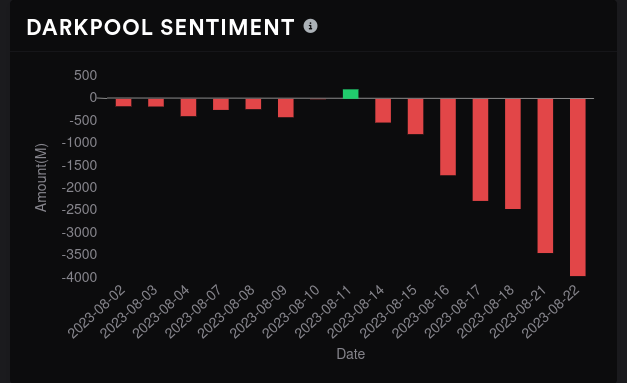
Dark pools
I don't put a ton of faith into dark pools, but I do like to see if they correlate with some other data I've found.
Oh boy, I don't like this. We have volume increasing as sentiment turns more negative and our largest volume sits well below the current price at $437. On the plus side, price movement to the downside may be slowed a bit around $437 (we saw vanna effects around $430 earlier).
Other data
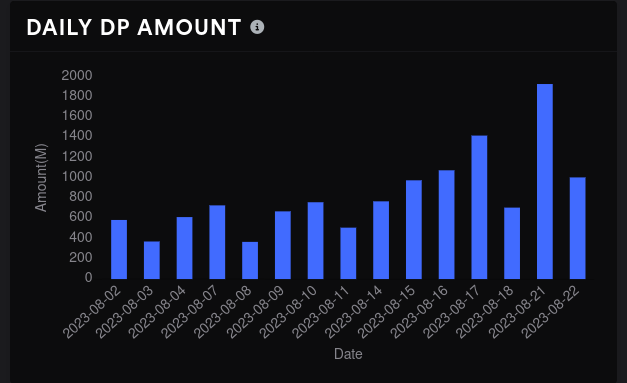
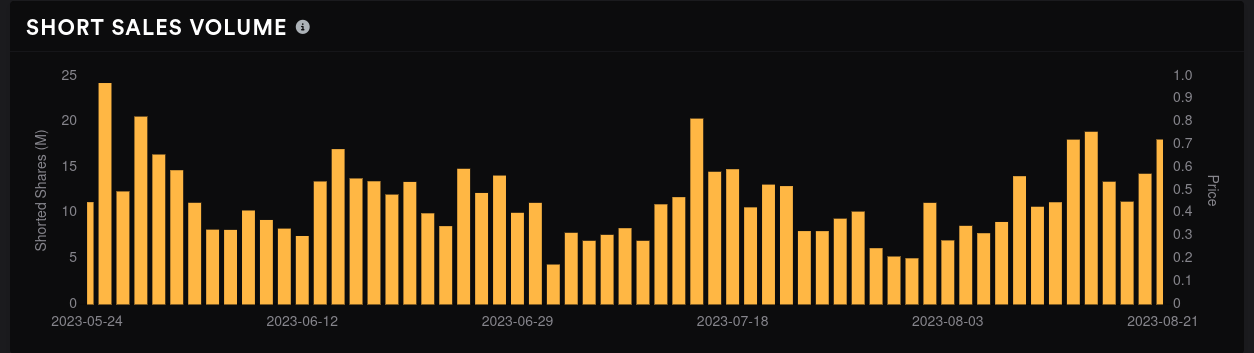
Short sales have increased recently, too. This is important to note because short sellers might be buying calls to hedge their short positions in case earnings are a surprise to the upside.
A rundown of technical indicators for NVDA look good overall, but many short term indicators show signs of weakening.

NVDA's chart since the last earnings shows that we're still above the VWAP, which is great. However, our highest volume since earnings is down around $425.

Thesis
Again, I don't trade NVDA right now and I usually try to stay away from earnings. However, I am playing both sides of the earnings using AMD by covering most of my shares with calls and I have a short put at $105.
This looks like a really risky earnings call, and although I don't provide financial advice on this blog, my caution is running high here.
First, there's not a lot of help to slow down a run to the downside. GEX looks quite flat below the current price and we saw that there isn't much of a vanna effect there.
Second, although $500 definitely looks like an upside target, there's a chance that $480 could provide some resistance. Dark pools look extremely bearish and our highest volume sits almost $20 under the current price. Volume by price puts NVDA's highest volume since the last earnings call around $425.
Third, the hype around AI can vary widely and although NVDA has some of the best products in the business for crunching through data, investor sentiment can whipsaw quickly.
Good luck to everyone out there. 🍀
Discussion