NVDA update for October 2024

NVDA earnings are coming on November 14th and it's been consolidating since the stock split. What are the odds of a move higher this fall? 🍂

Happy Monday! It's been several months since I did a deep dive on NVDA and today seems like a good day for another look with NVDA's earnings looming on November 14. I'll dig into some charts and analyze some institutional volume in today's post.
But first:
All investments come with significant risks, including the loss of all capital. Please do your own research before investing, and never risk more than you are willing to lose. I hold no certifications or registrations with any financial entity.
Let's crunch some data!
Charts
NVDA has been stuck in a consolidation pattern since the stock split in June. Here's a daily chart of NVDA since February:
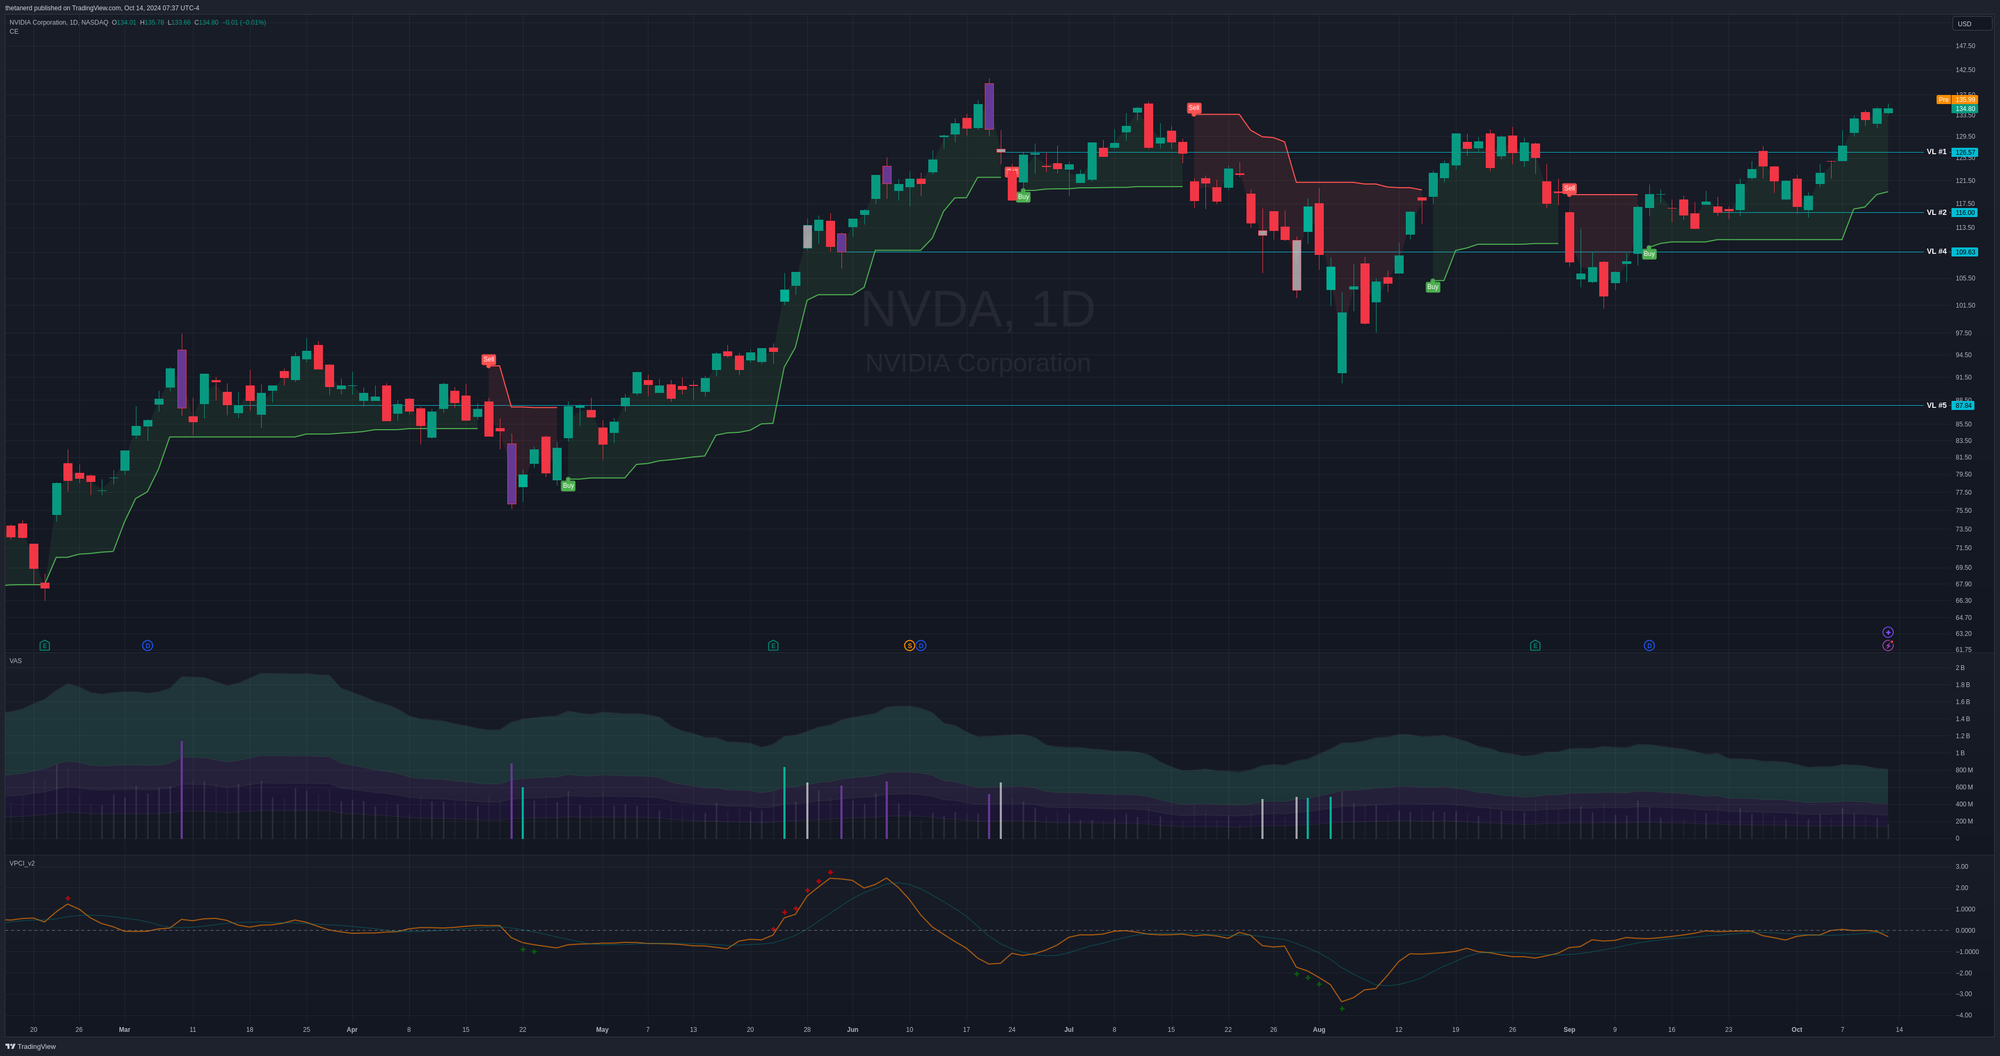
From top to bottom:
- The Chandelier Exit indicator is overlaid on the candlesticks and it measures when the price of the stock crosses above or below the average true range (ATR) threshold. We're currently in a bullish pattern.
- The horizontal cyan lines indicate very large institutional trade made at various price points. NVDA is trading above its largest trades today.
- In the next pane, the volume analysis indicator looks for unusual volume that is bearish (purple vertical bar), bullish (cyan), or unknown (white). NVDA hasn't had an outlier volume day since the early August dip.
- Finally, the bottom indicator is the volume price confirmation indicator (VPCI). It gives hints about whether volume is or is not leading a change in price. This one is complicated, so let's break that down a bit below.
Volume led price after earnings before the split, but the red pluses on the VPCI gave hints that the volume had gone well outside the recent range and would likely pull back or consolidate.
Scan to the right and you'll see green pluses appear as NVDA fell into the early August pullback as fear overtook the market. What's interesting here is that there are some very high volume days around this period as the VPCI headed lower. The two cyan bars on July 31 and August 2 provide a hint that buyers were extremely active in the market at this time.
V-bottom patterns are one of the best patterns to find in the VPCI. It usually signifies that volume has moved well outside the normal range and it is leading a potential change in price. Sure enough, the VPCI began rising and crossed the signal line on August 8th.
Scan to the very far right and you'll see that the VPCI indicator is turning down again below the signal line. Can a different time frame give us a better idea of what's happening? Let's try a weekly:
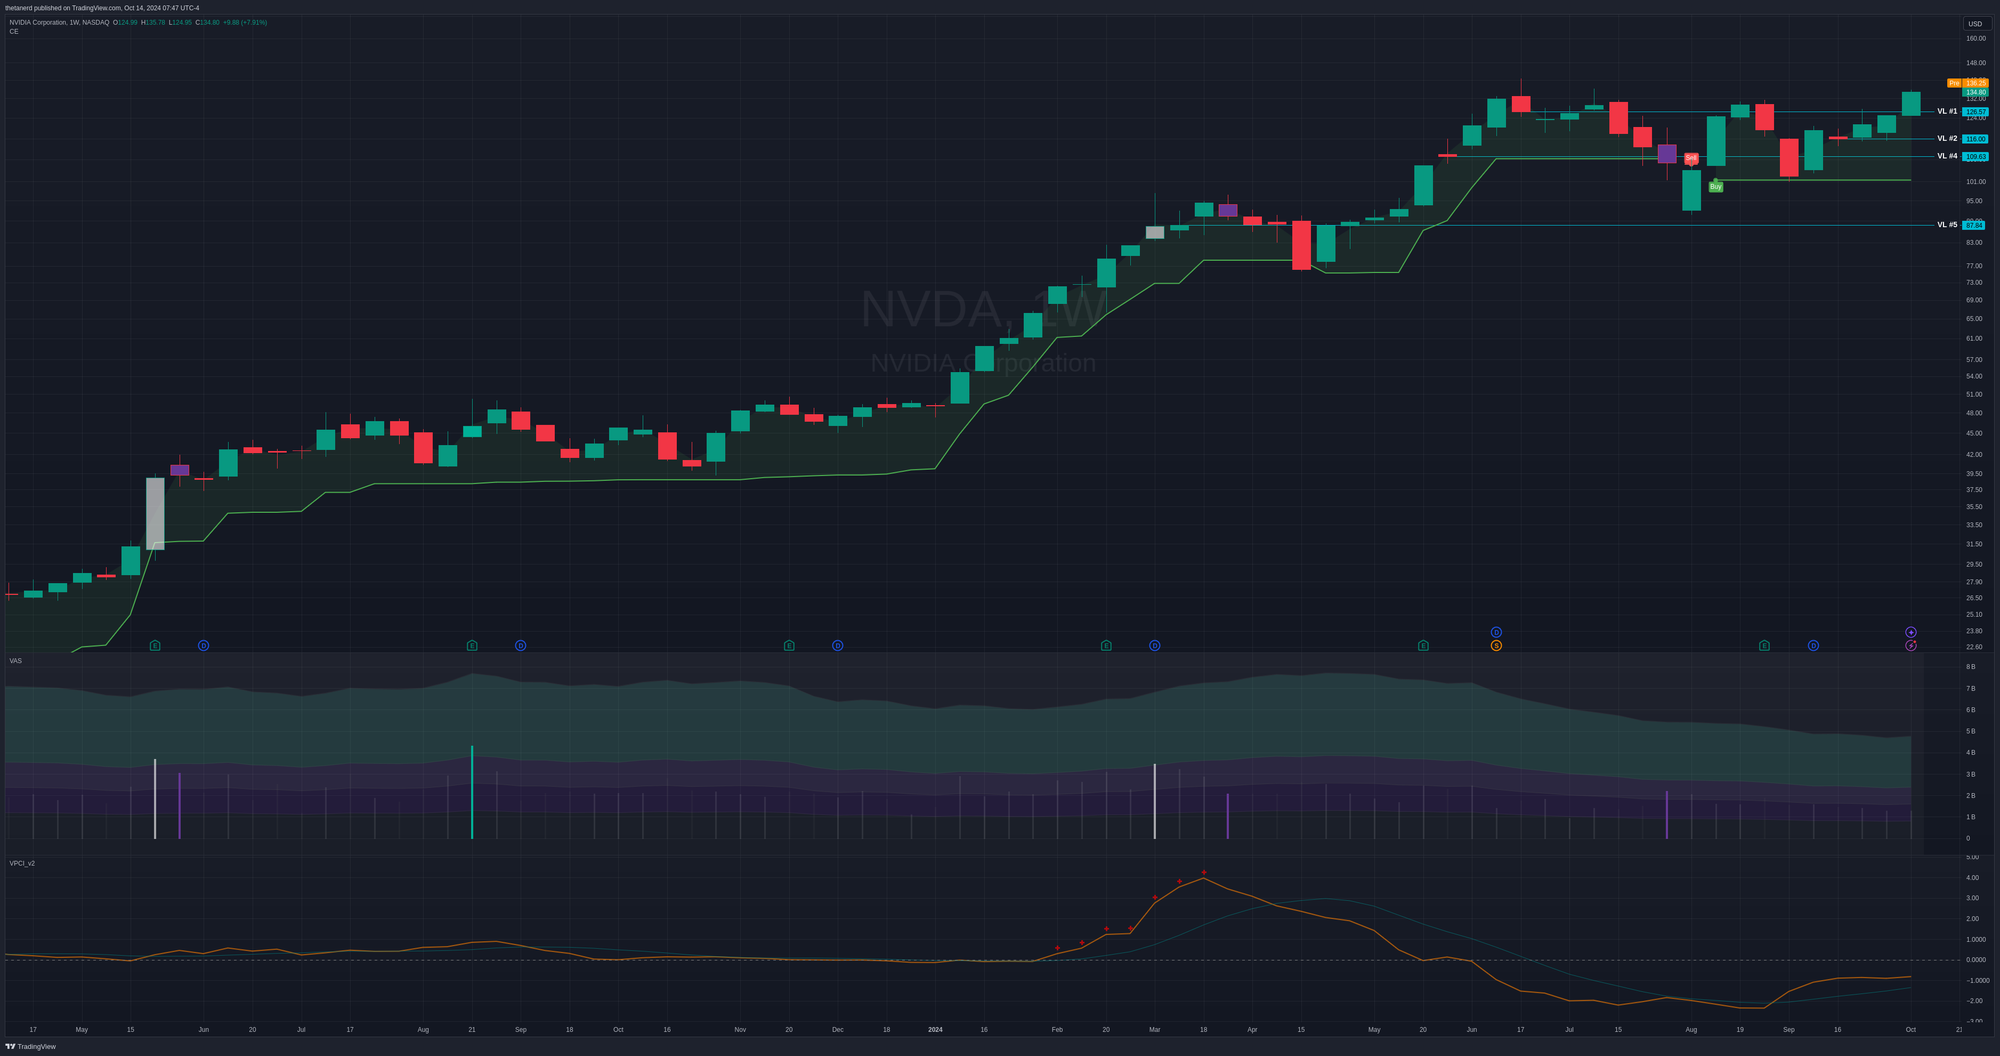
Ah, things are a bit more clear now! The early 2024 rally shows up here much more clearly. As the VPCI rose with the red pluses, hinting that volume was well outside the normal boundaries, we caught a heavy bearish volume week (purple bar) at the end of March.
The VPCI kept falling after that, crossed under the signal line in early April, and crossed back above at the end of August.
How does this look on a monthly?
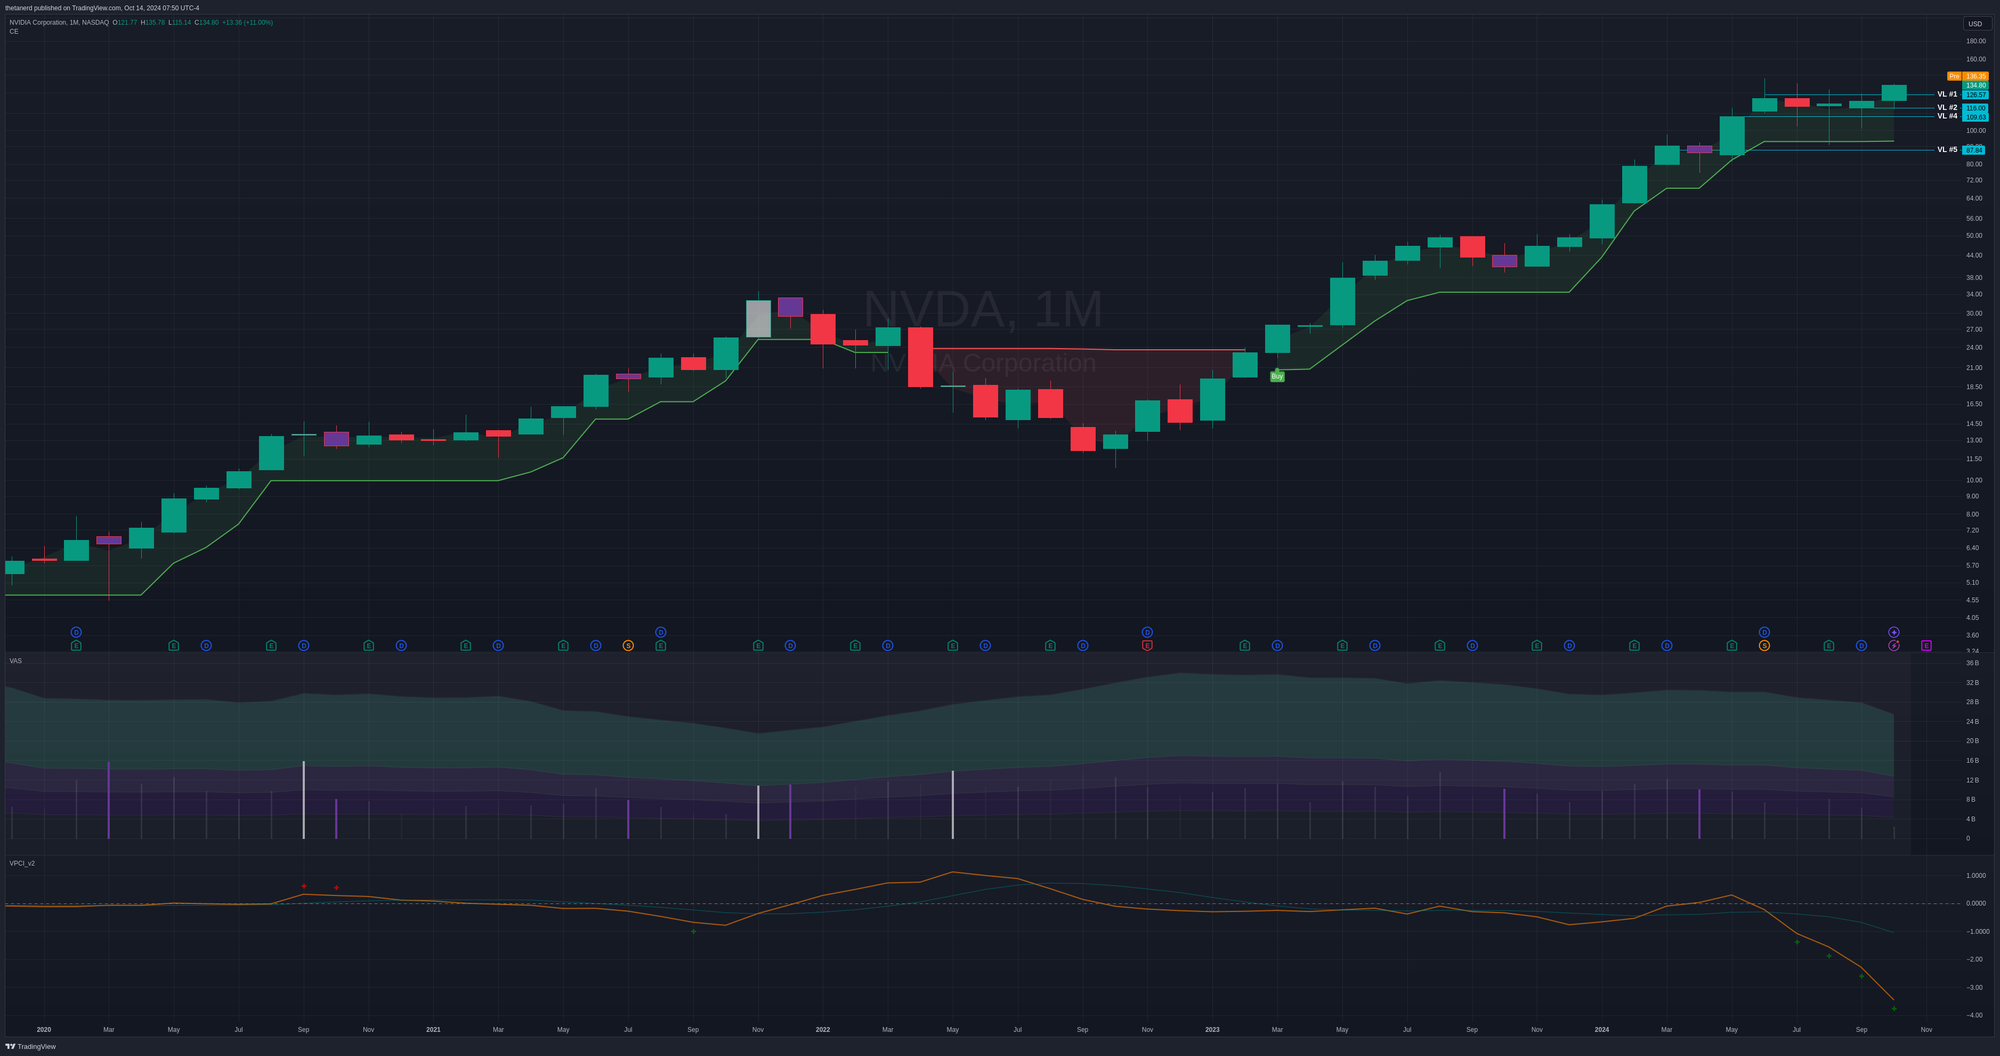
WHOA! Are we headed into a big V-bottom on the VPCI indicator? It's a little too early to tell right now but this is certainly something to watch.
I looked through tons of stocks to find a similar pattern where price was increasing on a monthly chart and then a V-bottom appeared and the only good example I could find was GOOGL in mid-2021:
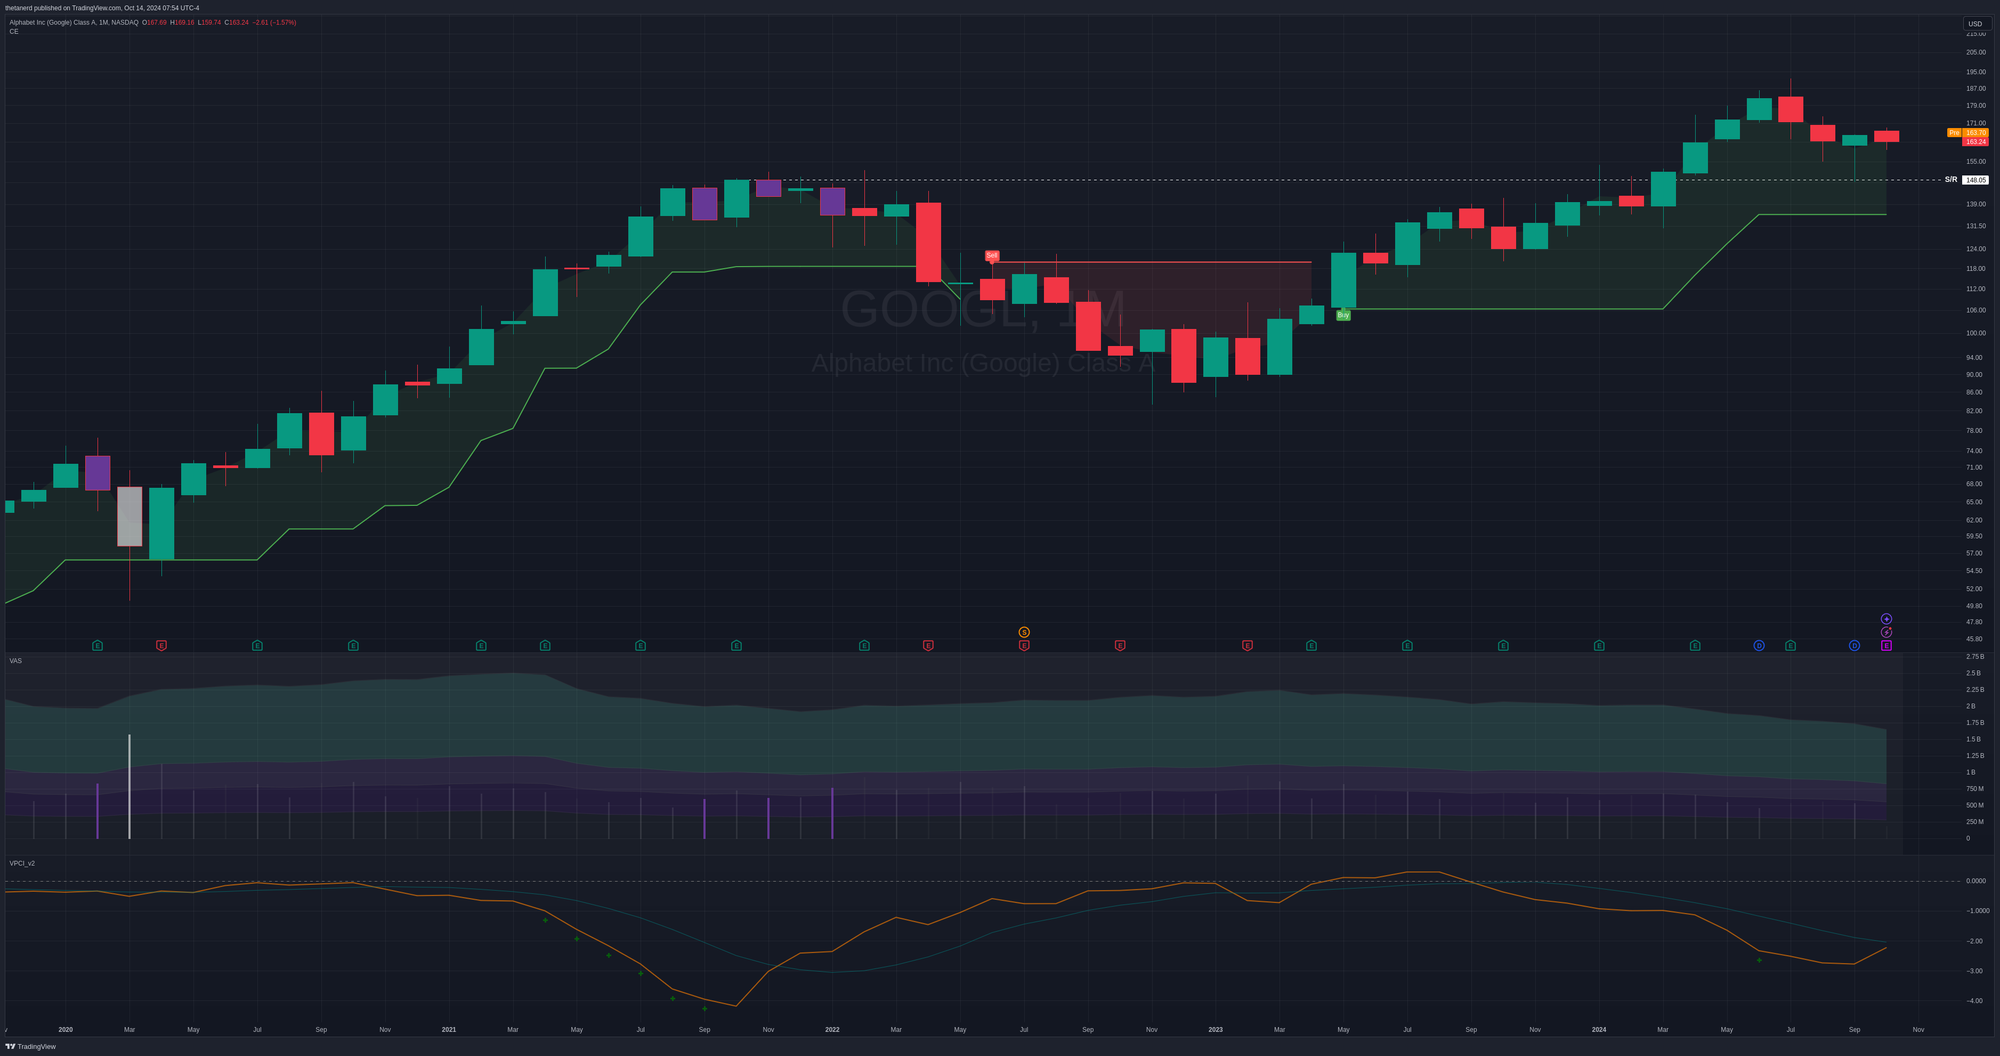
In this case, VPCI started making a V-bottom that turned out to be a bearish move after three big months of bearish volume appeared. GOOGL eventually recovered, but it took quite a while.
So far, NVDA seems like it's consolidating after a series of strong rallies. There's a lot of flux in the world of artificial intellgence right now and that might be showing up here on the chart. Some of the industry changes that come to mind are:
- Large language models (LLMs) are becoming more efficient for training and inference and therefore might require less computational power in the future for the same amount of benefits
- Renting GPUs might be a more common occurrence soon due to the economics involved and as more GPU capacity comes online at cloud providers, it might make more sense to just rent the required capacity
- Competition from AMD and Intel is slowly building
Institutional Trades
I copied the big trades from Volume Leaders that I shared earlier, so this is a bit of a repeat:
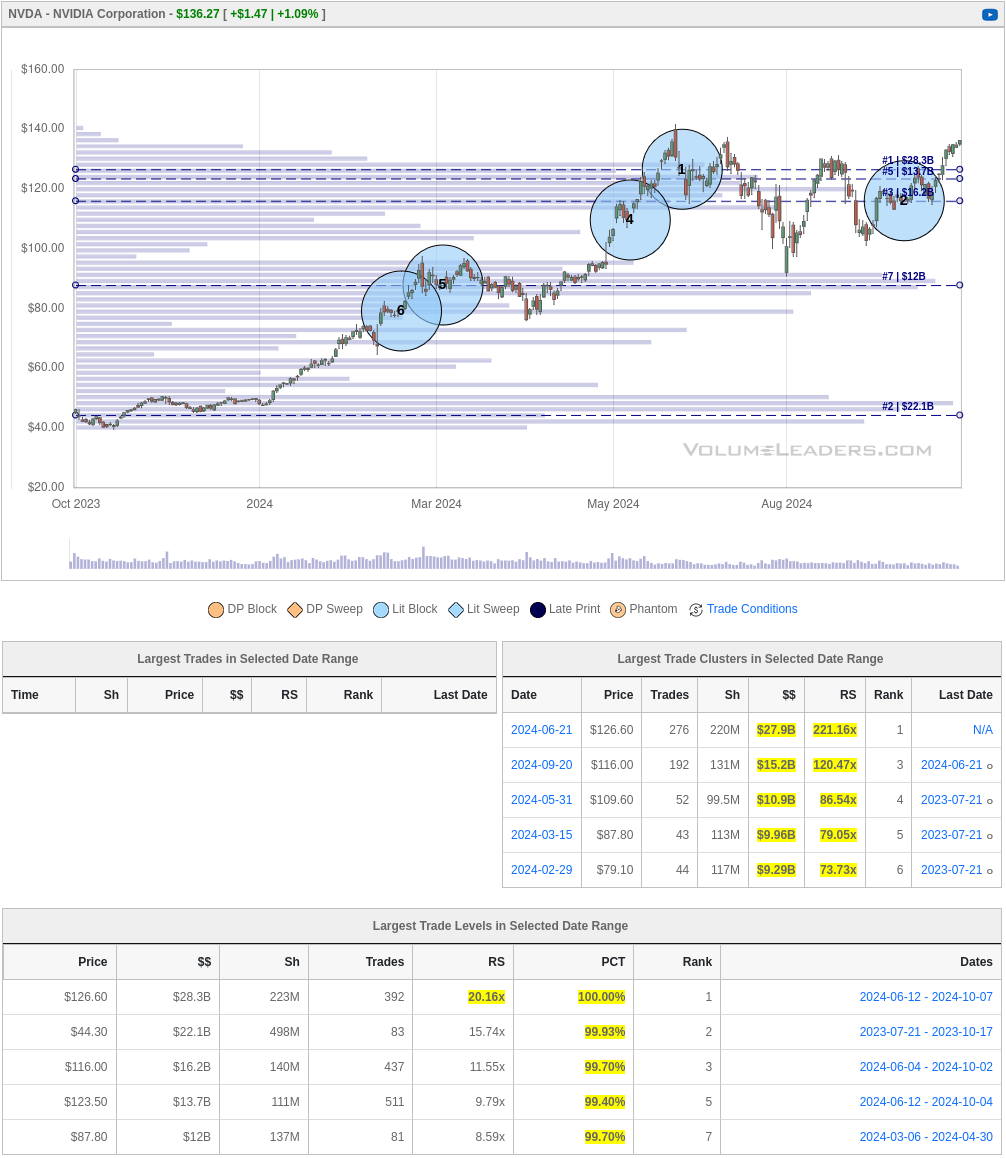
That #1 trade is huge with almost 110M shares of NVDA changing hands at $126.57. Mark this on your charts because it's an important level to watch! 📝
Sentiment
SentimenTrader has some handy optimism charts on their platform that can help you identify trends that might be missing from your stock charts. They examine lots of different criteria, including short interest, options trades, and investor behavior to mark levels of excessive pessimism and optimism:
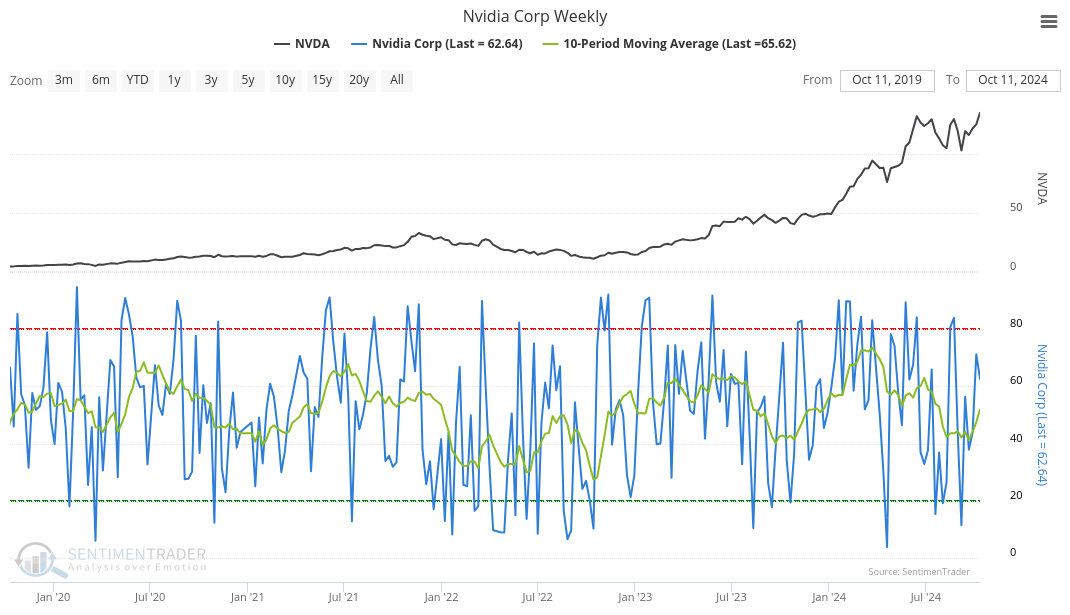
The red line marks high optimism and the green line marks high pessimism. You can backtest these indicators on the platform but I'm a little short on time to do that this morning. 😜 NVDA's optimism is trending upwards again and I'll keep an eye on that.
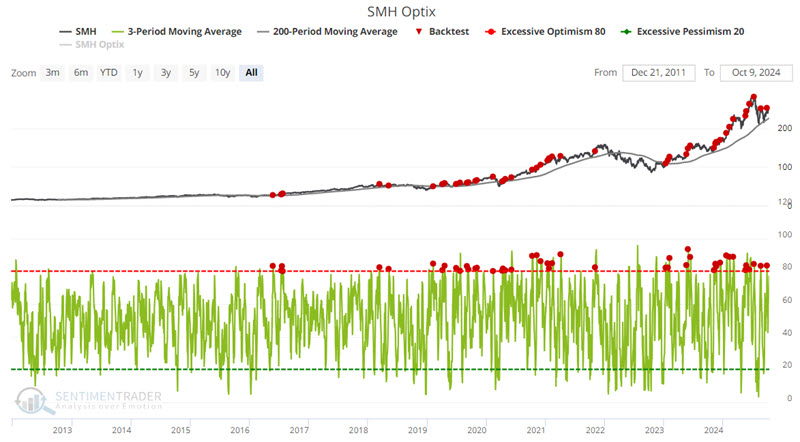
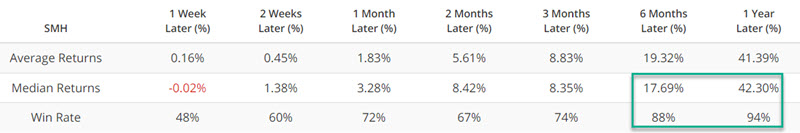
Jay Kaeppel from SentimenTrader had a post up last week (subscription required) where he noticed that SMH (the semiconductor ETF) performed quite well when optimism was high:
The backtest results:
He also mentioned that the seasonality for semiconductors trends bullish more often during November and December.
Thesis
NVDA has been on an incredible run in the last couple of years and they continue to lead the GPU segment. I'm not a fundamental trader, but their cash flow looks great, too. However, there have been a lot of questions lately about AI in general, especially with businesses reporting challenges in getting value quickly from the technology and SMCI sending a lot of mixed signals about their finances.
I sold some $125 puts on NVDA for November 15th. These expire right after earnings and there's some risk inherent in selling those puts. As long as NVDA remains above these large institutional trades, the odds of an upside move seem higher to me.
Good luck this week! 🍀
Discussion