One week out from MSFT earnings
With earnings coming January 30th, where might MSFT be going before then? Let's examine the charts to find out. 🔎

Good morning! 🌄 We're one week out from MSFT's earnings call on January 30th. What is the chart telling us about potential risk to the upside or downside? That's what I'm looking at today!
All investments come with significant risks, including the loss of all capital. Please do your own research before investing, and never risk more than you are willing to lose. I hold no certifications or registrations with any financial entity.
Let's get this Tuesday post underway! 🚀
Performance
MSFT's numbers look great over nearly any time period, especially for a market cap this large:

Price sits near the top of most time frames, but it has pulled back slightly more recently as everything in the market has reached all time highs.
Long term
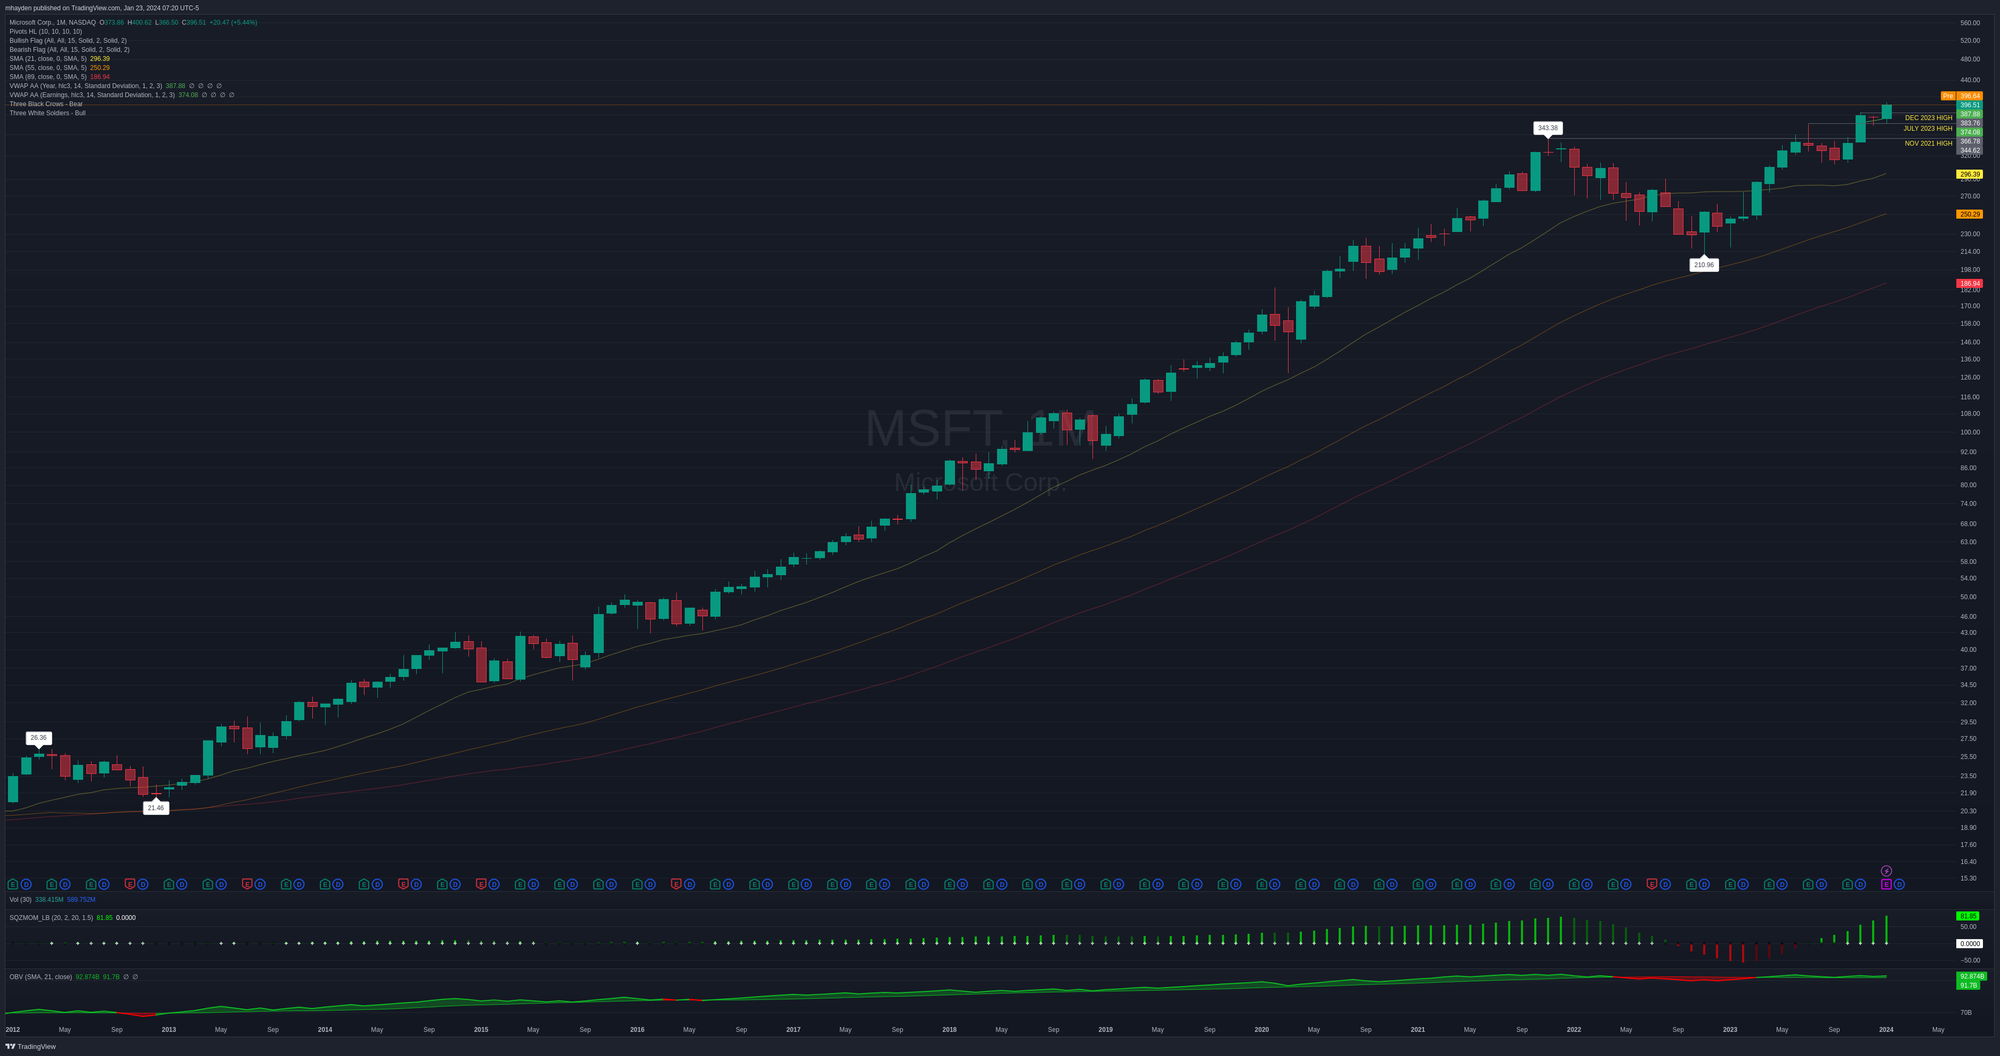
It's always helpful to zoom out and put things in perspective. MSFT has been on a rally since 2012 that continues today. Other than the dip in 2022 with interest rate concerns, it's tough to find an indicator that shows any loss of strength in the price action.

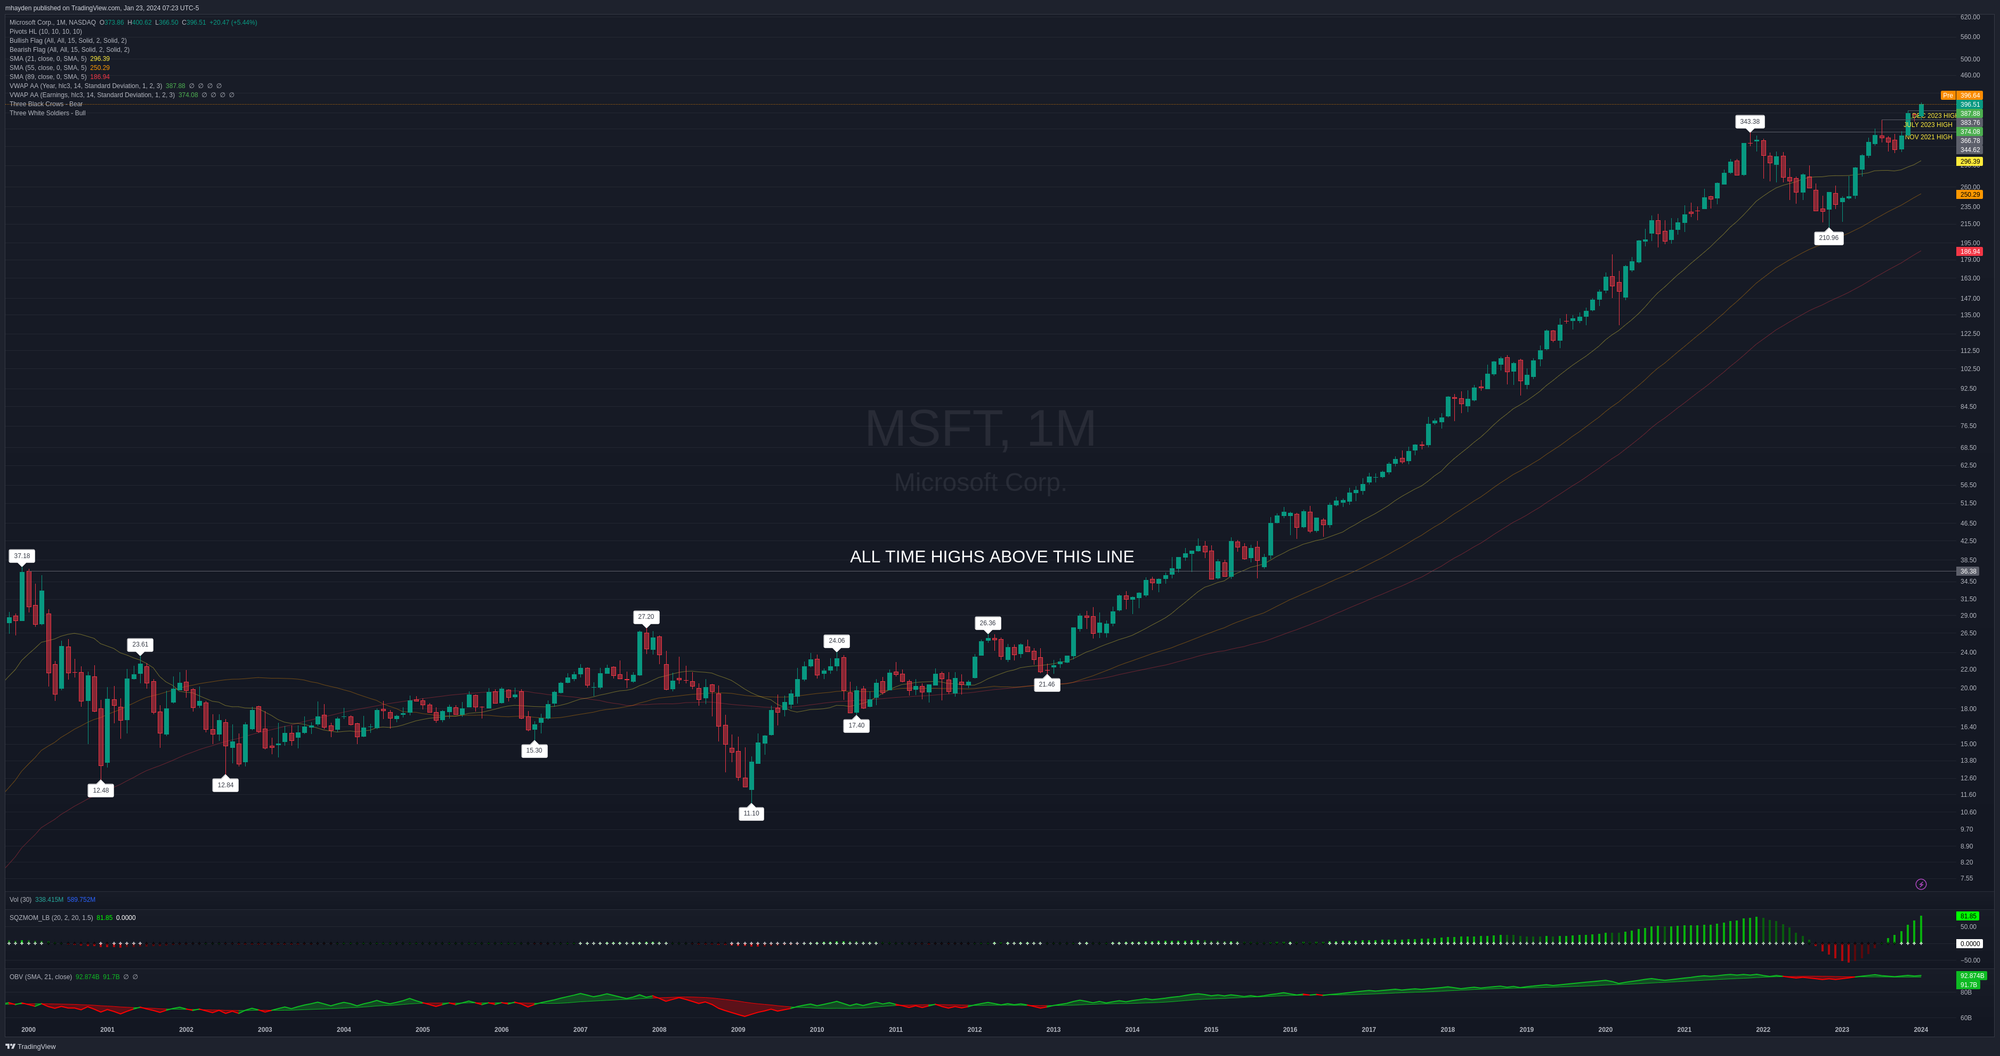
Many people get a bit nervous at times where stocks hit an all time high, but it's important to look back and see what happened in the past. Consider that MSFT hit all time highs back in July 2014 and continued making more all time highs non-stop until November 2021. 🤯

MSFT kept moving higher for seven years straight. Sure, there were small pullbacks and corrections to the trend line many times, but if you zoom out, it has done incredibly well. Keep this in mind as people shout "double top!" or "all time highs again?" on your favorite social media platform.
Will we trade higher, sideways, or downwards now? Nobody really knows, but if I'm calculating my risk here, I see more risk to the upside based on this chart.
Since last earnings
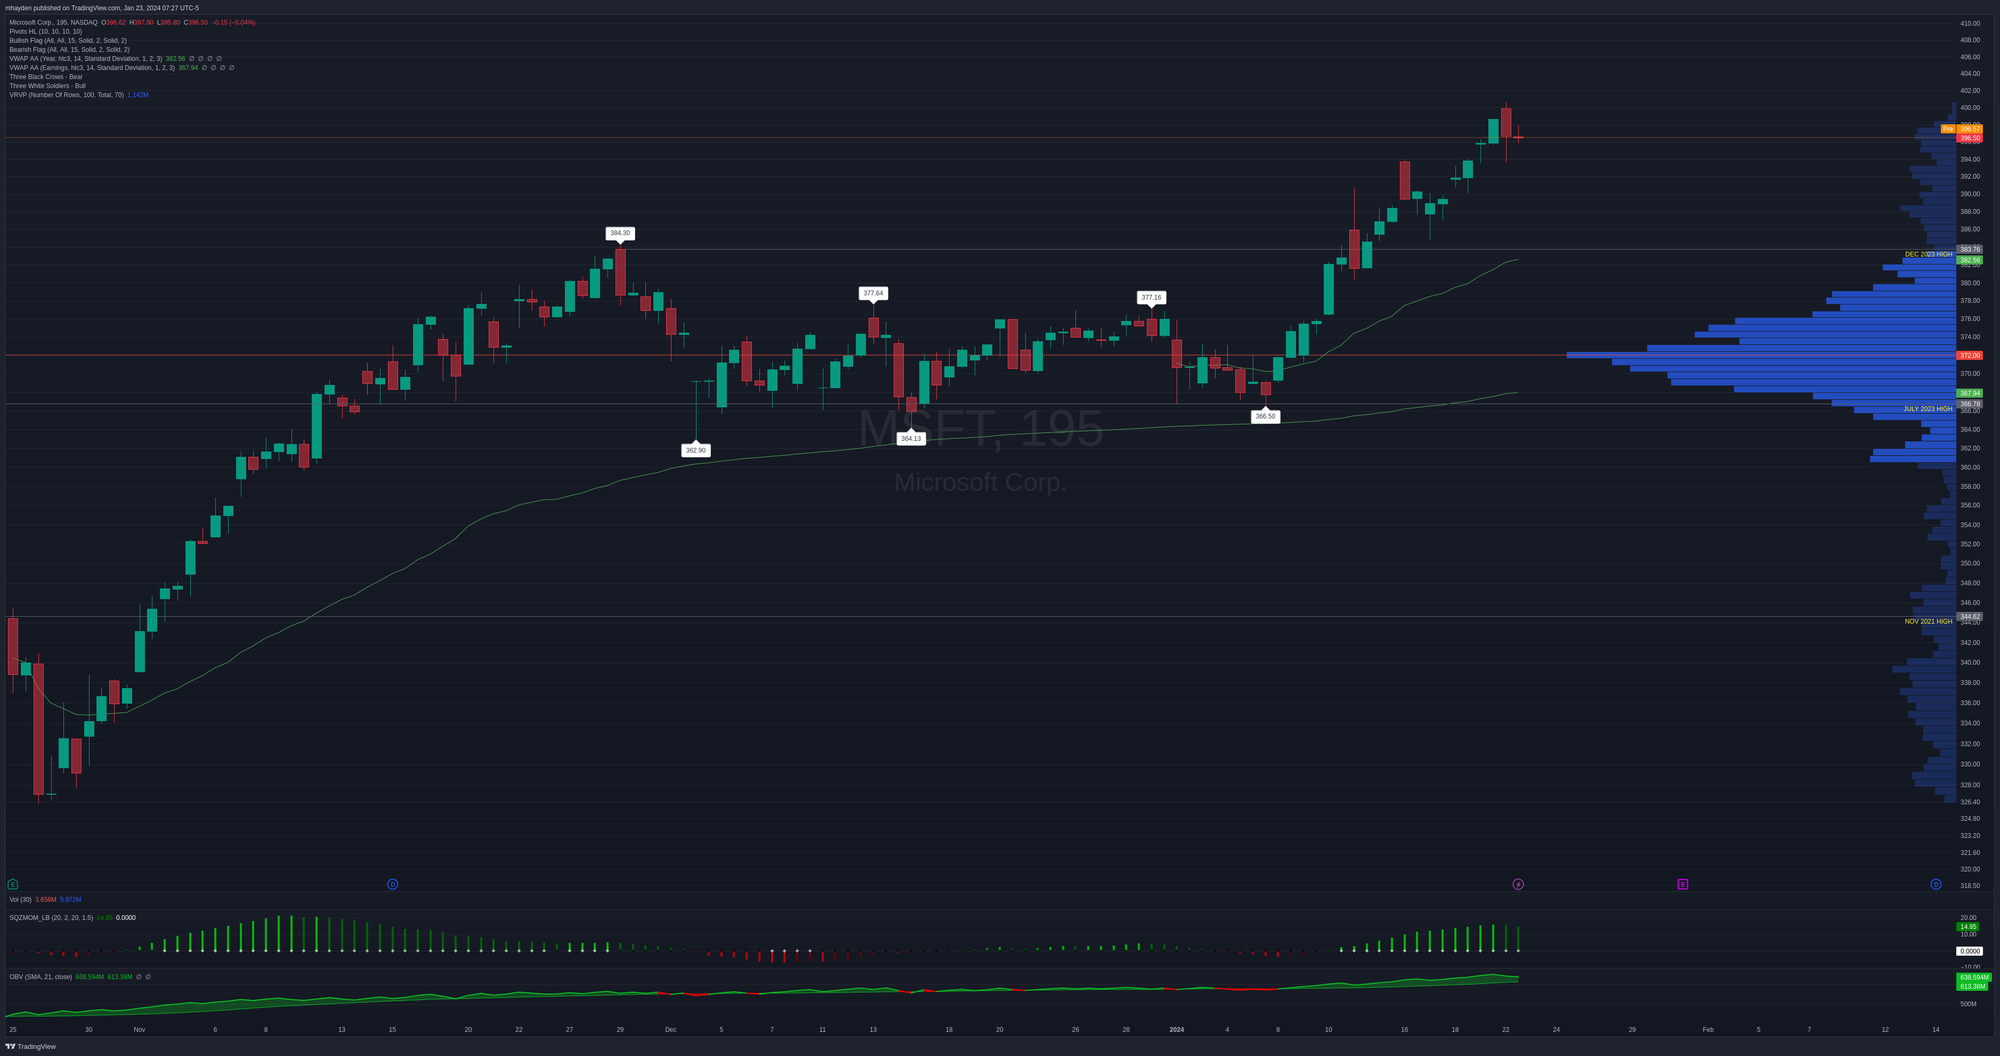
Let's go down to a 195m (two equal bars per day) look at MSFT since the last earnings call on October 25, 2023. What do I notice here:
- MSFT is rising above the VWAP line since last earnings as well as the YTD VWAP.
- Most of the trading volume is centered around $372 with 70% of the volume within the $360-$382 range.
- We lightly rejected off the $400 psychological level recently.
- Volume tends to support the current price moves upwards.
- The TTM Squeeze indicator is showing a little bit of caution from yesterday's price action. Some would use this as a shorting signal but how comfortable would you be shorting MSFT with the current price trajectory? 🤔

If I'm hunting for support levels on MSFT for selling puts, here are a few I'm considering:
- $384: December 2023 high
- $372: Highest volume level from the December consolidation
- $366-$367: Earnings VWAP and July 2023 high
- $360: Low volume zone
Institutional volume
As a reminder, Volume Leaders shows large trades, presumably from trading institutions, but it doesn't show the direction of those trades. These trades highlight price levels where institutions are very interested in making some type of trade.
Perhaps they're starting or adding to a long position. Perhaps they're taking profits or going short. It's impossible to know, but the data of when and where the trade was made can suggest support and resistance zones.
Let's start with a one year look:

There's a lot happening around $320-$340 and $370-$380. Price continues to move higher above these established levels, but institutions aren't making any big moves on it yet. The numbers inside the circles are a size rank of the trade versus all the trades ever made on the ticker. For example, a circle with 8 in it means that it's the #8 biggest trade in MSFT of all time.
One thing I found recently is that you can remove the "closing" trades from these charts. Closing trades are commonly called "market on close" orders and these often show up because of ETF re-balancing at the end of a trading day. If we remove those market on close orders, we see a slightly different picture:

There's a large dark pool trade coinciding with #10 at the top right around $370.
If we look only at dark pool trades, there are a ton made at $370. There are three trades of 2.6M shares each and a late print with 1.75M shares traded. Late prints are dark pool trades that aren't reported immediately to the market.

We can also examine the trades since the last earnings call:

There is something special about the zone around $370. It has attracted quite a bit of institutional attention. I see this pattern often where price consolidates and institutions try to build the biggest position possible as quietly as possible. Then price begins to move and they take some profit as it moves higher. Yesterday seems to be one of those profit taking days.
Thesis
Let's wrap this up:
- MSFT ticks all the bullish boxes on the chart with only one indicator hinting at weakness.
- Institutions likely built a substantial position around $370 and might be taking the first of their profits now.
- MSFT made all time highs for years before hitting a wall with interest rates in 2021.
Yes, it is nerve wracking to put money into something at all time highs, but that's what I'm doing lately. I'm reminded of a quote from Tom Hougaard's book:

I'm currently shorting two $370 puts on MSFT expiring March 15th. They wavered a bit yesterday, but they're still in the green. These offer a return on risk of about 1.35% and they were 0.21 delta when I sold them. I'll take profits when they reach 50% profit or I'll roll them up before then to capture some additional premium.
Good luck to everyone this week! 🍀


Discussion