Pre-CPI SPY analysis for September 13

CPI data shows up an in hour, but let's see where big money has put their bets so far. I'll dig into SPY's data today. 🎢

Good morning! 🌄
Today's the day when we get some important data on how inflation is going here in the USA. The Consumer Price Index (CPI) data drops at 8:30AM Eastern:
Keep in mind that this is only one way of measuring where we are with inflation. There are still serious problems affecting Americans and their families including rising debt, increasing delinquencies, and stubborn food prices. Fuel costs are starting a climb as well.
Kyla Scanlon publishes on this topic, the vibesession (a play on "recession vibes"), that describes how inflation affects people directly. I highly recommend her writing and videos!
I'll take a look at SPY today to see where bets are stacking up, but bear in mind that if the CPI results surprise analysts, we could see some abrupt moves that throw out all the predictions. 😉
All investments come with significant risks, including the loss of all capital. Please do your own research before investing, and never risk more than you are willing to lose. I hold no certifications or registrations with any financial entity.
Let's go! 🚀
Options flow
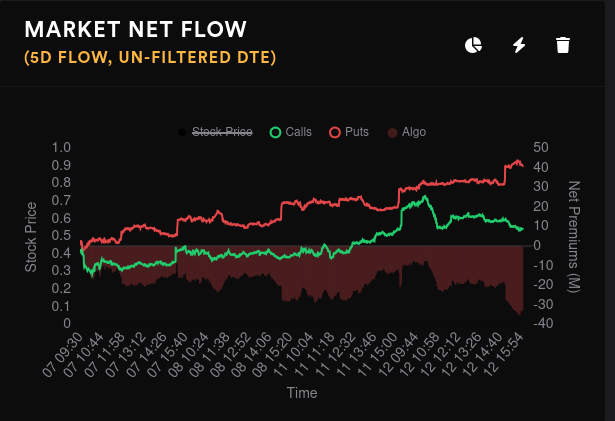
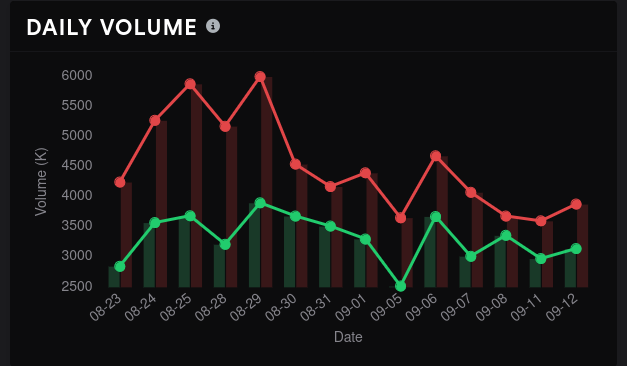
The overall market saw calls selling off yesterday. For the last five days, put premiums have crept up and that made hedging a bit more expensive. SPY's implied volatility rank (IV rank) remains quite low at just over 11% and it has increased since August 31.
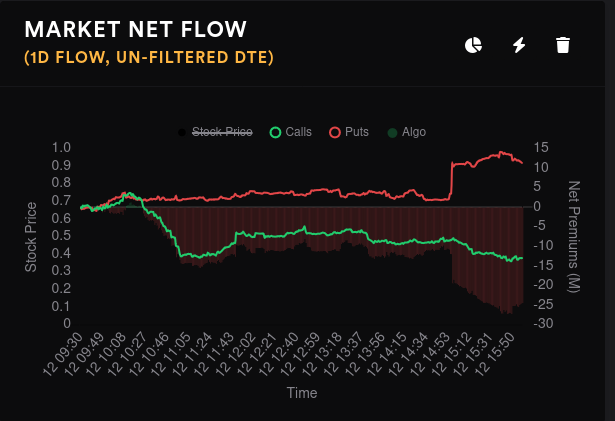
The sold off calls could be traders closing their long call positions or it could be new short call positions. SPY's IV is slightly elevated, so the short calls could be a short-term premium grab with CPI data coming out today.
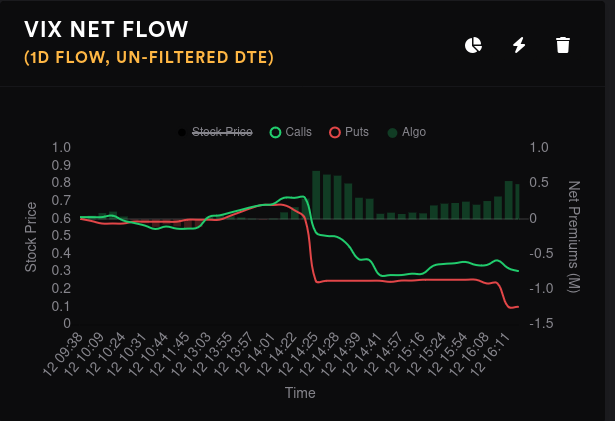
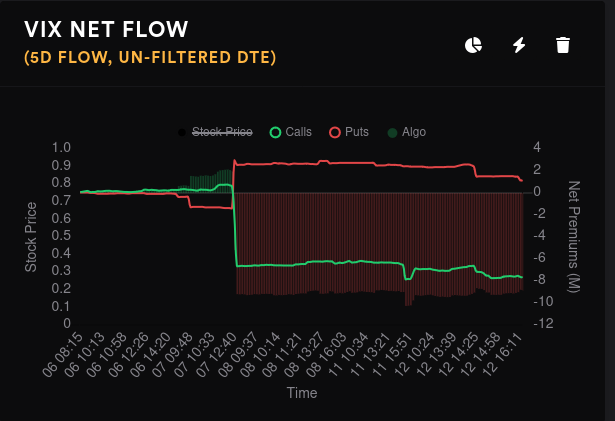
The VIX options flow isn't surprising here. Bearish bets for the VIX showed up on the 8th and haven't moved much since then. It's a fairly safe bet to assume that IV will come down slightly after the CPI data is released. However, if the number is a surprise, we could be in for increased volatility at least for a short while.
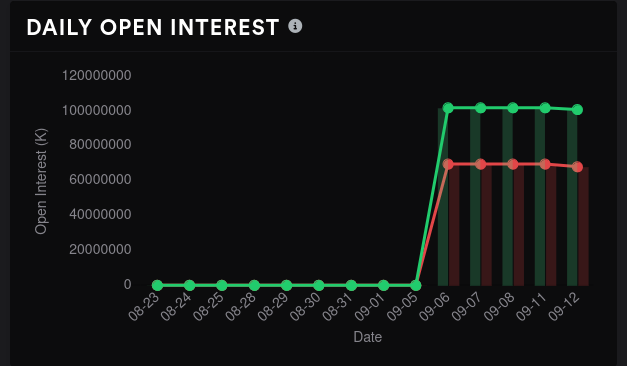
SPY's options volume is down from the end of August, but it ticked up slightly yesterday. Open interest increased, but I think Tradytics might have an issue with their OI chart right now. 🙃
If we look at dealer open interest, which is backwards from customer positioning, we see some trends. We look fairly bearish until we reach 10/20 and that expiration looks the most bullish out of all. 11/17 also looks bullish, but the bearishness comes back at the end of the year.

Vanna
Volland has a lot more data for SPX than Tradytics, so I'm switching to look at vanna for SPX. Just divide these numbers by 10 to approximate where SPY will be.
Aggregate vanna for SPX shows some positive vanna just in front of us with some negative vanna just past that. 4500 looks like a definite possibility if IV were to contract, but we don't get much help past that. There's a range of negative vanna from 4510 to 4620.
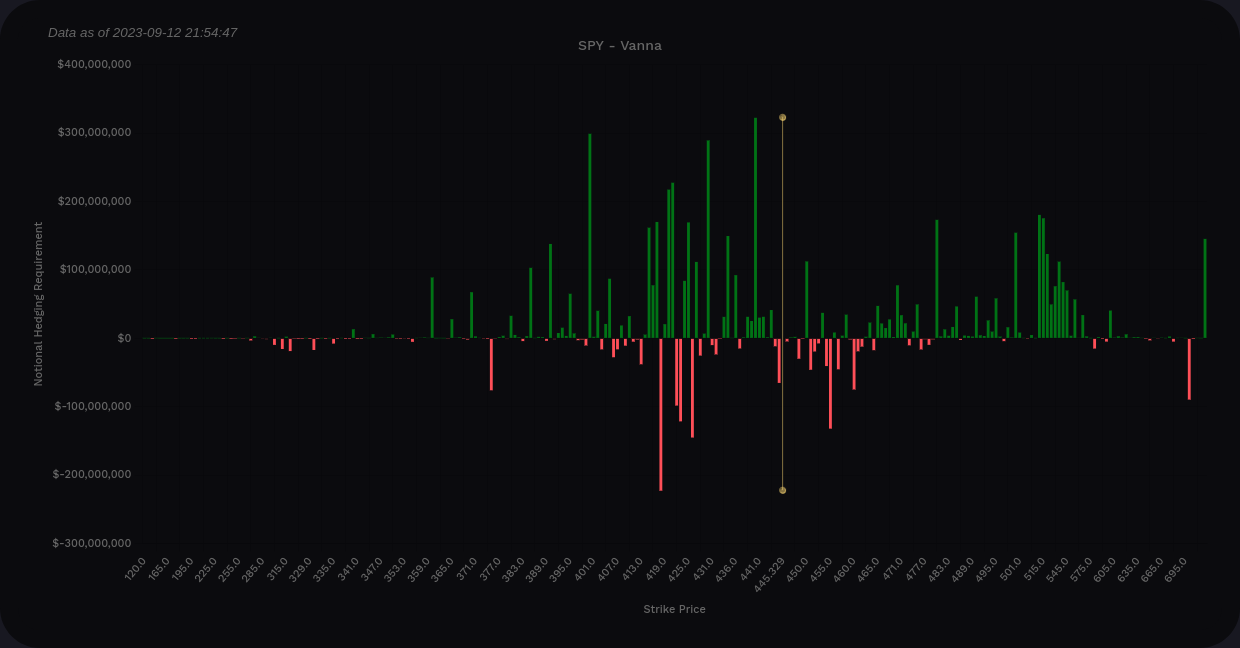
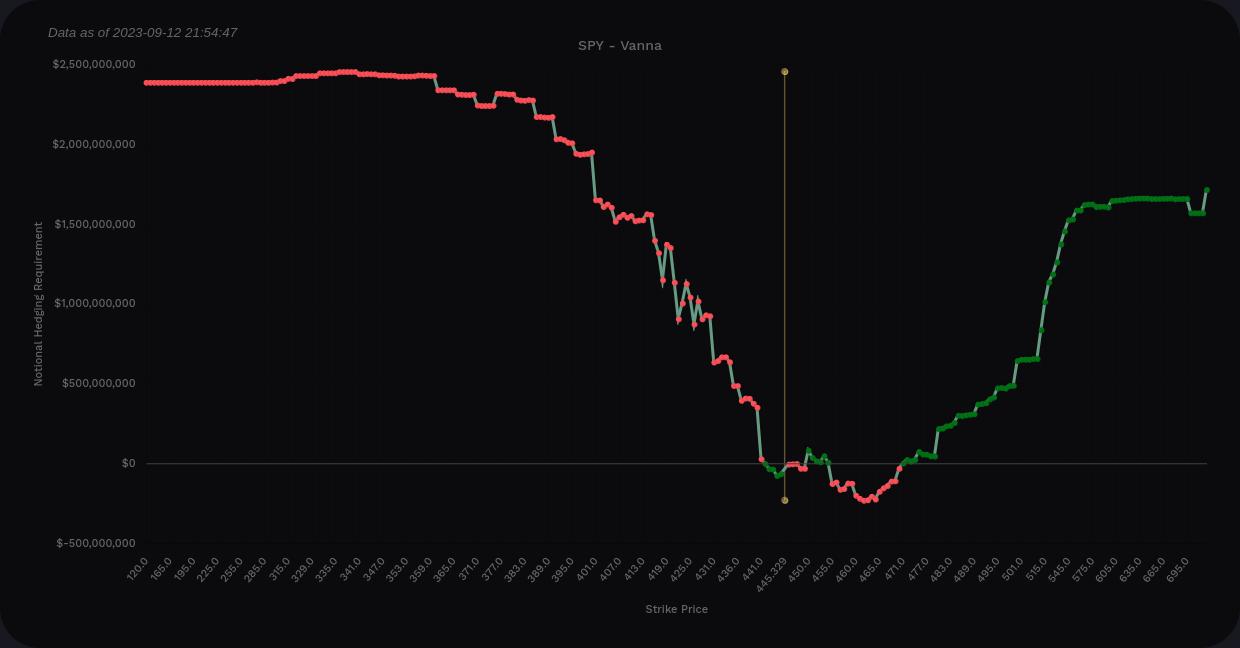
If we look at now through 9/15 only, an approach to 4500 looks possible, but upward moves past that look doubtful. Positive vanna outweighs negative vanna by a 2x margin. This implies that we get upward price movement if IV were to contract, but I'd really like to see some positive vanna over 4500 to believe in that.

Expanding our look through 10/20, vanna remains positive but it's now positive by almost 15-20x. That's quite a lean. 4500 still shows up as a potential target for price moves as IV contracts, but there's not enough positive gamma above price for a higher run right now. 4600 definitely looks like a zone that will fight upwards price movement.

Not much changes by looking out to 11/17. In short, vanna suggests SPX is caught between 4400 and 4500 in the shorter term. 4600 definitely seems like the end of the line right now.
Gamma exposure
Let's see if GEX can highlight some of these levels we found on the vanna charts. As of this morning, price is sitting around $445. The obvious magnet for price on the aggregate GEX chart is $440 and that's the biggest level on most of the vanna charts from earlier as well.
GEX also suggests that $450-$455 is a big resistance zone. There's almost no negative GEX levels past there to fuel a rally, either.
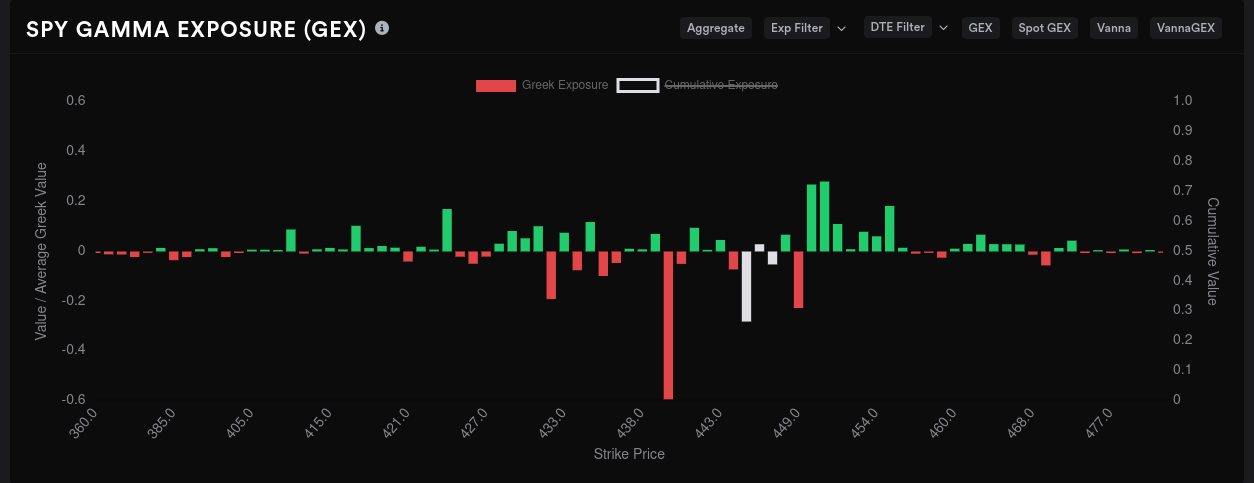
Isolating the 9/15 data paints $440 and $445 as targets, but SPY has some room to run here from about $432 to $451. There's resistance between those levels, but not much. $450-$455 resistance is back again.

10/20 is the third biggest GEX expiration after 9/13 and 9/15, so let's take a look. We have a $440 price target with $450 and $455 as big resistance levels. However, there's a lot more negative gamma above $450 than we saw in previous expiration dates. Downside support gets heaviest around $424.
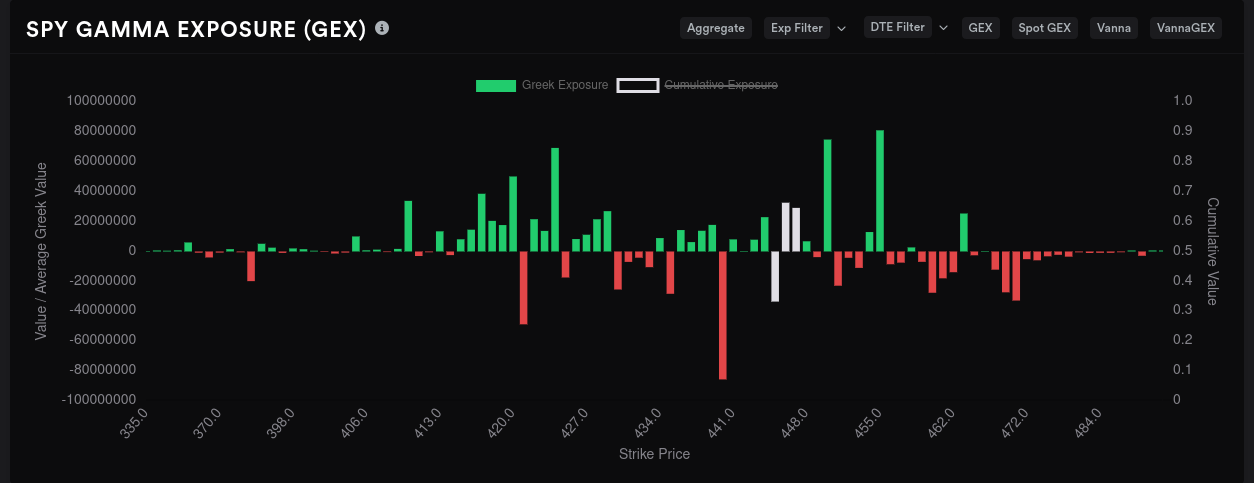
$440 is a special level across multiple expirations and it we're hemmed in between $450 on the top side and $420-$430 on the bottom end.
Whale traders are very bullish on $440 in the short term but big money has bet very bearish on $420 for 10/20. Data past 10/20 looks much too messy to make any decisions. Here's the 10/20 chart:

57.5M in net deltas going bearish for 10/20 seems like a lot. It could be a hedge for shorts or something else, but it's worth watching.
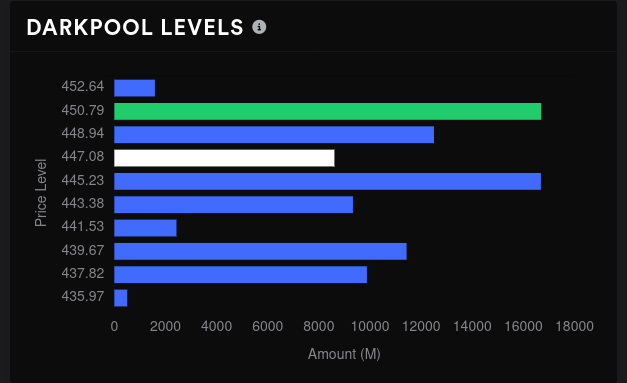
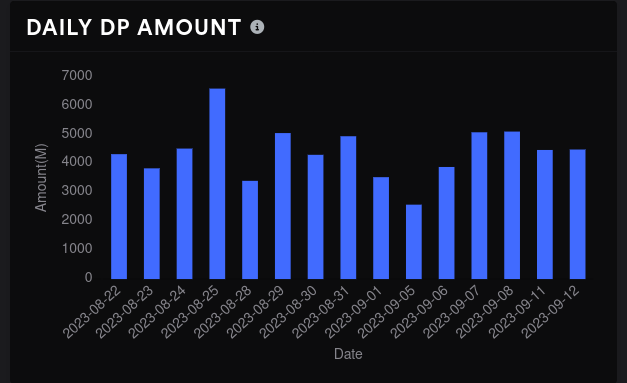
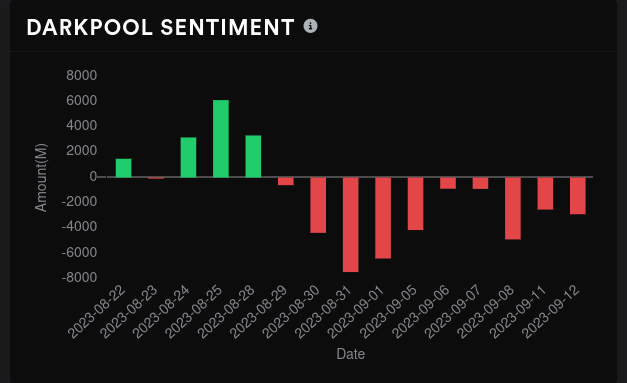
Dark pools
SPY has seen some decently-sized delayed dark pool trades lately, especially in the $440's. This is a bullish sign for SPY, but let's check some other data to be sure.
Sentiment is bearish, but just barely. Volume held steady for the last five days but bears and bulls have traded wins over those days. The biggest level remains around $450 with another level around $445. This aligns with the GEX and Vanna charts we already examined.
We have a volume gap around $441. If we fall through the lower $440's, we might pick up support in the upper $430's.
Thesis
First off, CPI data comes out in about an hour and it could invalidate all of these assumptions. 😉
$440-$450 seems like a good range to trade, at least through 10/20. Although most of the data looks relatively bullish for 10/20, there's not much evidence of a climb past $450. I'm still holding onto a long December $465 put that keeps flipping back and forth between profit and loss.
I'll wait for the CPI data (and the market's reaction) before making any trades on SPY in the short term. I'm also sitting on some AMD/TSLA short covered strangles that should look a bit better if we see an IV drop today.
Good luck to everyone! 🍀
Discussion