Quick market look for July 3rd

We have a short week due to the July 4th holiday, but let's see where TSLA and AMD might be going. 🇺🇸

The market closes early today in preparation for the Independence Day holiday in the United States tomorrow. Be sure to make your trades by 1PM Eastern time! 🇺🇸
Last week, I spotted some bullish setups for both TSLA and AMD. TSLA had the stronger foundation but both looked fairly good. Vanna returns this week, too. But first:
All investments come with significant risks, including the loss of all capital. Please do your own research before investing, and never risk more than you are willing to lose. I hold no certifications or registrations with any financial entity.
What does this (short) week have in store for us?
TSLA
We still have a great looking vanna curve here with the best possible setup for bullish trades:

Drilling into specific strikes, the $300 looms largest at $1.2B while the $260 dipped below $1B. The big $250 strike also shrank to just over $500B:

TSLA is famous for earnings run-ups and it looks like many traders are betting on another one. One word of caution, though – dealers are sitting on more and more bullish contracts lately:

This implies that market participants are buying up long puts or selling calls at a decent rate. TSLA backtests amazingly well if you buy when this chart is red and sell when it's green. However, past performance does not guarantee future returns.
AMD
That $70 LEAPS trade on AMD still has me head scratching a bit, but the overall vanna curve excluding $70 looks quite good:

We would likely have a vanna curve similar to TSLA if the $70 level came down a bit, but it has held steady for weeks. As for individual strikes, $145 comes in as the biggest bar around $117M (I'm excluding that big $70 bar):

One difference here for AMD is that dealers went long a few weeks ago and not much has changed since on the 15 day momentum:

Big options trades seem to favor bullishness at $110, $115, and $120:

There is definitely some mixed data here for AMD.
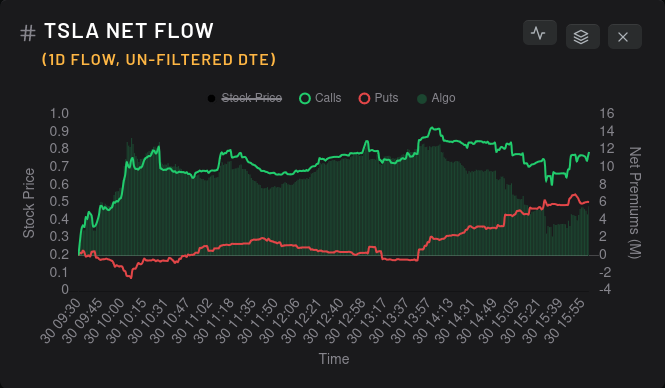
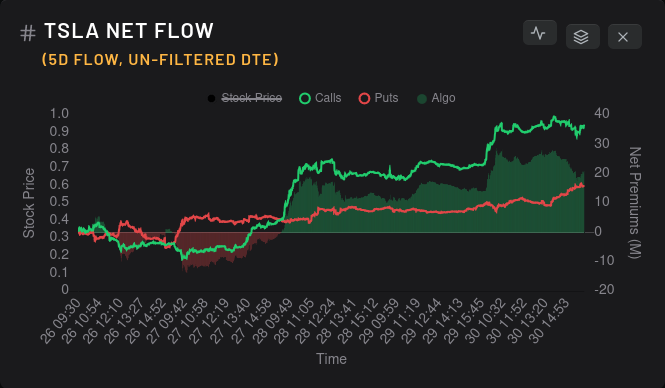
Options flow
Both TSLA and AMD had decently bullish options flow last week:
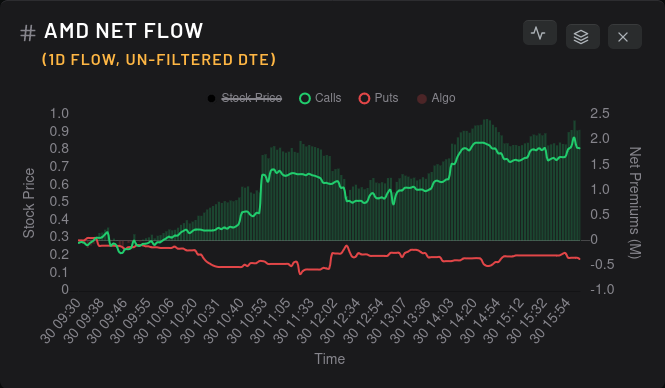
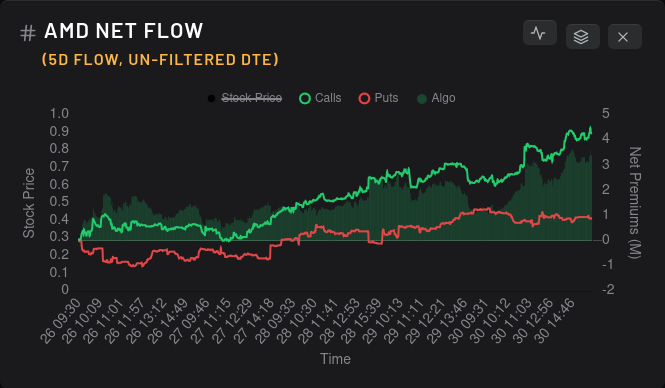
AMD still needs to dig out of the trench from June 20th but it's beginning to do so now. What about the VIX?
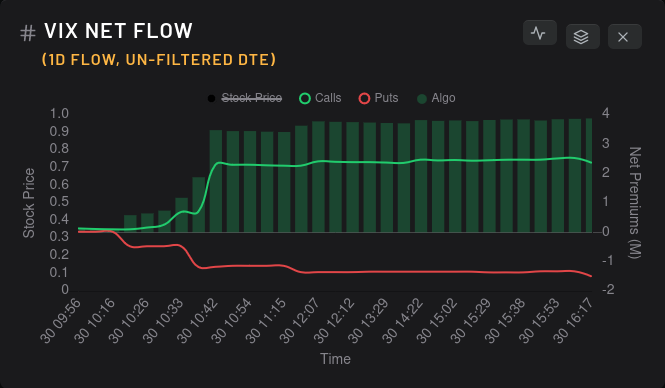
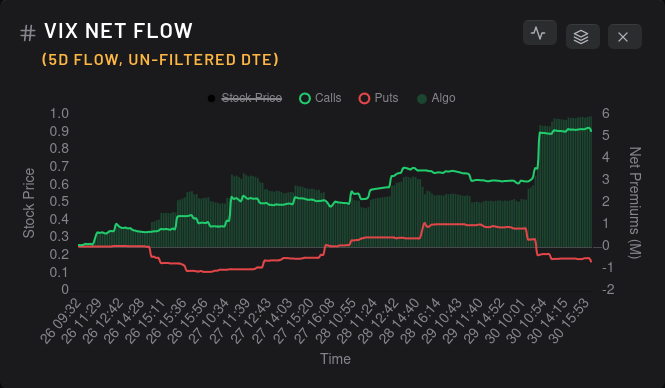
VIX flows are still bullish and that's not good news for vanna setups on TSLA or AMD. VIX contracts usually have longer timeframes attached to them, so this may not have much effect on short term moves. However, it's something worth watching.
Thesis
Although TSLA's data looks stronger for a bullish move than AMD's, both stocks have some mixed data. Some might argue that perhaps we've found some support from the recent corrections/pullbacks, but the VIX options flow has me scratching my head a bit.
We saw lots of moves in the market last month that hedges were disappearing and it could be that market participants are adding some hedges back in now. Either way, options flow looks bullish on most of the companies I can find.
TSLA earnings are coming in 7/19 and AMD publishes their data later in August. Be cautious trading that monthly 7/21 expiration in TSLA since you will likely get theta crush on long options and could be vulnerable to big price swings with short options.
As for my trades, TSLA is definitely difficult to read. I sold a $277.50 call last week that expires 7/7 and it's already ITM this morning. This stock is wildly unpredictable. I'm still bullish on it until we crack $280. We start stacking up a lot of negative vanna then and the curve breaks down unless market participants make bets past $300.
On AMD, I'm still eyeing that $130 level as a liquidity problem in the short term. Earnings or news could definitely change that paradigm. I have plenty of long shares and I sold some calls for 7/21 in the $124-$127 range. I'll continue to sell covered calls with a cost basis near $130 unless I see a change.
As always, you can track my trades over on Theta Gang. I track all of them there – the winners and the losers. Good luck in this short trading week! 🍀
All investments come with significant risks, including the loss of all capital. Please do your own research before investing, and never risk more than you are willing to lose. I hold no certifications or registrations with any financial entity.
Discussion