Quick SPY analysis for 10/3
SPY is stuck in a downward trend, but 10/20 looks bright for bullish traders.

Howdy everyone! Some technology problems set me back this morning and this will be a quick look at SPY as we start the first Tuesday in October. 🍂
All investments come with significant risks, including the loss of all capital. Please do your own research before investing, and never risk more than you are willing to lose. I hold no certifications or registrations with any financial entity.
Let's go!
Options flow
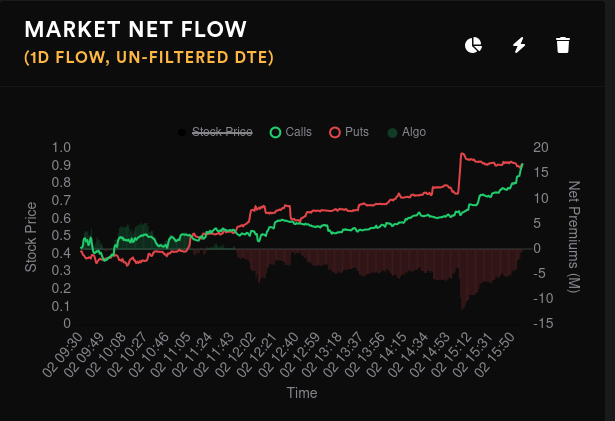
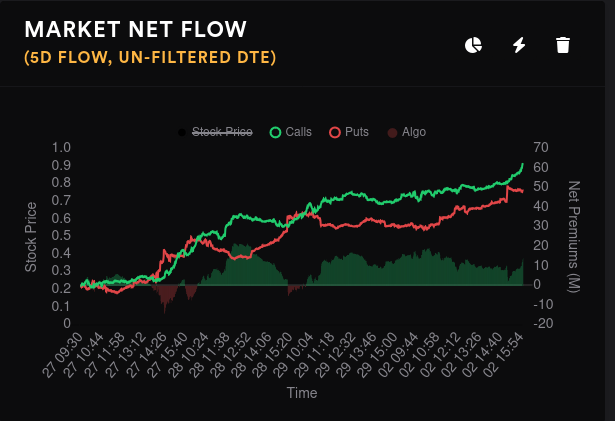
Bulls and bears have been neck and neck yesterday and over the past five days. Nobody looks like a clear winner quite yet, but everyone is stacking their bets.
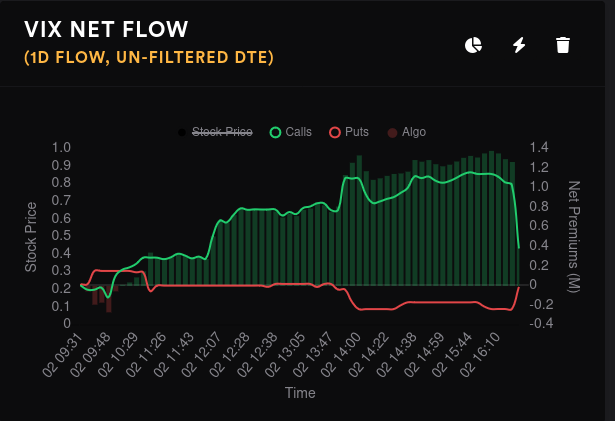
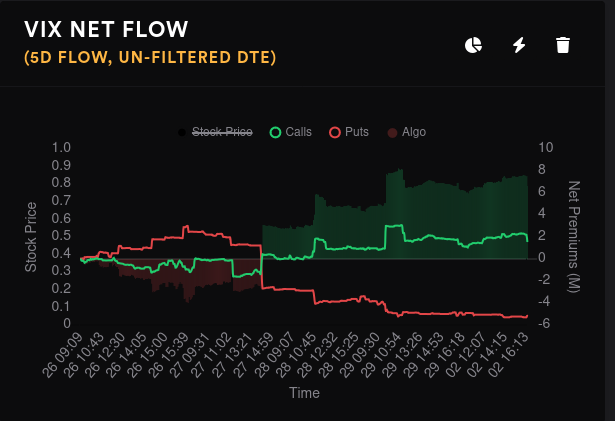
Bets on the VIX have been mostly bullish (betting on more volatility), but not by much. Those bets took a dip yesterday afternoon just before the bell.
Vanna
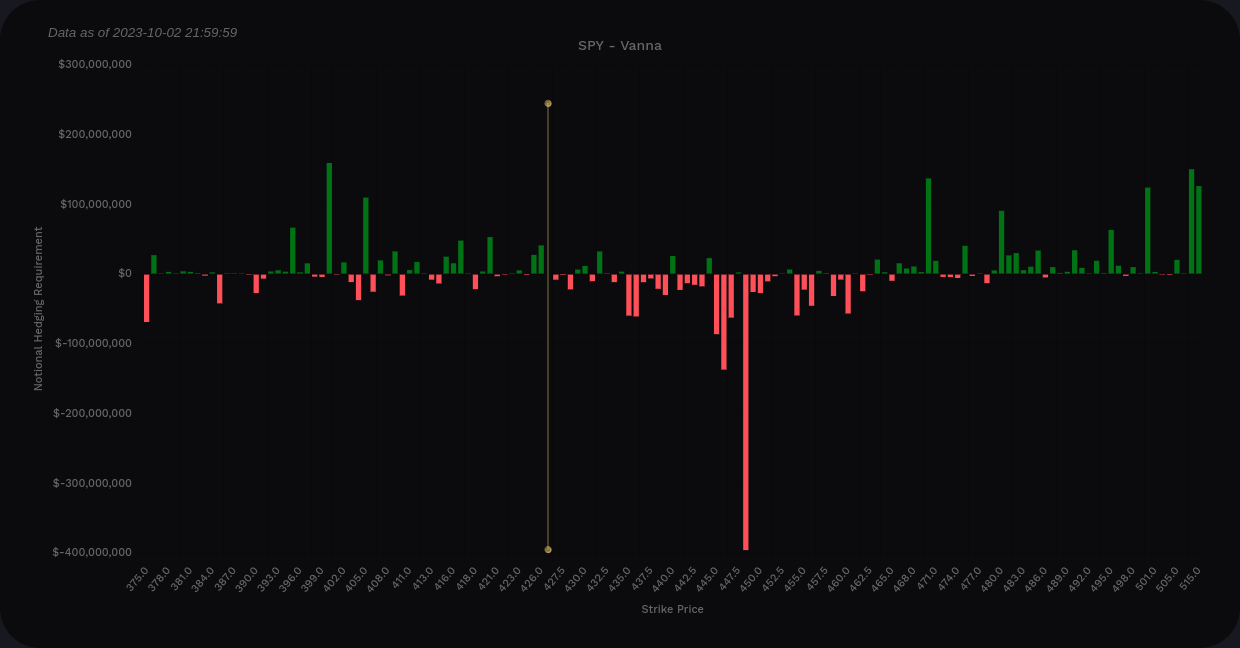
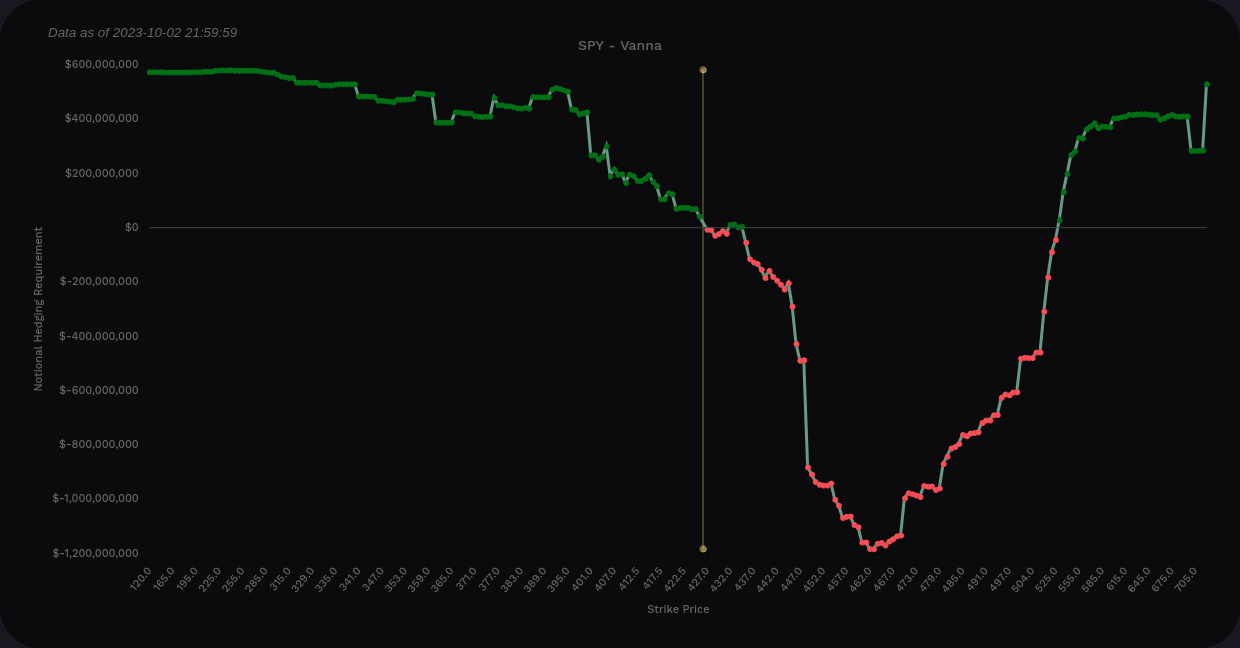
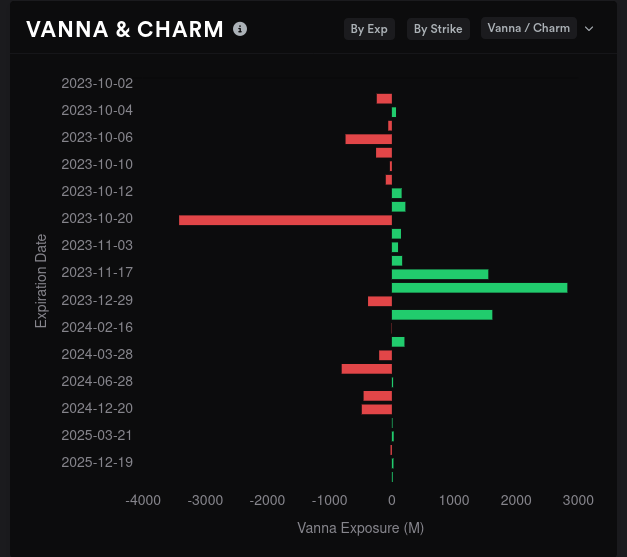
SPY's aggregate vanna continues to dip deeper and deeper ahead of price, which is a bearish sign. However, SPY's vanna remains positive on aggregate if you examine the extremes. $448 looks like a definite limit on the top side. If we start moving down, our biggest levels are at $405 and $400.
Positive vanna with increasing IV is a recipe for bullish price pressure.
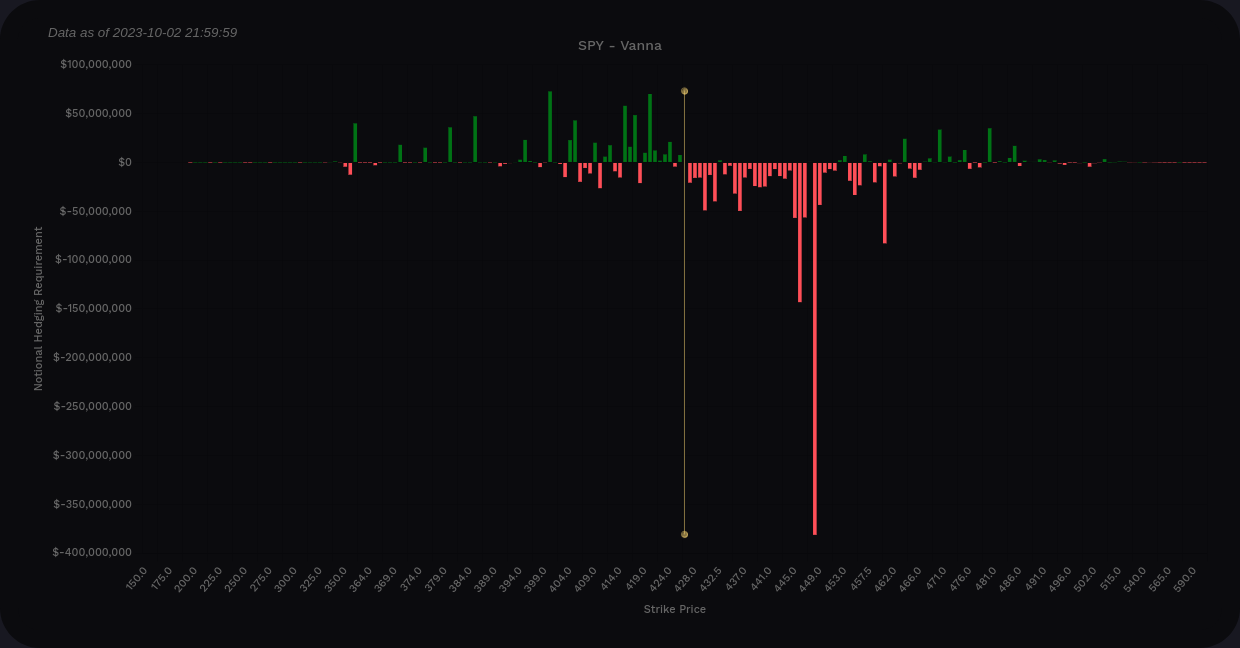
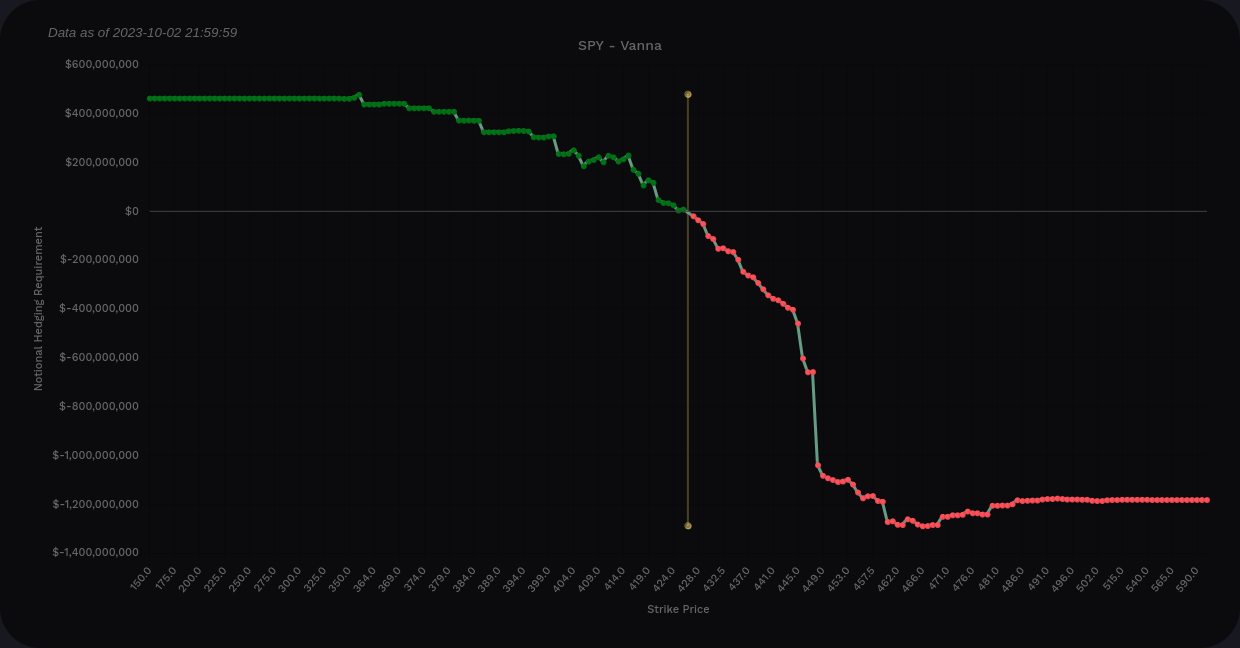
However, here's a look at SPY vanna solely through 10/20. Ouch. This doesn't bode well for bullish price moves.
Gamma exposure
SPY's overall GEX has targets at $421 and $425 with some steep resistance at $424.

The 10/20 expiration has the most GEX tied up in it and this is where $421 and $425 appear quite clearly

Dealer positioning
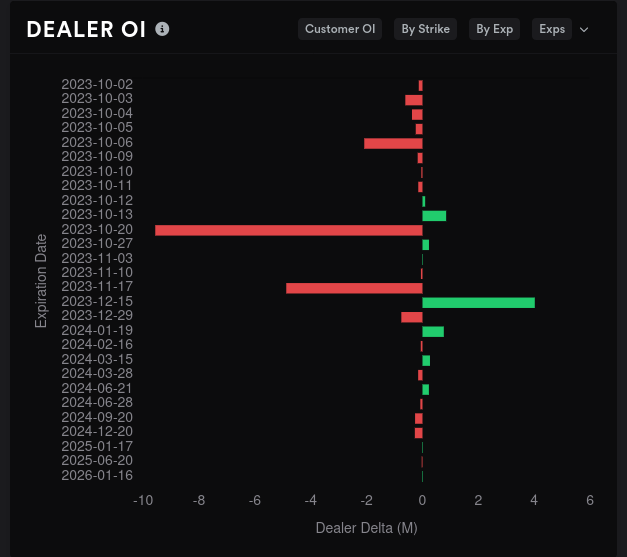
Amid all this bearishness, dealers find themselves sitting on a lot of short deltas right now. This suggests that customers have shifted the balance towards the bullish side. SPY has not been this net short since the summer of 2022 when we had a rally from the $360's to the $420's. Dealers are more net short than they were even for this year's March/April rally.
This is definitely something to watch. 👀

Dealer open interest suggests that 10/20 is incredibly bullish and by far the most bullish expiration on the chart. Bear in mind that these could be hedges for shorts or risk reduction for other trades. Vanna is quite negative for 10/20 as well and that suggests that an IV crunch might not send SPY into a rally.
Whales
On aggregate, whales are getting bullish on $430. The $420 strike is taking a steady drive down on the chart.

10/20 seems pretty special, so what are whales doing there? $415, $430, and $440 are lifting off to the bullish side and no strikes are making a clear move to the downside here. Getting back to $440 would be quite nice.

Chart
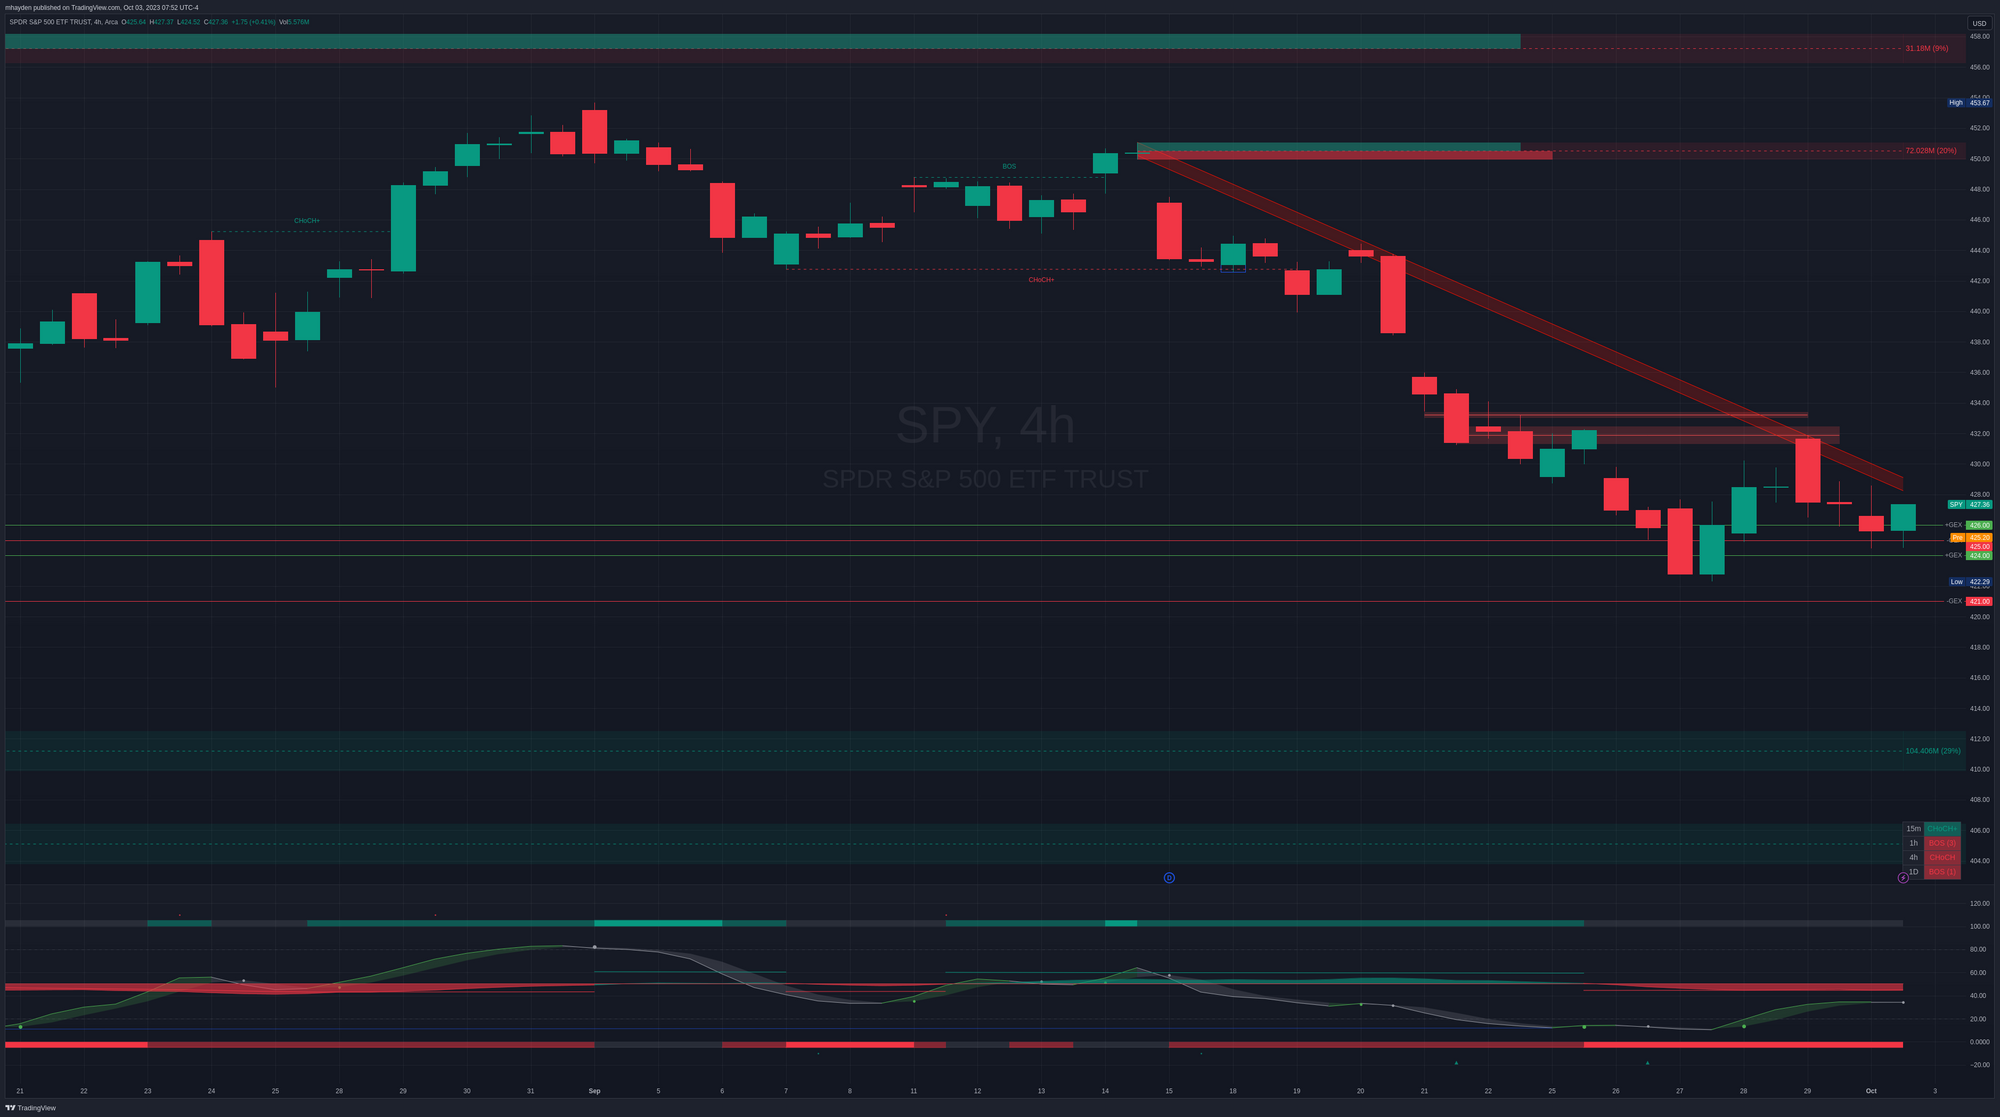
SPY's 4 hour chart shows price following a downward sloping trendline that has been tested more than once. We have fair value gaps around $432 and $433 which are likely going to act as resistance. Our nearest order blocks are in the lower $400s. The oscillator from LuxAlgo points towards a bullish move that stalled out on its way up and we see that in the chart as well.
Thesis
SPY needs to break its current trendline and get some good volume around $432 to break through the fair value gaps there. Once it does, there's a gap around $437 that also needs to be closed.
If we end up heading lower, we might get some help from the positive GEX at $424. There's a weak support line around $417-$420 as well. If we lose that, our next level of support shows up around $412 at the top of a good sized order block.
I don't have any active SPY trades right now, but I'd definitely consider one if SPY breaks through the downward trendline.
Good luck to everyone today! 🍀


Discussion