Semiconductor chart analysis for July 26th

Semiconductors had an amazing run and they're giving back some profits now. Let's find the levels to watch for a potential reversal.

Good morning! 🌅 There's a lot of chatter online about the dip that semiconductors have taken within the past week or two. This post will dive into some charts that highlight what happened and where semiconductors might catch a bid.
All investments come with significant risks, including the loss of all capital. Please do your own research before investing, and never risk more than you are willing to lose. I hold no certifications or registrations with any financial entity.
Let's get nerdy! 🤓
Measuring semiconductors with SMH
One of the easiest ways to measure the industry at a high level is to look at SMH, VanEck's semiconductor ETF. Take a look at the top 10 constituents:
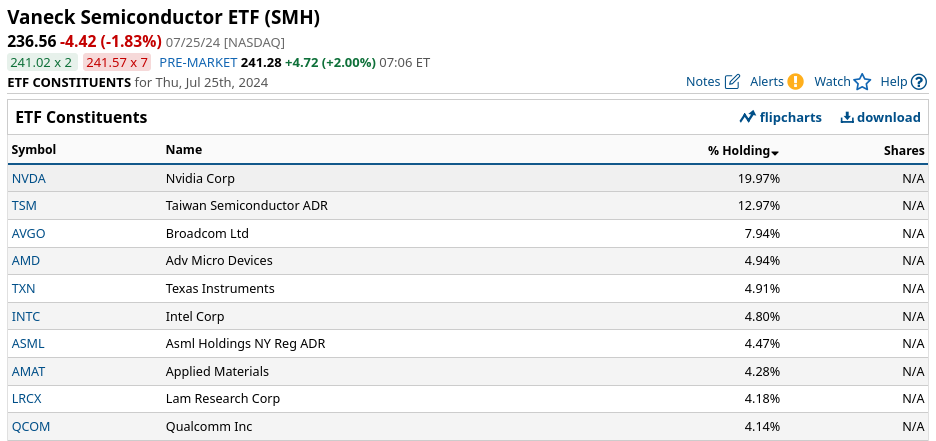
NVDA and TSM make up a huge percentage of SMH's moves each day, but this is still one of the best measures I've found for the industry overall. Let's take a look at a weekly chart of SMH:
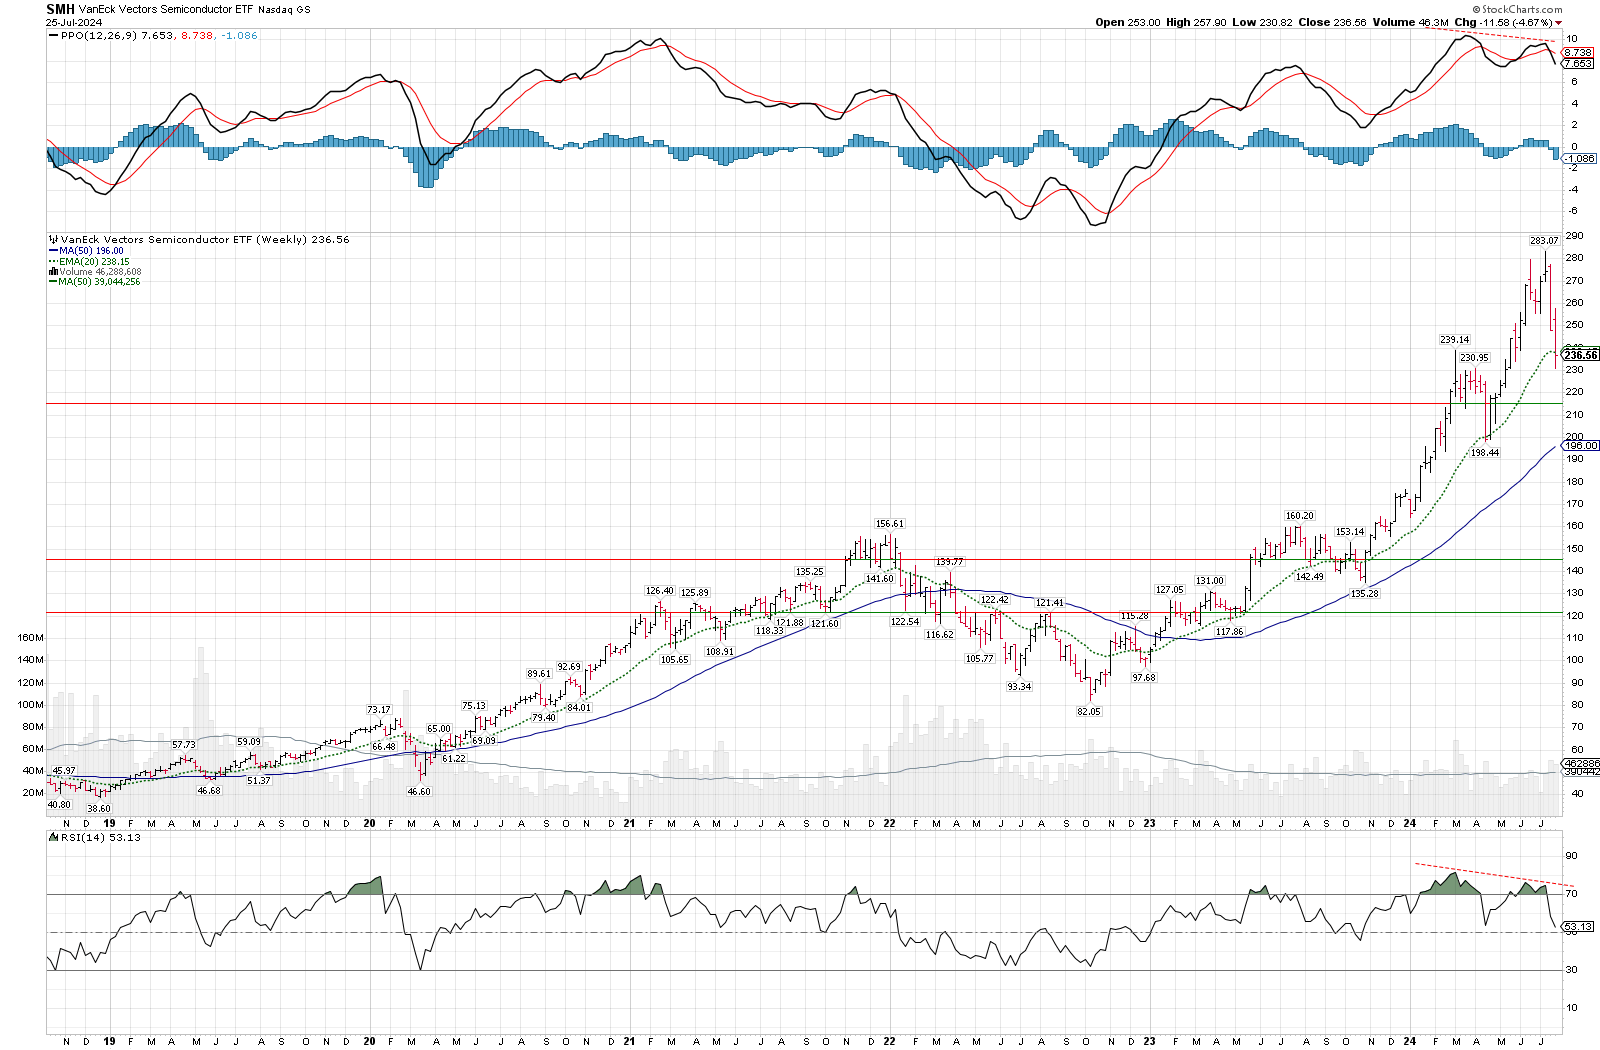
Two things immediately stick out to me here:
- Semiconductor stocks gained over 200% from the lows in 2022 to 2024 (wow!) and gave back about 15% in July. That's quite a run.
- The PPO and RSI indicators both show a negative divergence. This suggests that price is making new highs, but it's doing so on lower momentum. Both of these indicators marked the same trend change in 2021 as SMH slid lower through most of 2022.
From looking at this chart, I'm thinking semis will face some weakness in the short to medium term. However, the long term trend is definitely intact with the 50-week moving average looking incredibly strong. That can change in a hurry, but it looks great now.
Another way to measure weakness is to compare SMH to a market benchmark, such as SPY. If SMH is indeed weakening, we should see a similar pattern when we compare it to SPY. When this chart goes up, SMH is gaining strength over SPY. When it goes down, SMH is losing strength relative to the market.
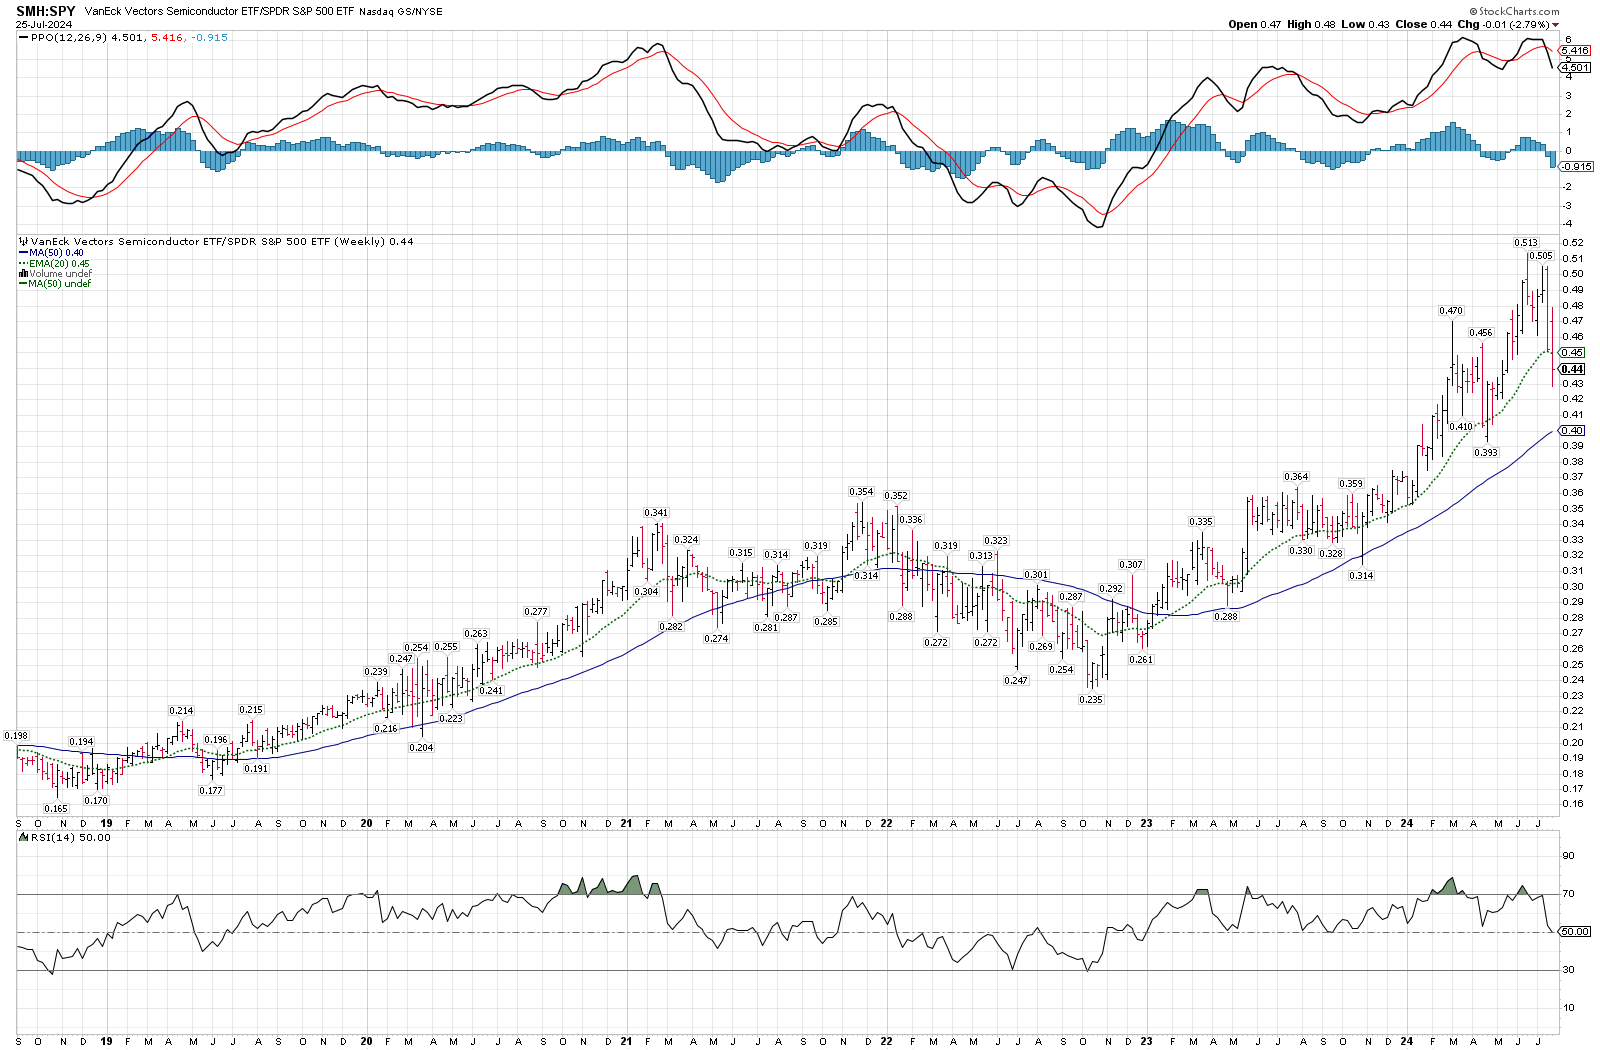
Notice that the two recent highs were marked by PPO levels that are nearly identical. The PPO fast line slashed through the slow line shortly after the second peak. This suggests that the momentum for the most recent high wasn't higher than the previous one. Look back to the PPO levels from 2021 and you'll see the same pattern.
What do we know now? SMH is showing weakness in isolation and relative to SPY.
Institutional trades
Traders with deep pockets have some fairly large positions, and Volume Leaders tries to find these trades and compare them with previous ones for context. We can take a look at SMH on the site along with the leveraged semiconductor ETFs SOXL (3x long) and SOXS (3x short).
Let's start with SMH since July 16:
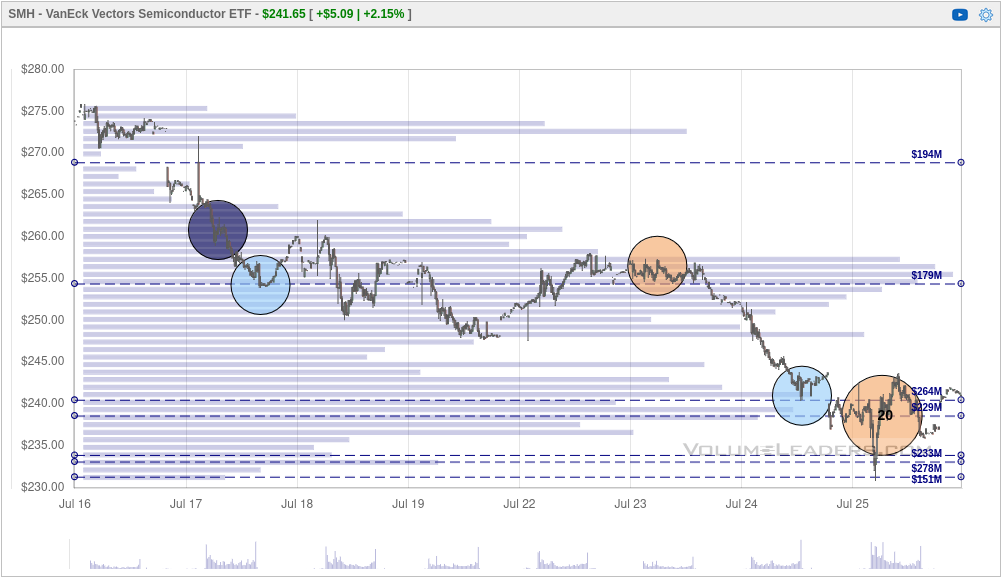
Blue circles indicate trades on the lit exchange, which are regular trades made in the market while it's open. Yellow circles are dark pool trades and these could be clumped trades from market makers like Citadel or it could be off-exchange trades from large firms.
Starting at the right side, we see a #20 trade, which is the 20th biggest trade ever made on SMH since it began trading. It was about 960K shares at $238.63, which is around $229M. If we work backwards, there were four big trades prior to that one when SMH began to slide:
- July 17: 205K + 207K shares
- July 23: 215K shares
- July 24: 226K shares
I see a couple of scenarios here:
- Someone was adding to shorts on the way down and then covered their shorts yesterday.
- Someone was going long on the way down and then threw in the towel yesterday.
I doubt it was someone going long on the way down, but I want more context. Let's take a year to date chart from VL and examine it:
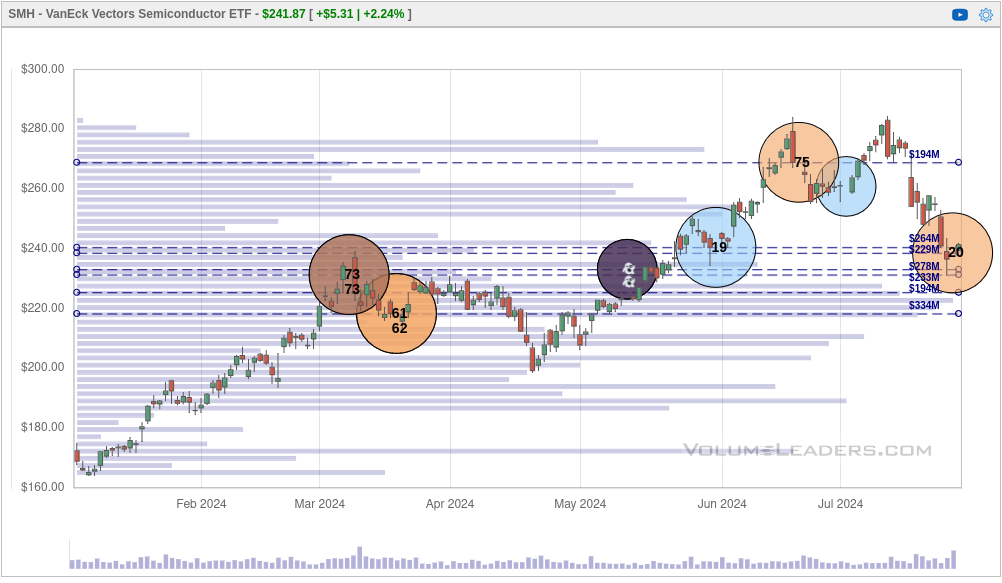
Look at #19 from May 31! 956K shares traded around $240.48. That was a $230M bet. This suggests to me that this is a critical level for SMH in the short to medium term. If the ETF trades higher than this $230-$240 range, then we might have found some support at this high volume level. If we lose the level, $218 seems the next likely target.
Leveraged ETFs
Charts of leveraged ETFs hold some very interesting patterns. Institutions like to use them to pick up quick moves and they tend to get in and out fairly quickly. This makes them a little easier for picking up patterns. Let's start with SOXL, the 3x long ETF:
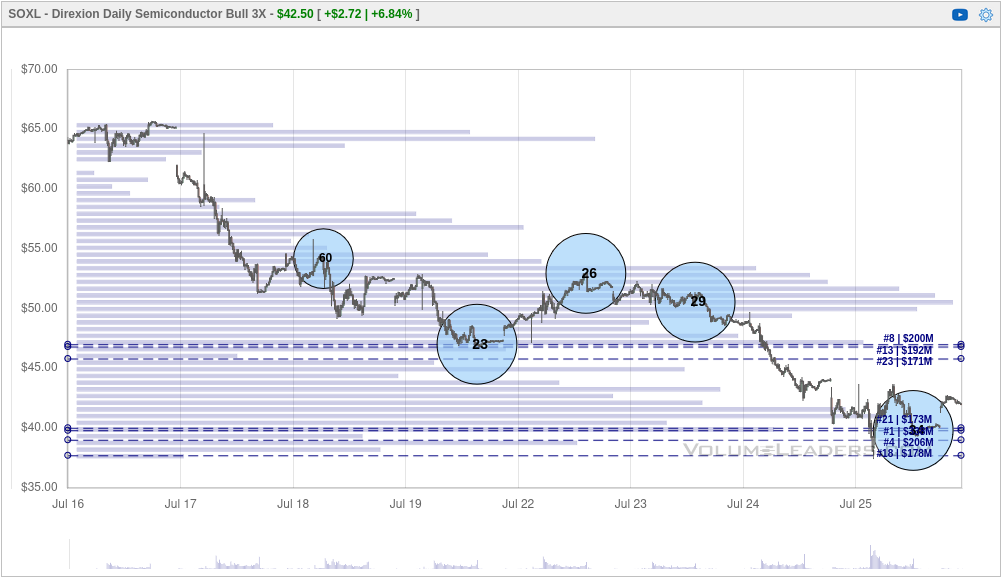
There's a lot happening around that last trade on the right, but it's a #34 trade around $39 around the #1 volume level for SOXL. This is a critical level to hold and mark on your charts.
How about SOXS, the 3x short ETF? You have to think upside down to read this one, but let's have a look:
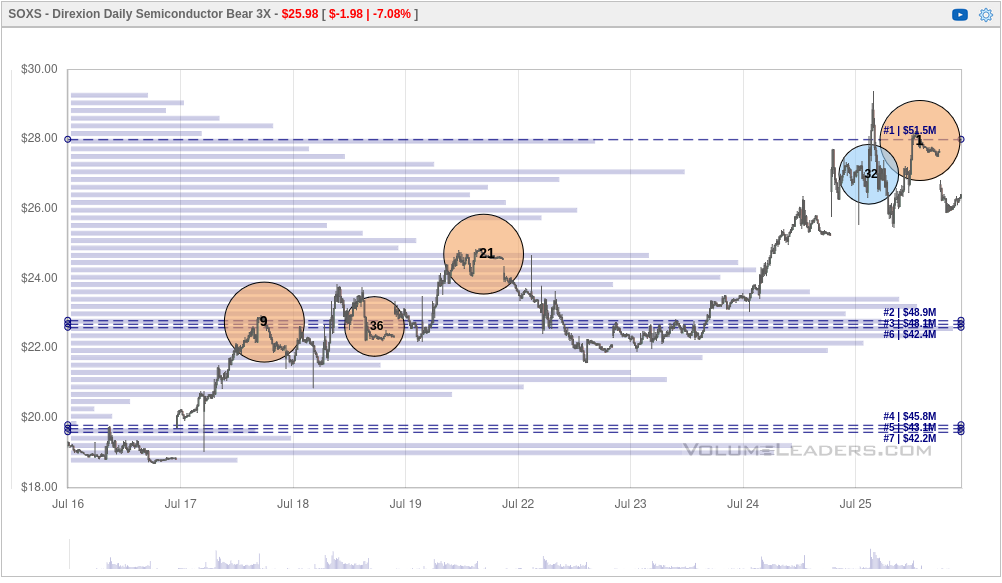
We had a #1 trade yesterday that was the largest in the history of SOXS. 👀 When I see a #1 trade, especially in a leveraged ETF, my brain starts to think "reversal". A reversal lower on a short ETF means the underlying ETF should go up (SMH price increase).
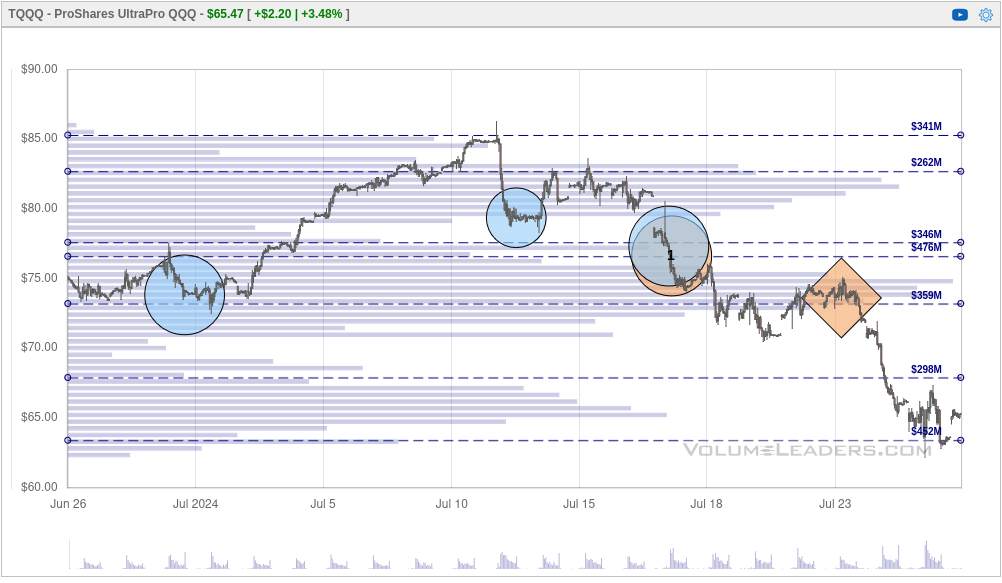
A good example of this is one that caused a lot of excitement in the VL Discord community when TQQQ posted a #1 trade:
Constituents
NVDA and TSM are the two top constituents, so how do they look?
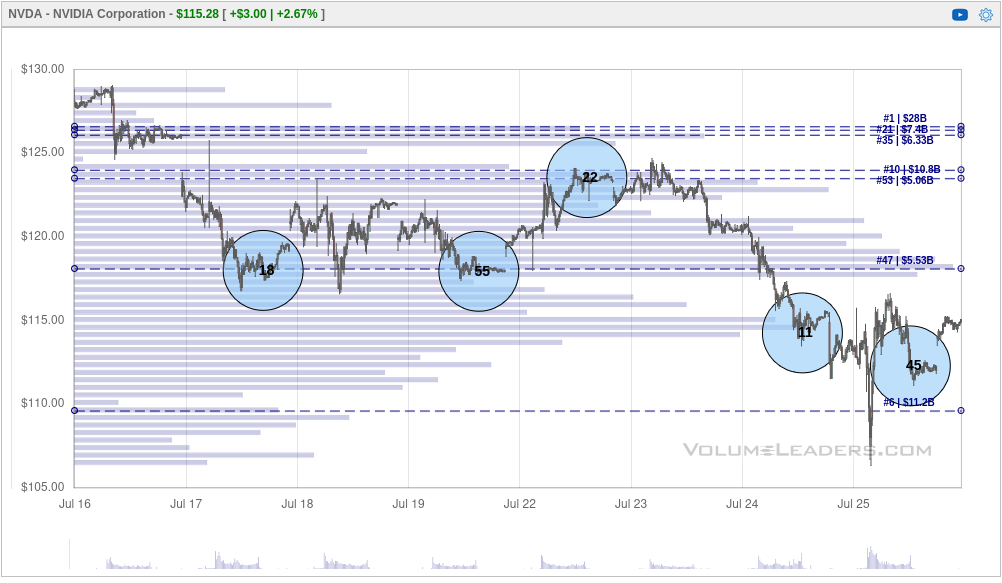
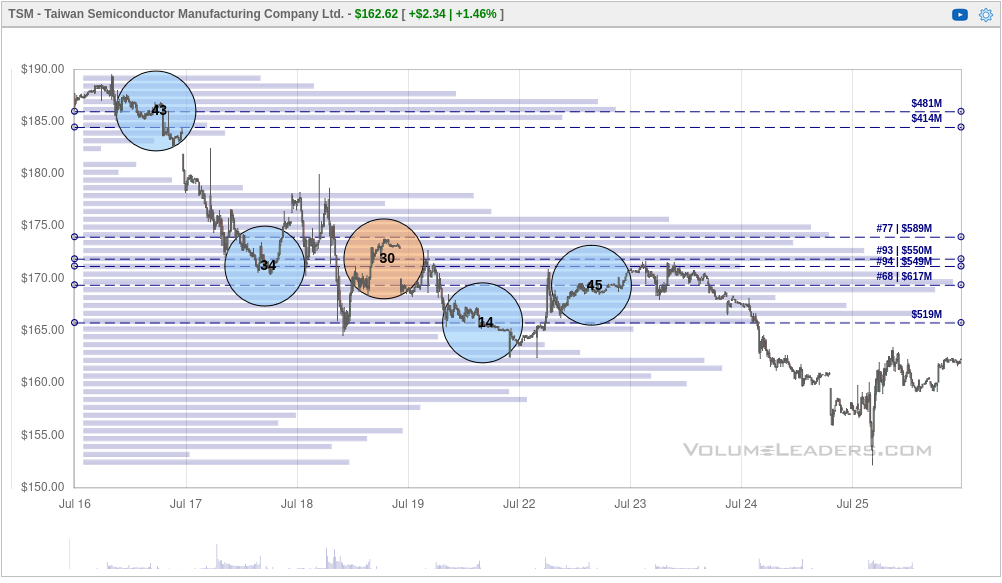
NVDA/TSM VL charts
TSM's chart isn't terribly helpful, but NVDA posted a #11 and #45 trade at the lows just above the sixth biggest volume level. Keep an eye on NVDA $112-$114 as a very important level here. If it holds, we might see a bounce in this current short term trend. If we lose that level, be sure you have an exit plan. 😉
Thesis
Semiconductors have had an amazing run for almost two years and pullbacks in the market are totally normal. This pullback is starting to show signs of a bounce, but pick your levels carefully and define an exit plan if you happen to be wrong.
Price and volume are the only two things that won't lie to you in the stock market. You can get both on a stock chart for free! Try not to get too caught up in the news cycle or the ravings of random fintwit people – much of that is there to confuse you and encourage you to make bad decisions. 😜
Do your homework!
Good luck in all your trades this week! 🍀
Discussion