September 13th Point and Figure breakouts

Let's walk through a point and figure breakout scan and I'll share how I analyze charts before the market opens. 🌄

Happy Friday! Markets continue their whipsaw but I've been seeing some optimistic green shoots in different areas. I'm gradually shifting from a delta neutral position to a more directional stance and that requires a careful look at stock trends.
All investments come with significant risks, including the loss of all capital. Please do your own research before investing, and never risk more than you are willing to lose. I hold no certifications or registrations with any financial entity.
Let's dig into some charts today.
Scanning for breakouts
I've been talking a lot about point and figure charts on the blog lately because they offer a much less subjective take on market mechanics. They bring a less noisy experience relative to candlestick charts, too.
StockCharts has a handy stock scanner where you can set criteria and get a list of stocks returned that match your requirements. I've been working through revisions of a point and figure breakout screener and here's the current revision:
[ country is US ]
and [SMA(5,volume) > 1000000] # Decent volume required
and [optionable is true] # I'm selling options here, y'all
and [PPO Line(12,26,9) > ppo Signal(12,26,9)] # PPO line needs to be over signal
and [PPO Line(12,26,9) > 0.0] # PPO line must be over zero
and [RSI(14) > 49] # In the top half of the RSI indicator
and [RSI(9) > RSI(14)] # Improving RSI recently
and [Price Relative(SPY) > yesterdays Daily Price Relative(SPY)] # Strength relative to SPY must be growing
and [SCTR > 70] # Long/Medium/Short technical indicators need to be decent
and [ [PnF Triple Top Breakout is true] # Three is even better
	or [PnF Spread Triple Top Breakout is true] # Better over long time periods
	or [PnF Quadruple Top Breakout is true] # Whoa, four is awesome!
	or [PnF Ascending Triple Top Breakout is true] # Broke out once, did it again!
	]
To summarize, I want to find stocks:
- With decent trading volume that also have options
- With a strong Price Performance Oscillator (PPO)
- With a strong, improving Relative Strength Index (RSI)
- With improving strength relative to SPY
- With a high SCTR (StockCharts blended short, medium and long term technical indicator)
- With a strong point a figure breakout that is greater than a double top breakout
That gives me this list for today:
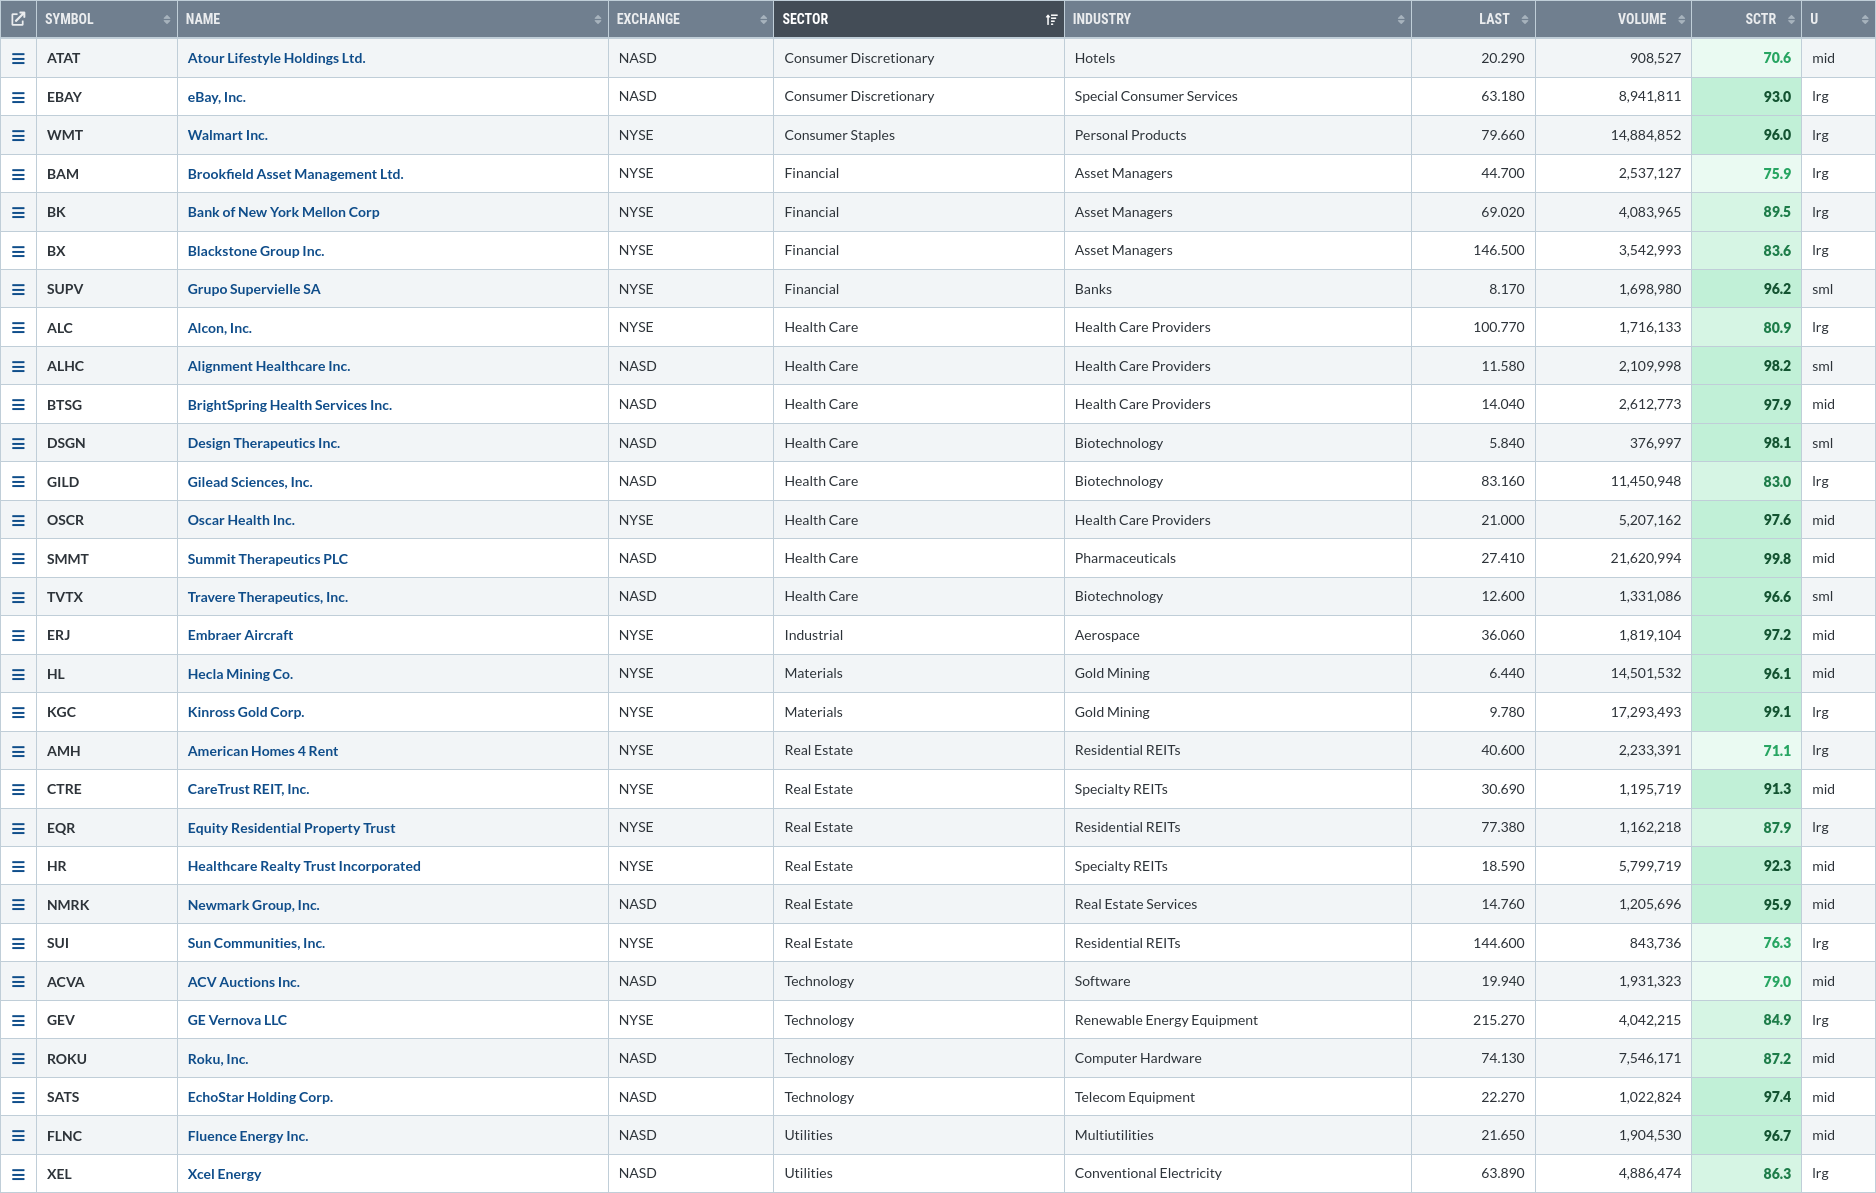
I've sorted them by sector so I can see which sectors are represented. Health care wins with eight stocks in the list, followed by real estate with six. Technology and financials are tied for third place with four each. This still feels like we're in a defensive stance, but I'm glad to see tech, financials, and consumer discretionary making a larger showing here than they have before.
Let's pick apart a few of these charts to get an idea of their trend.
EBAY
Yes, the auction site we all know (and sometimes love) has been on a tear since the spring of 2024:
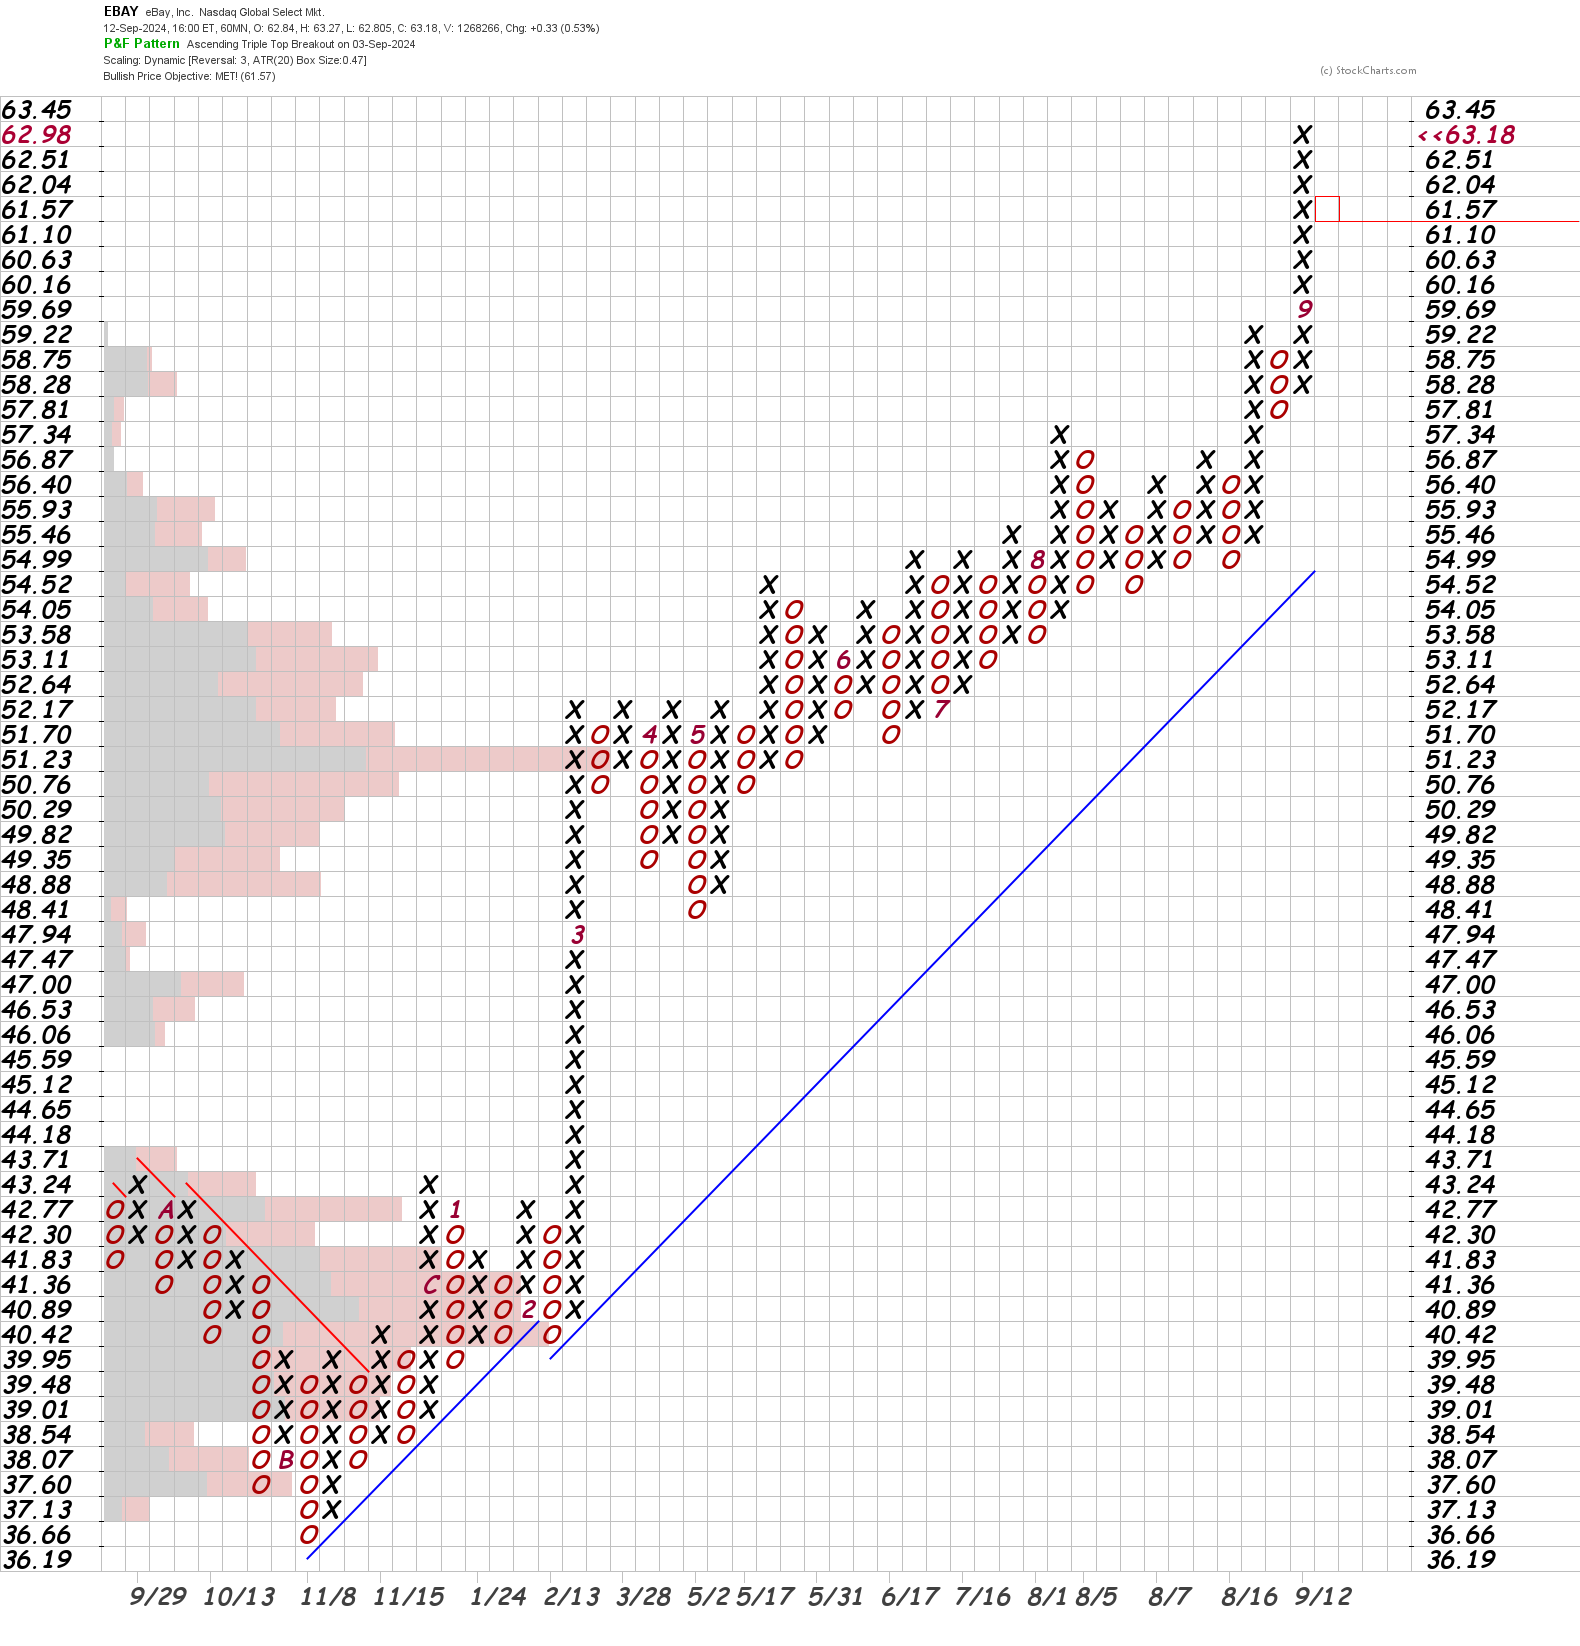
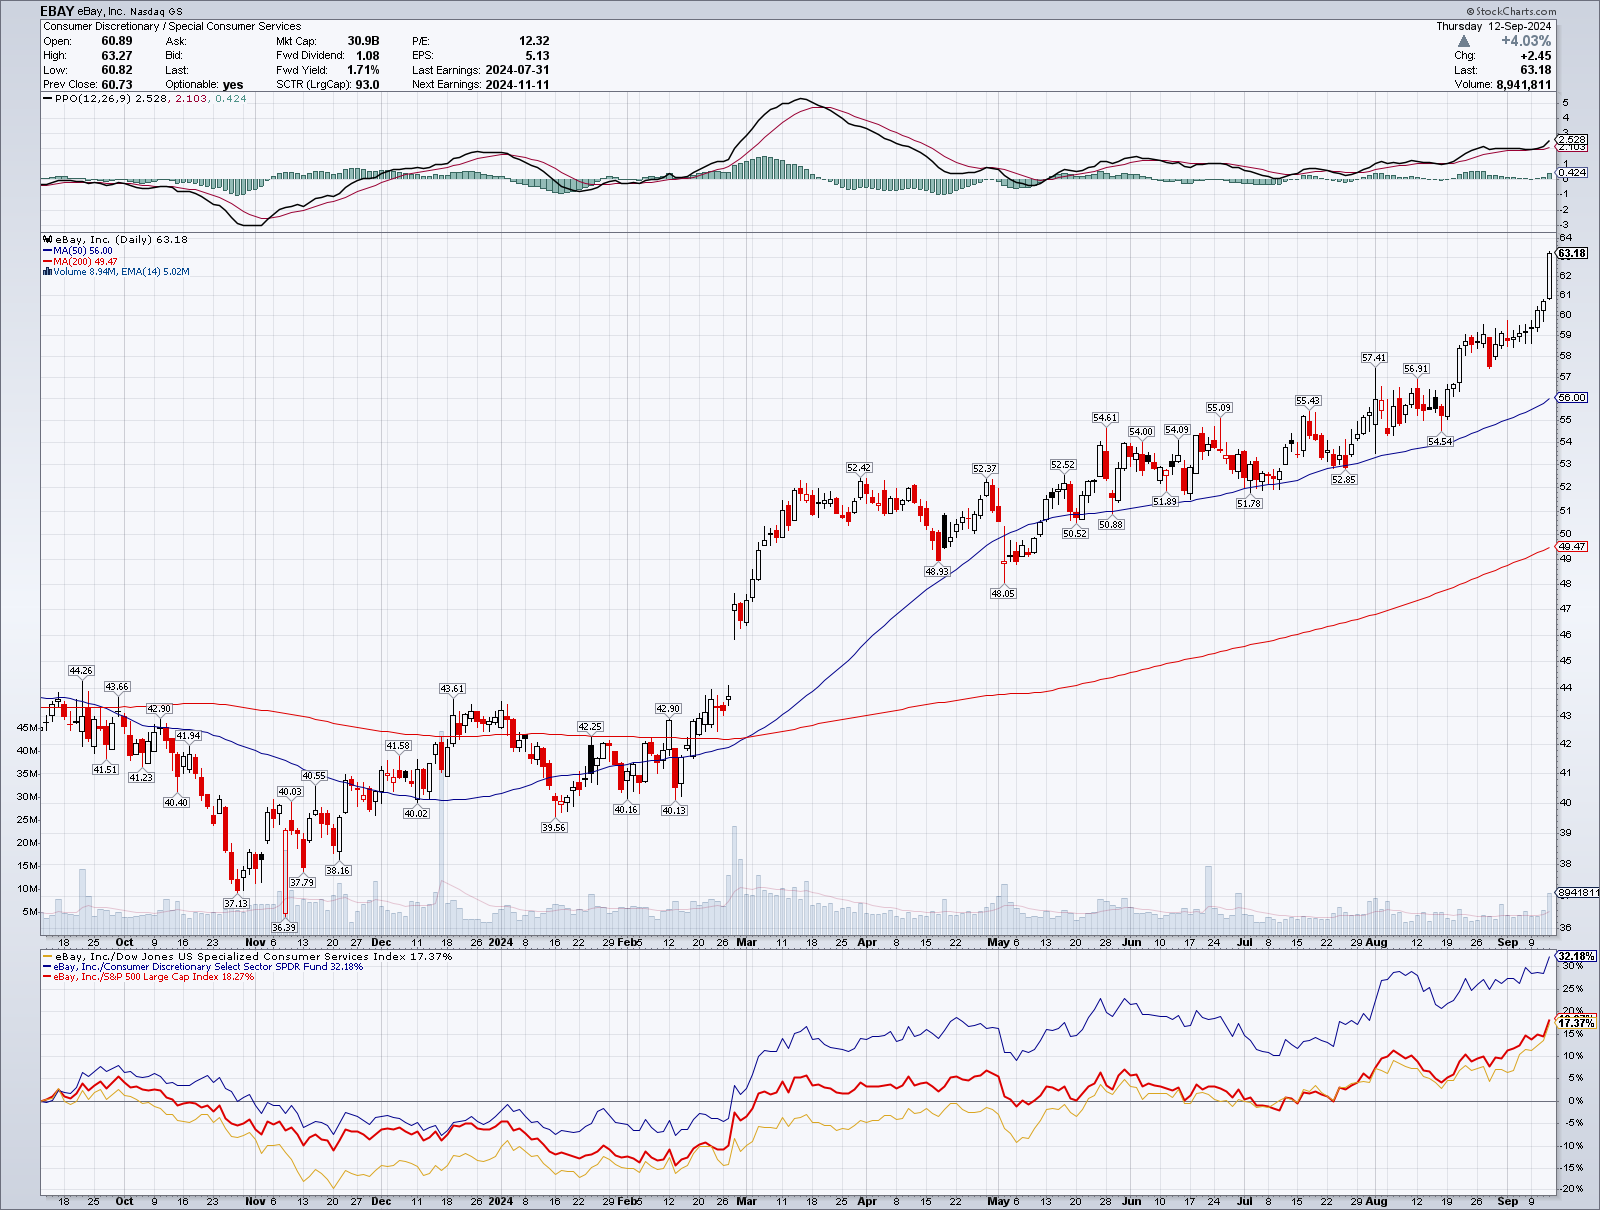
EBAY charts
The point and figure chart continues to rise, although it's been on a track that is a little bit less than a 45° angle. Price has gradually closed the trend line gap since February, but then it had a strong bounce around $55.
The candlestick chart shows us two upward moving averages properly stacked along with increasing strength relative to its industry, sector, and the SPY ETF. The PPO also looks strong as it's above zero with a recent bounce off the signal line. I also love the way that this stock has had little pullback moments followed by rallies since May. That leads me to think that this is more of a health price movement than something parabolic and unsustainable.
The PnF chart calls for a price target of 61.57 and EBAY recently hit that target. I'm interested to see if we get some consolidation at this level followed by another breakout.
WMT
As the dollar stores sag on their earnings calls, Walmart continues to rally:
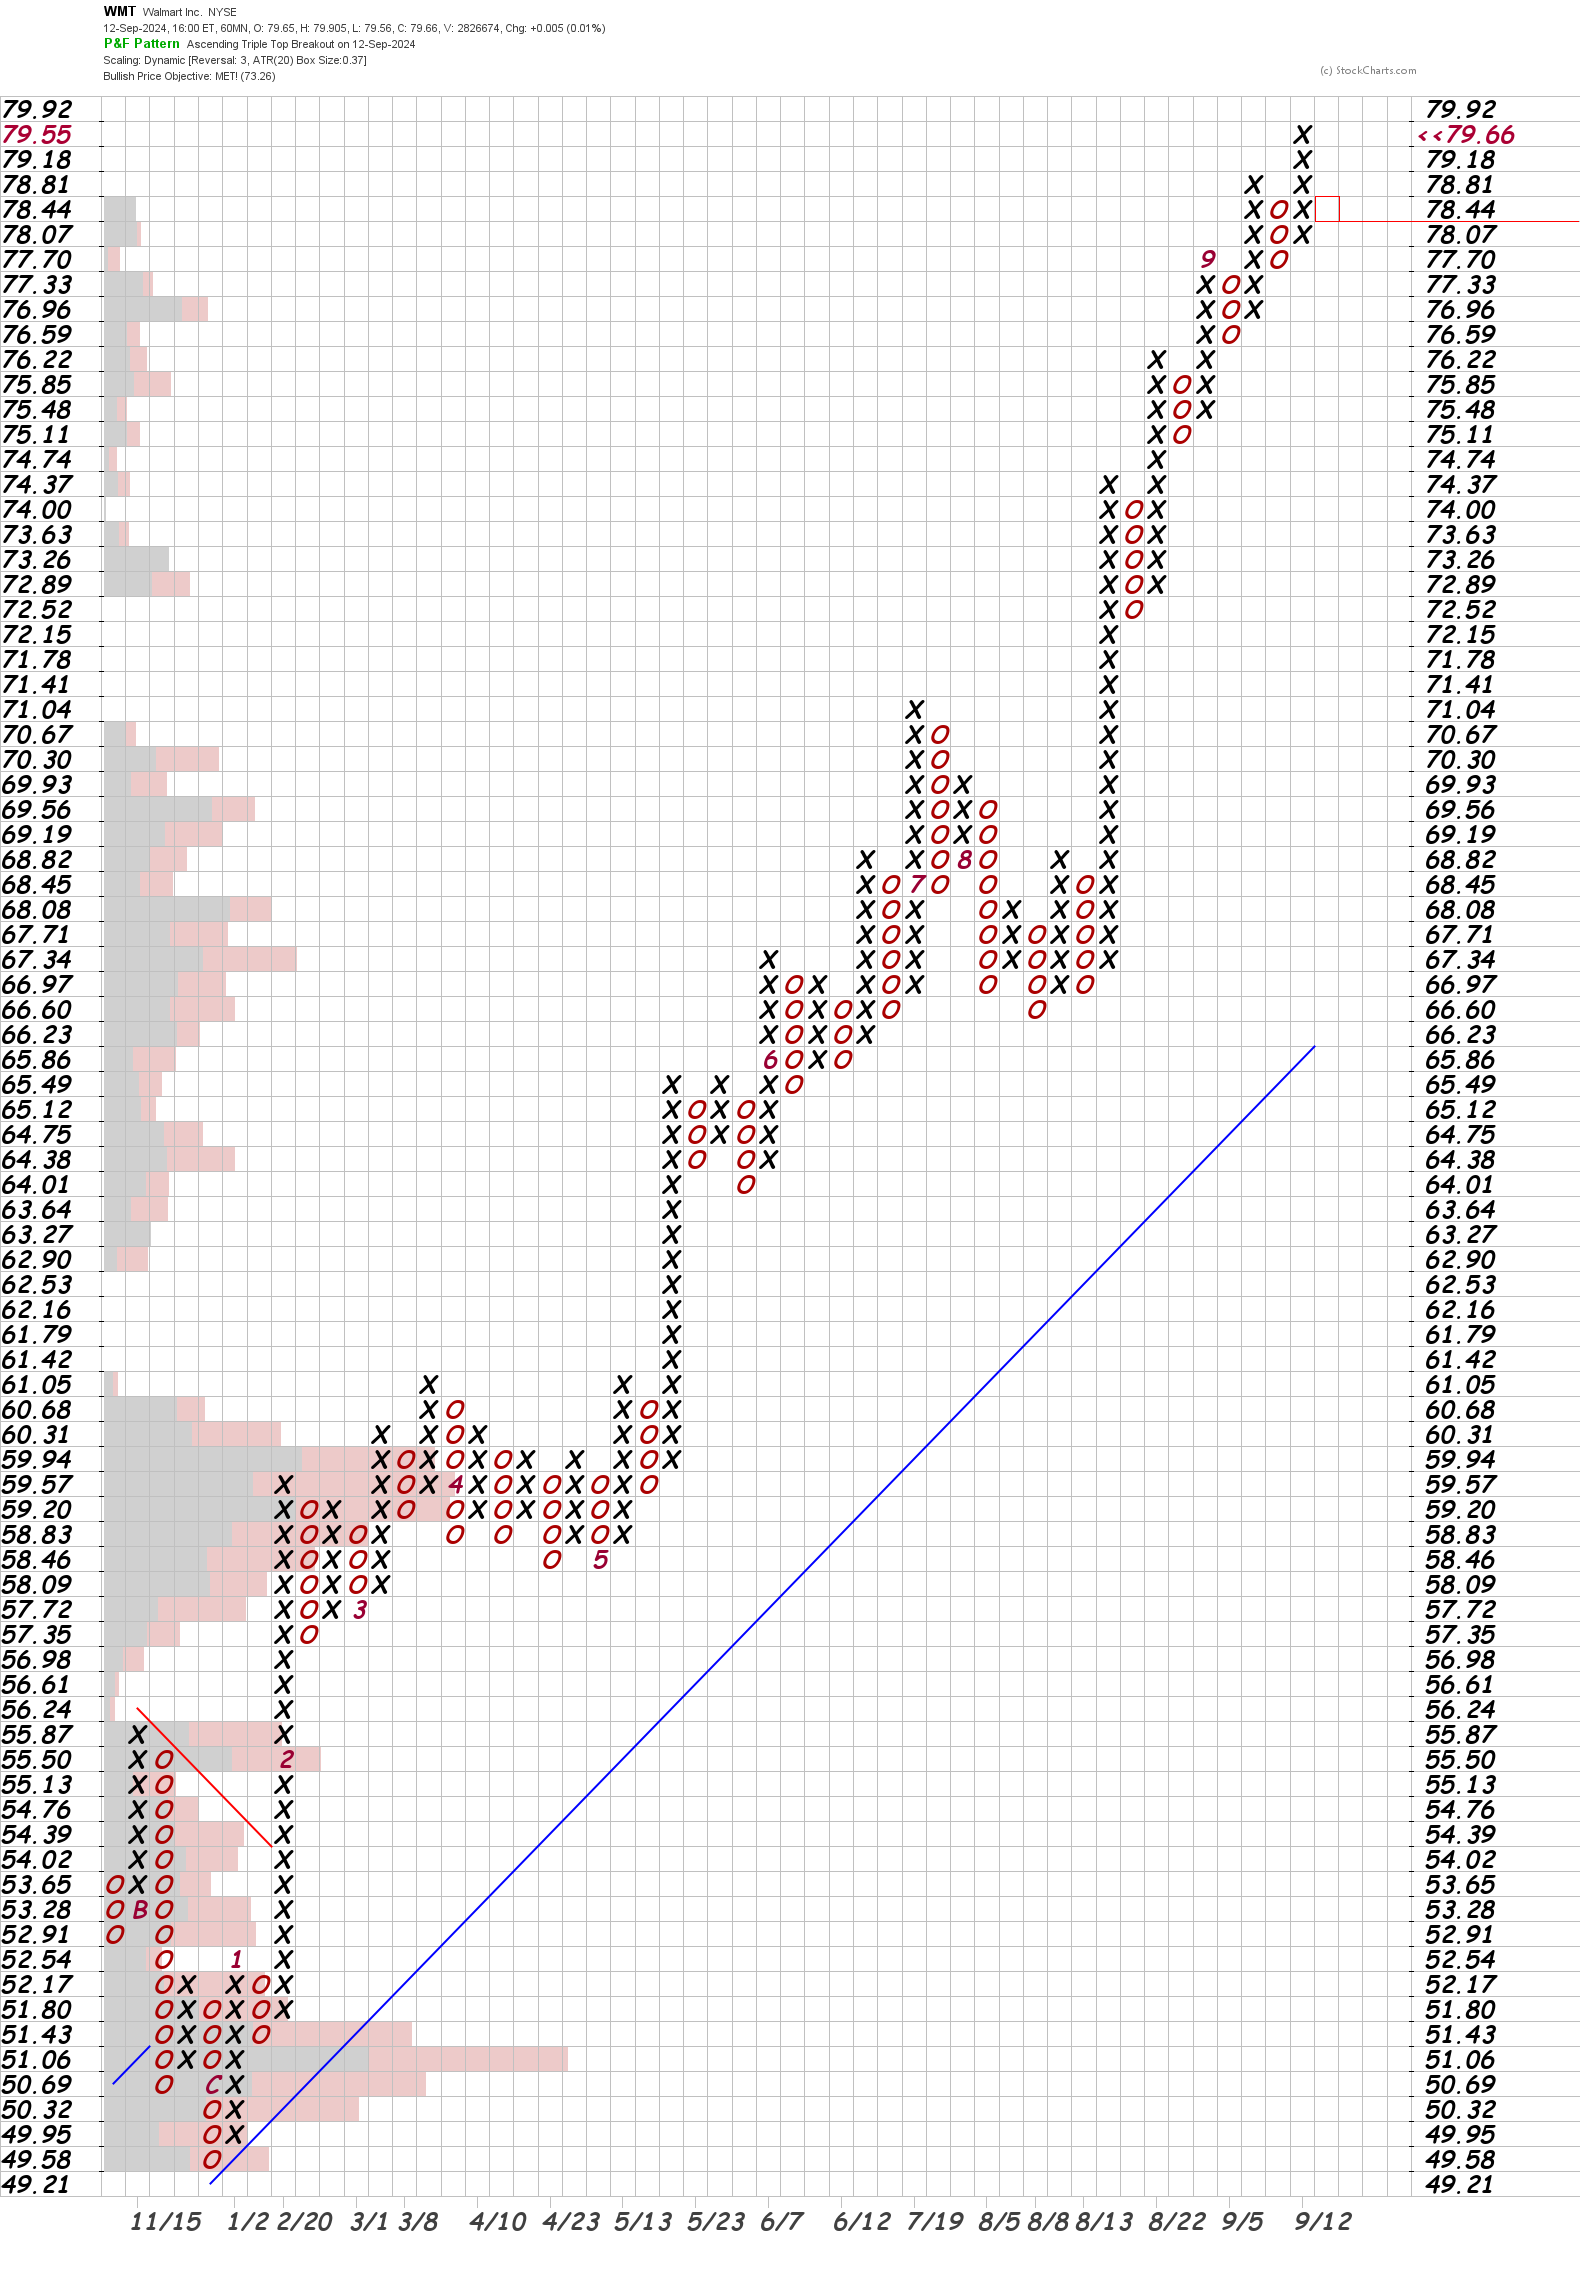
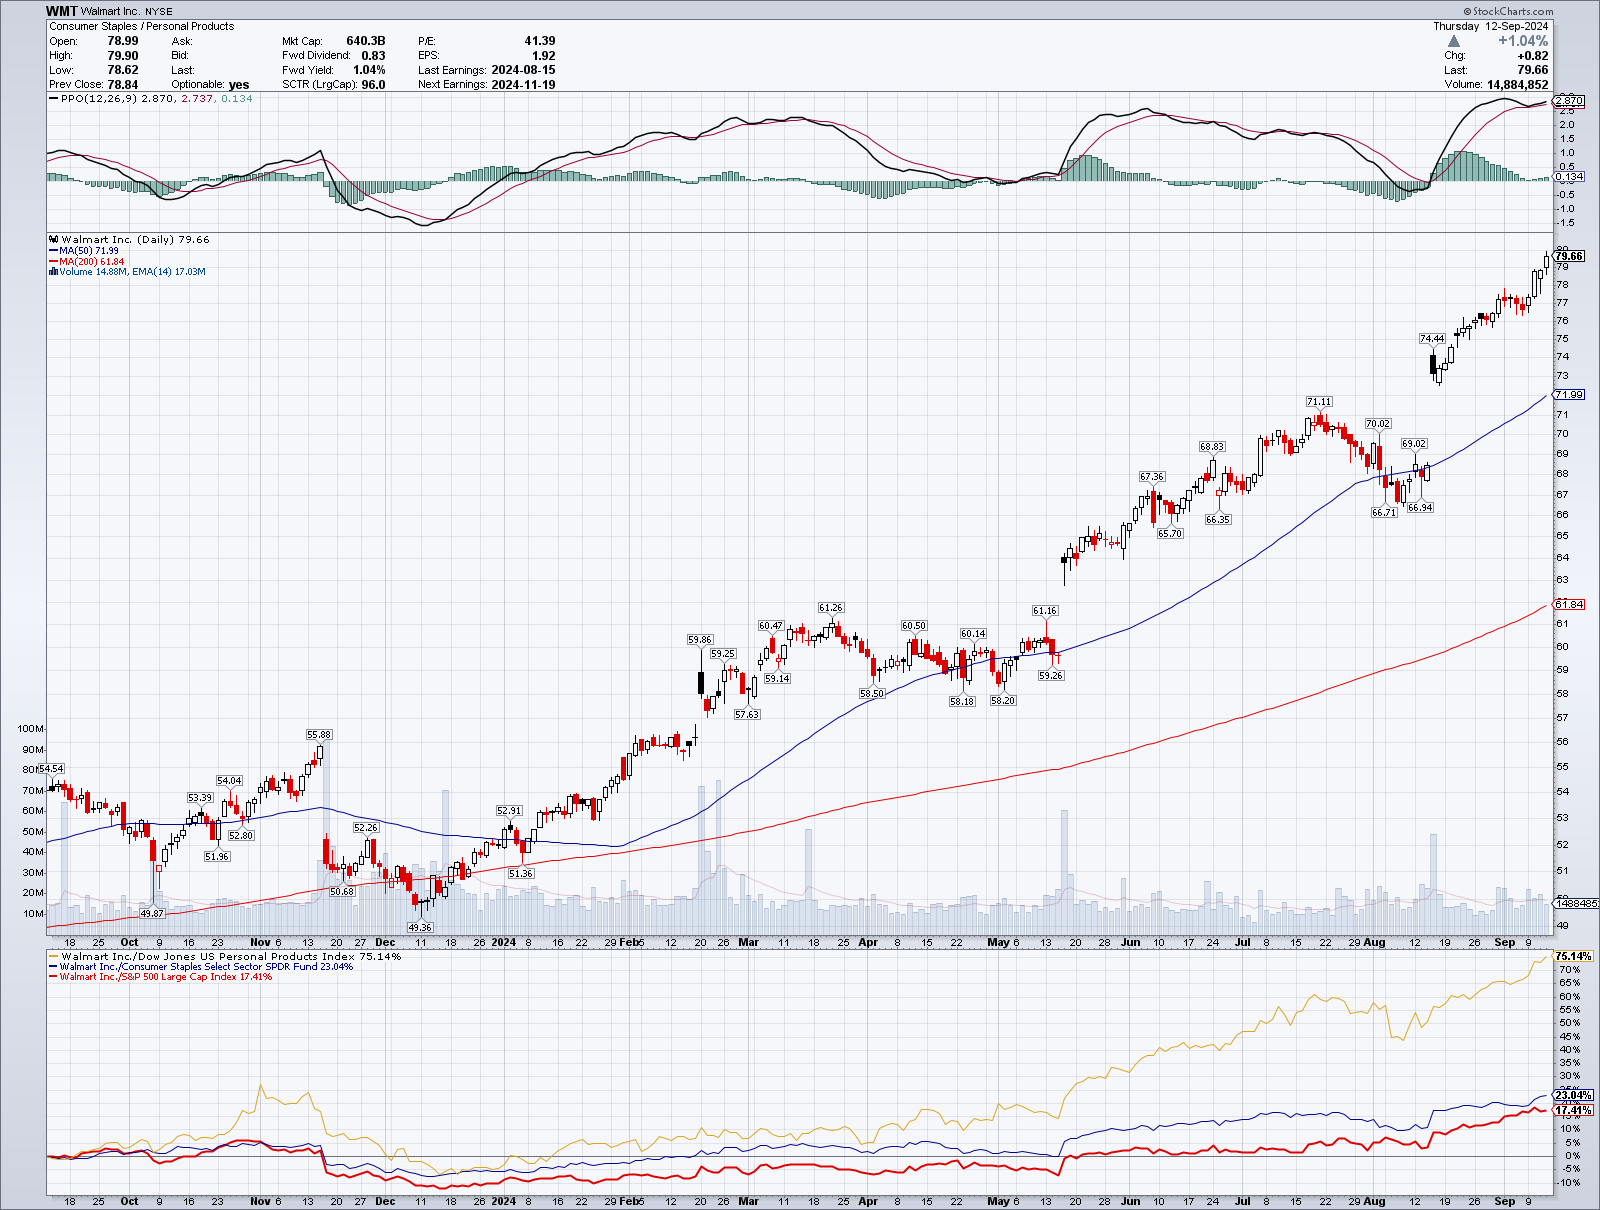
WMT charts
It's tough to get the point and figure chart to fit on one screen! The price objective on the chart is $73.26, but WMT already crushed that target. It's well above the current trend line. WMT would need to break below $78.44 to begin drawing a new column of Os and potentially start a consolidation box.
The candlestick chart shows a strong PPO that just retested the signal line. It also has increasing moving averages that are properly stacked.
One interesting thing to note is the relative strength at the bottom of the chart. Sure, WMT is gaining strength on its sector (XLP) and the S&P 500 in general, but look at the strength relative to its industry, the Dow Jones Personal Products Index. The separation there started in early 2024 and kicked into overdrive by mid-May.
ERJ
Embraer makes lots of airplanes and their charts show a successful take-off:
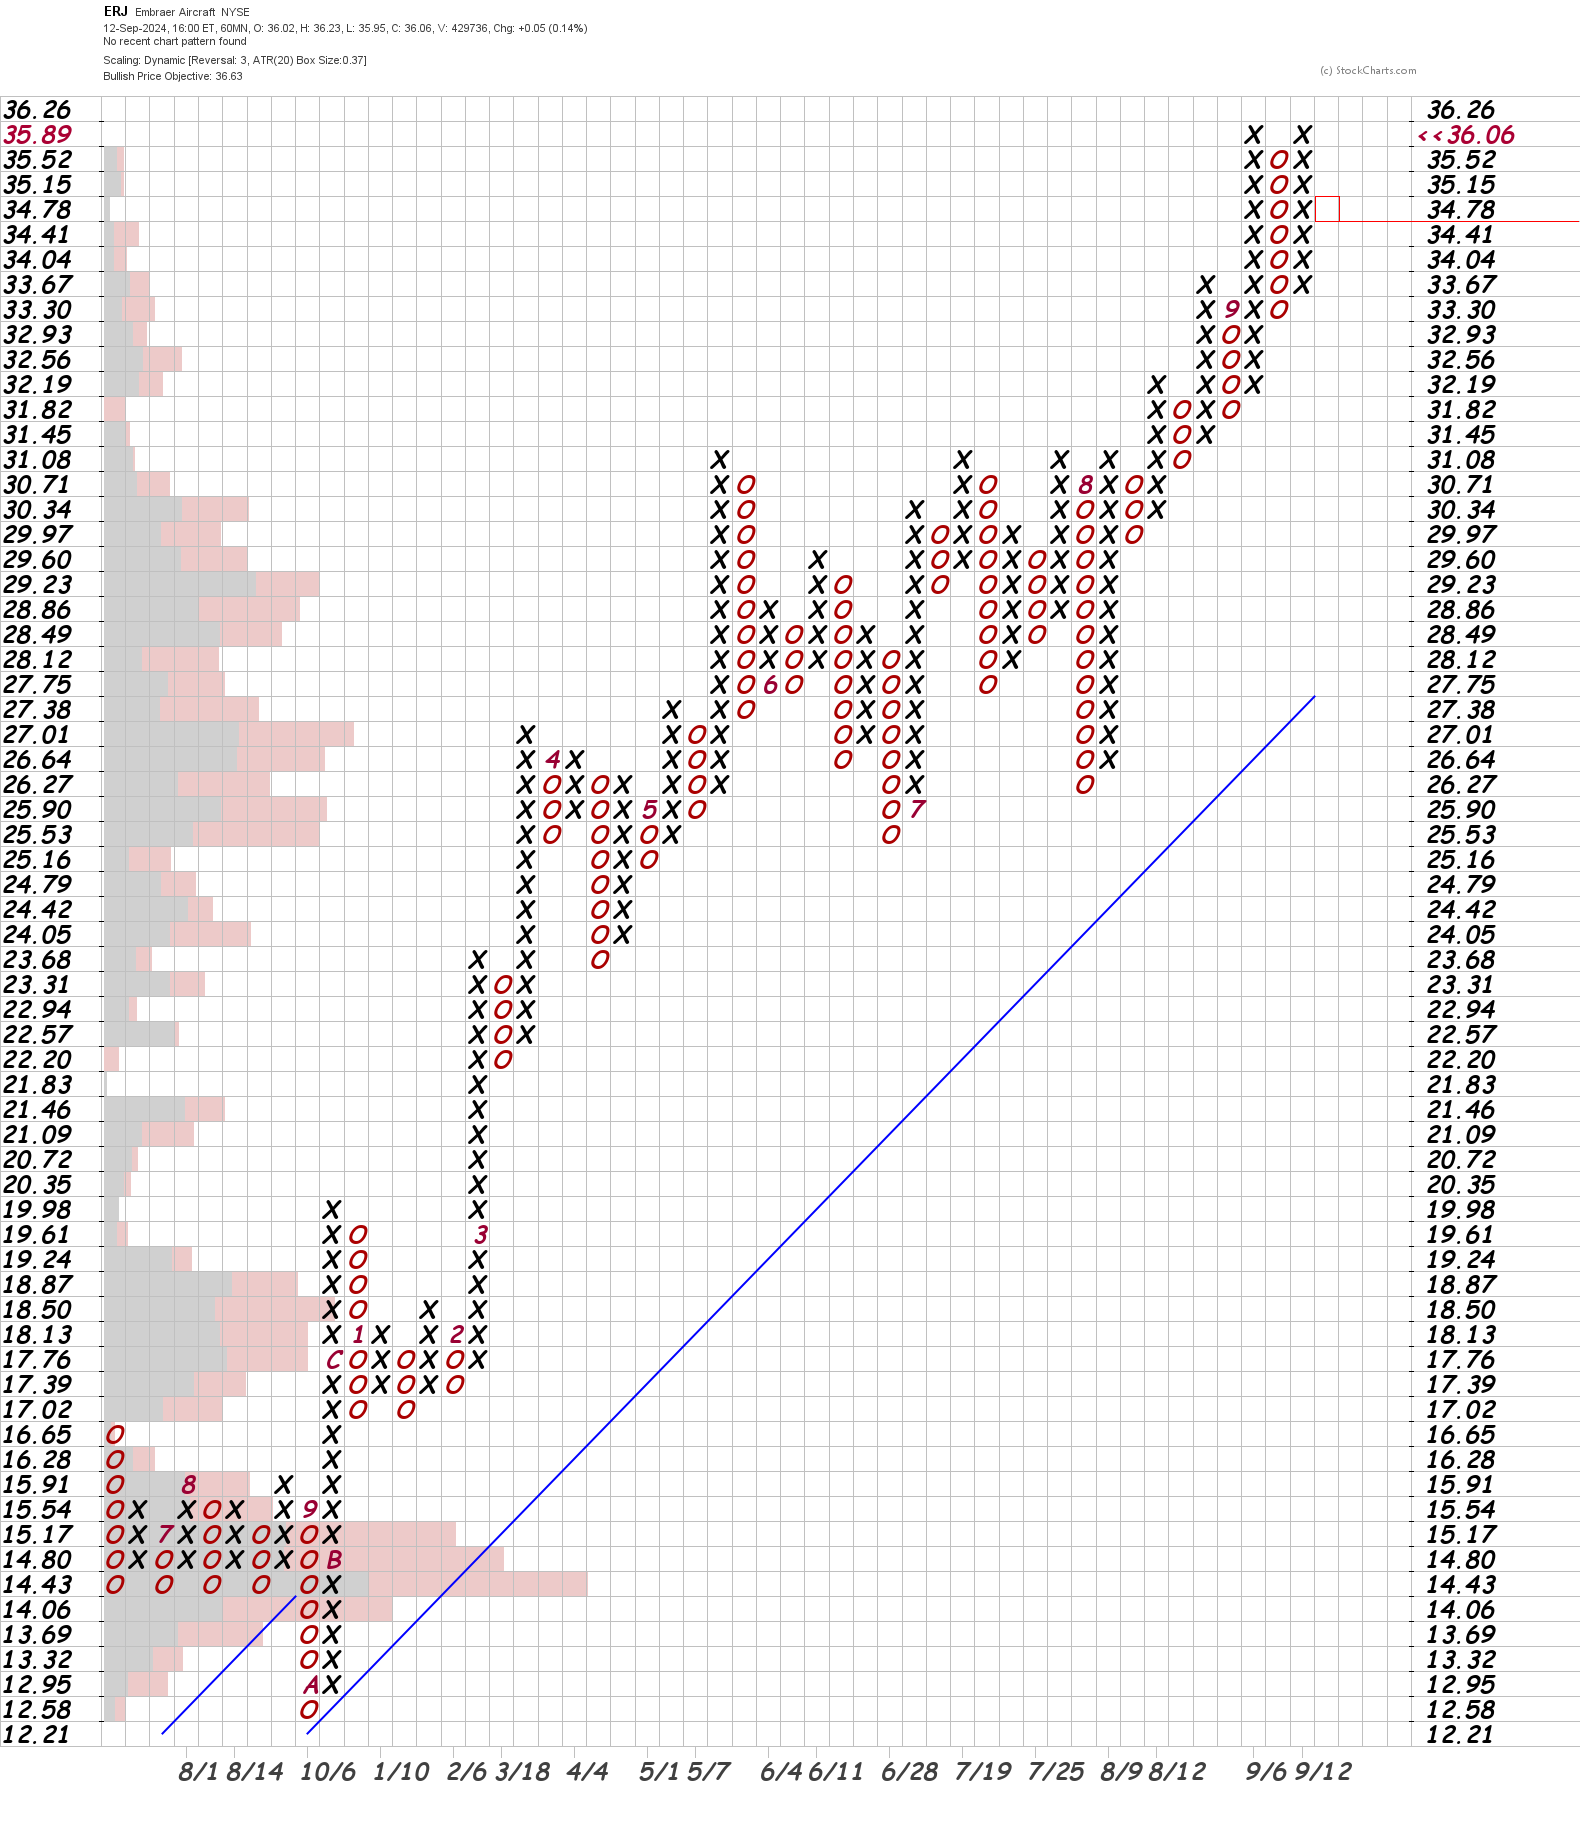
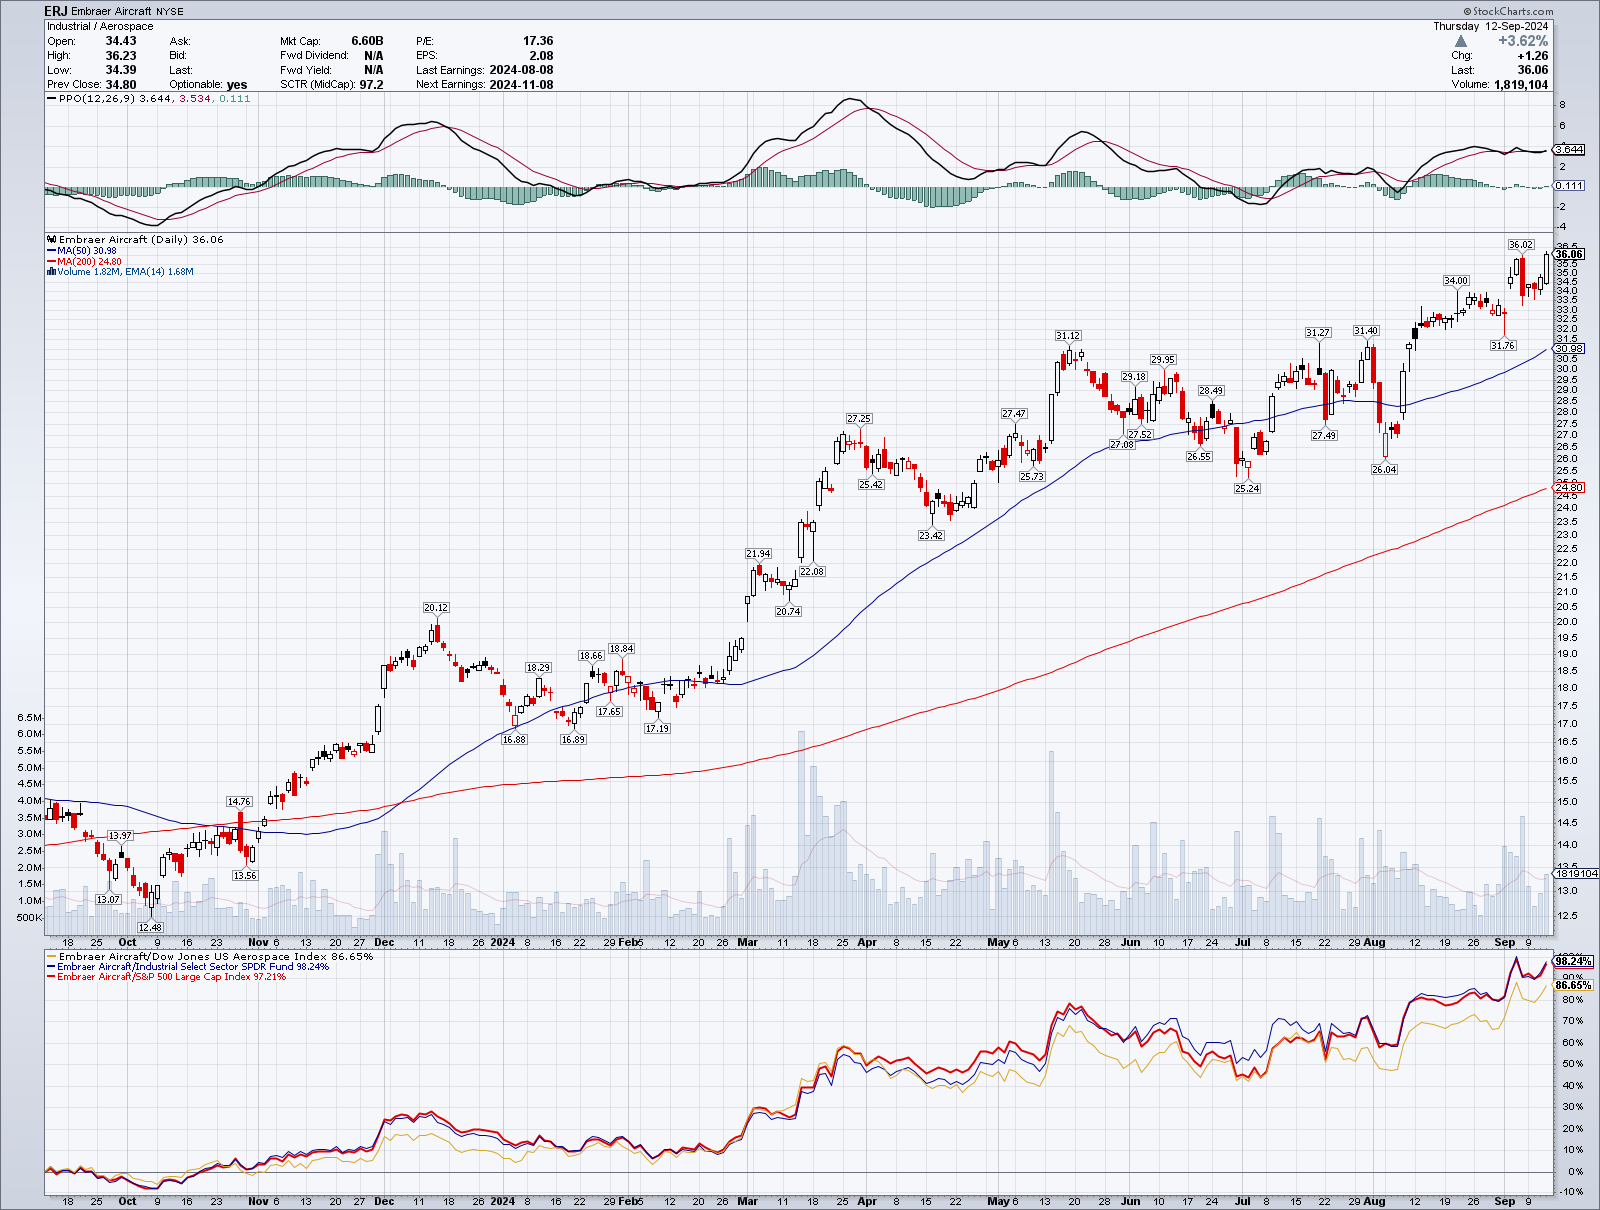
ERJ charts
ERJ's point and figure chart shows an ascending double top, but if you look closely, it's made a few of those in a row. It reached its price objective already, so there aren't any chart patterns to identify right now. If it breaks above $36.26, we will have another breakout and a new target.
The candlestick chart shows us bullish moving averages and a PPO that bounced off the signal line. The PPO is positive here, but it looks like it's ready to consolidate or potentially pull back a bit.
Relative strength lines show consistent relative strength gains across the industry, sector, and the index. This suggests to me that the gain in strength is more sustainable, but the PPO indicator and PnF chart argue for some short term consolidation.
ROKU
Anyone who traded ROKU through 2022 and 2023 can show you their scars. This stock went through some serious growing pains but it seems to be on a better trajectory lately:
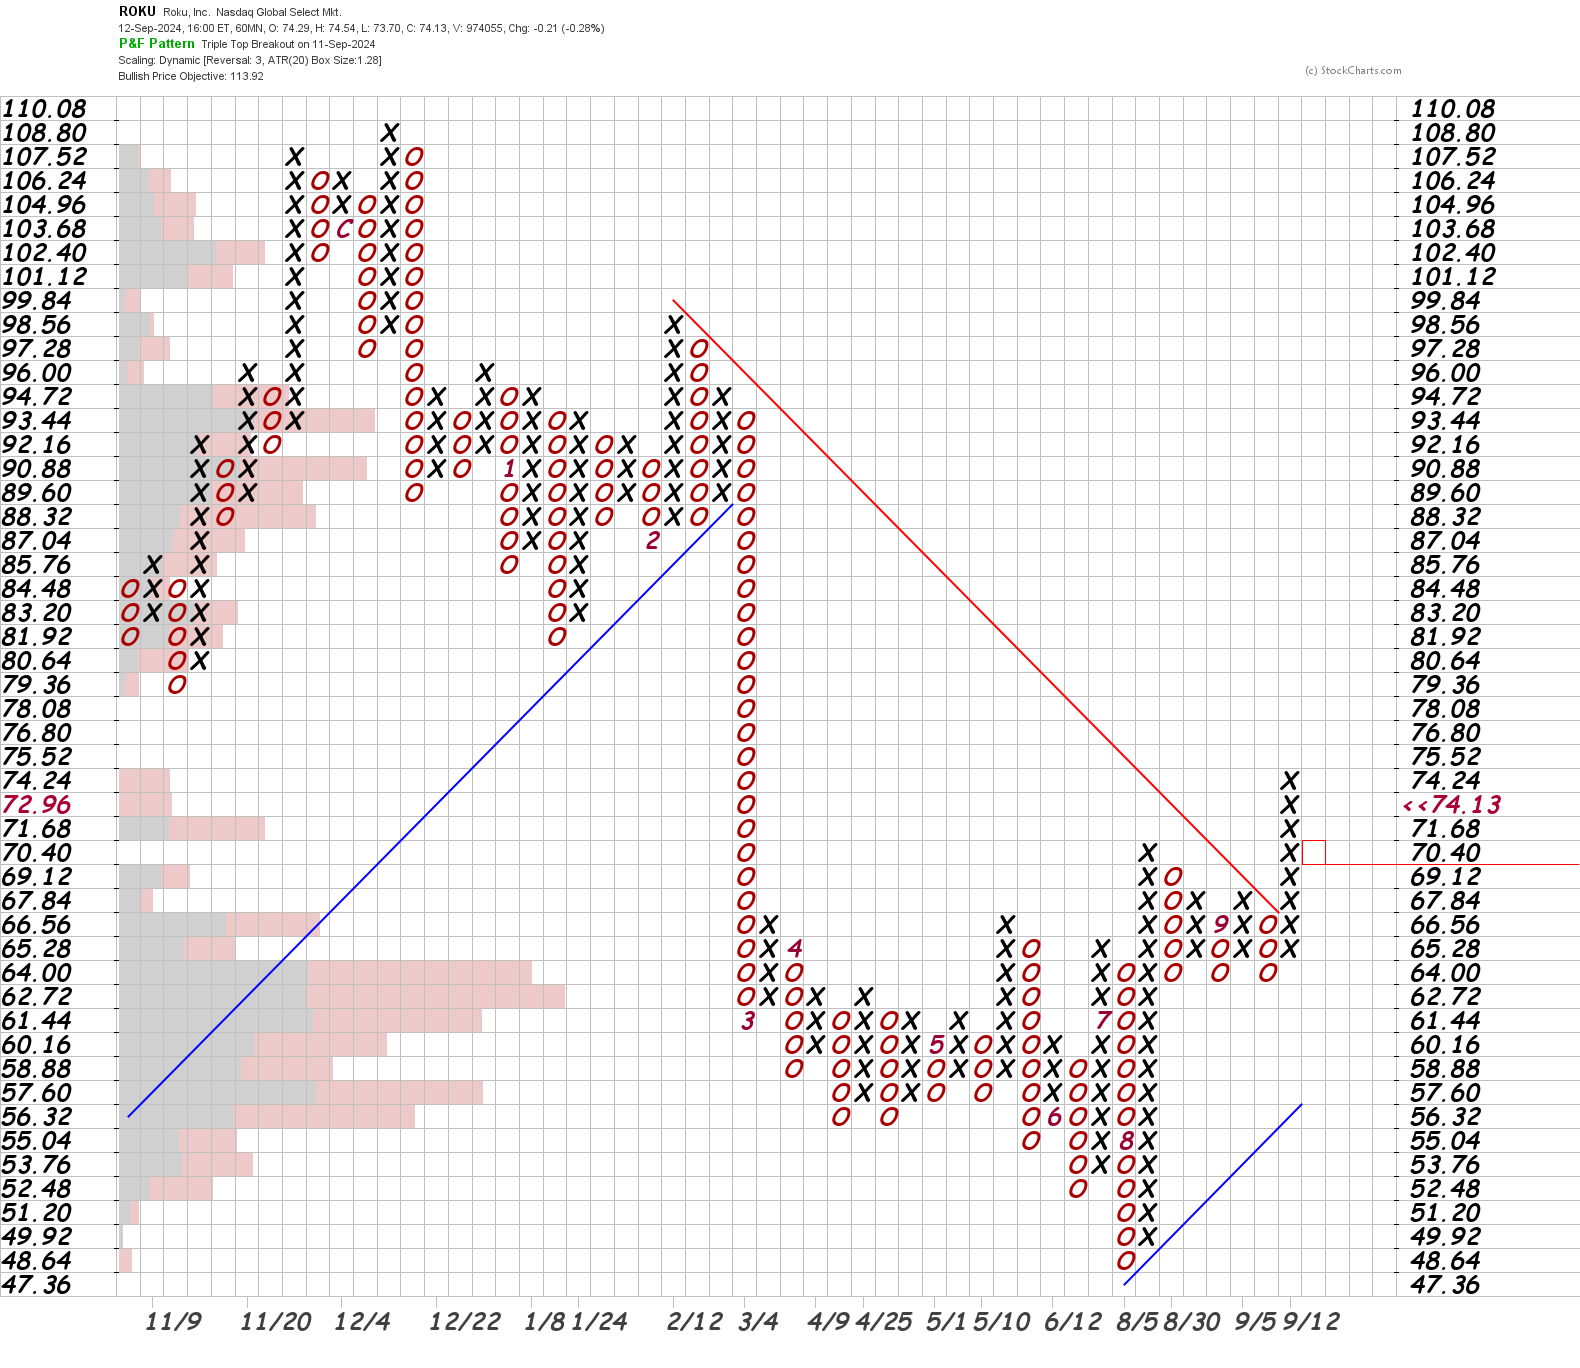
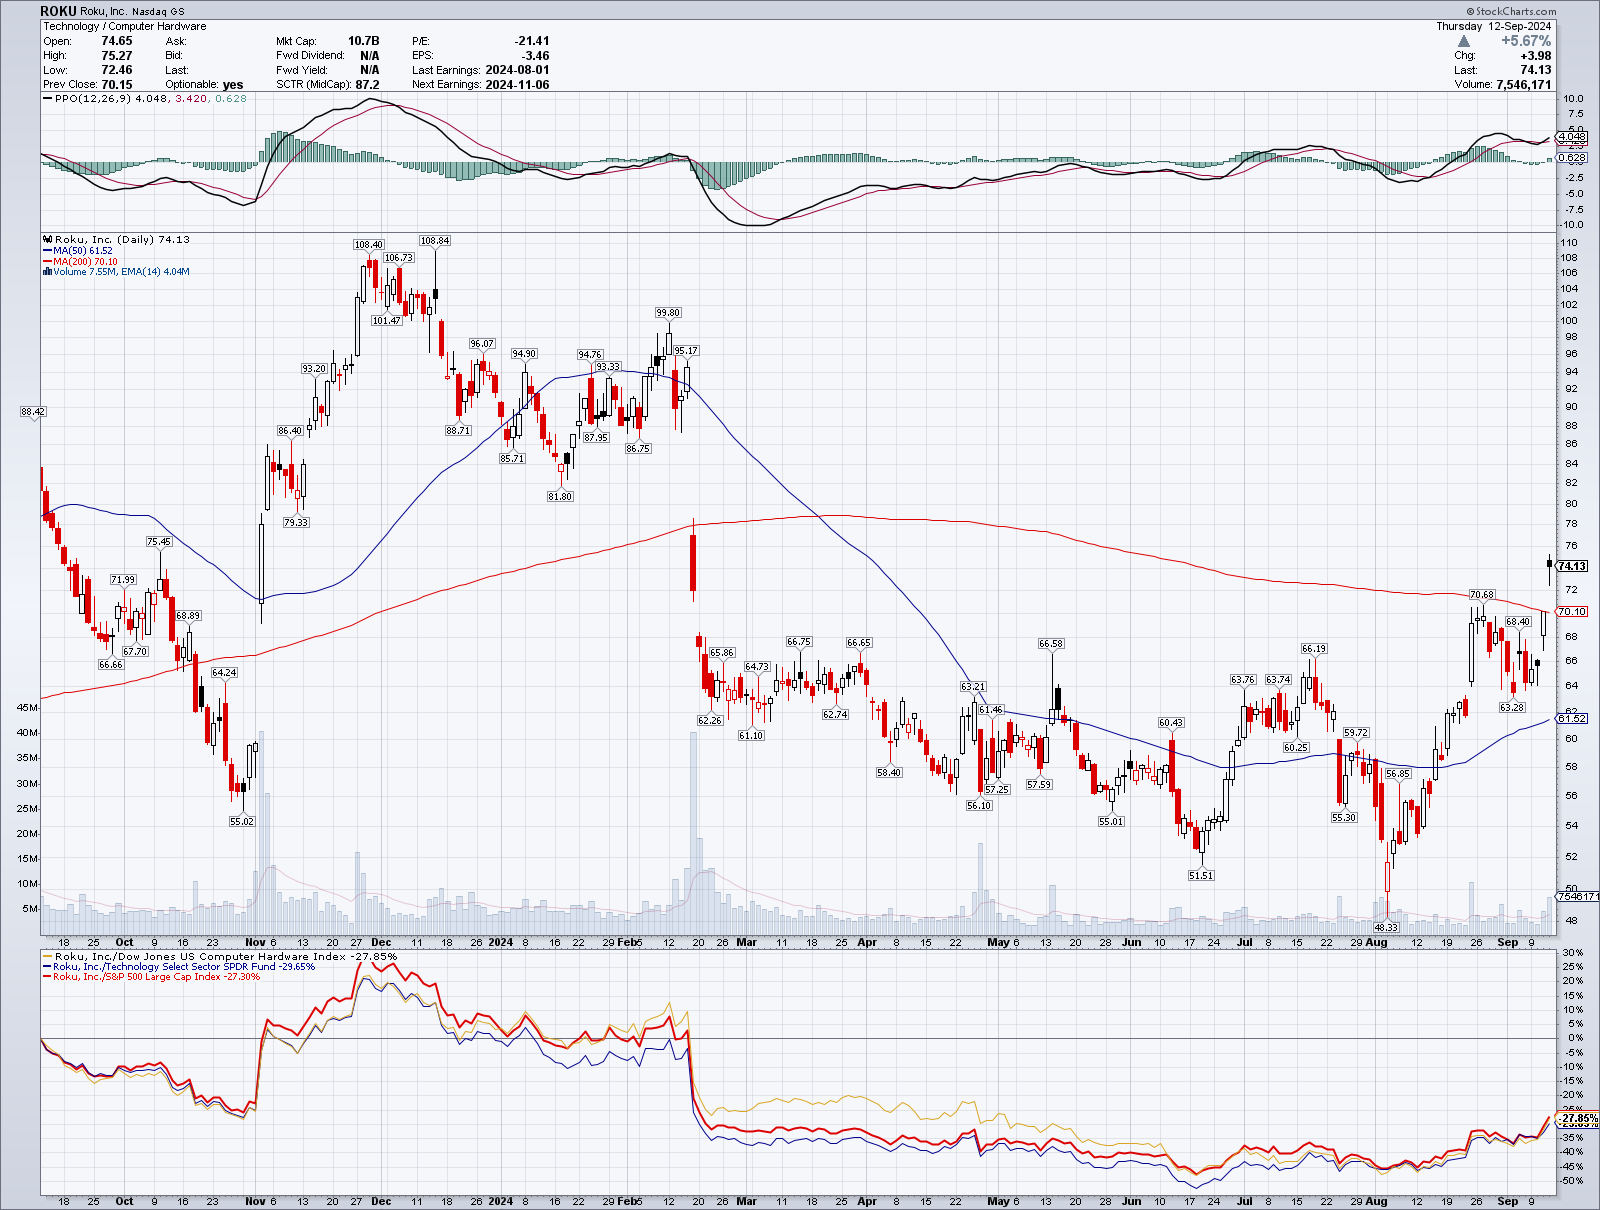
ROKU charts
The point and figure chart shows a clear, strong break of the downward trend line since February 2024. A triple top breakout began in September and the chart shows a price objective of just under $114. That feels a bit steep, but the calculation is based on the long consolidation that Roku has been doing since March 2024. The argument here is that since there's been a long consolidation with tightening price action, we should see a burst of movement in one direction or the other when one side finally gives up.
The candlestick chart argues for some caution here as ROKU hopped over the 200 day moving average yesterday with a decent gap up. Watch out for a potential island reversal here where price goes up on a gap, wanders around a little, and then gaps back down. (This surprised a lot of people recently on IWM.)
Another thing to note is that the 50 day moving average remains well below the 200. I would prefer to see the 50 cross above the 200 before making any bets here. The relative strength is gradually improving, but it still remains low relative to this year's price action.
FLNC
The last one here is an interesting one. Fluence Inc provides energy storage capabilities for solar farms, datacenters, and other uses. It's part of Siemens.
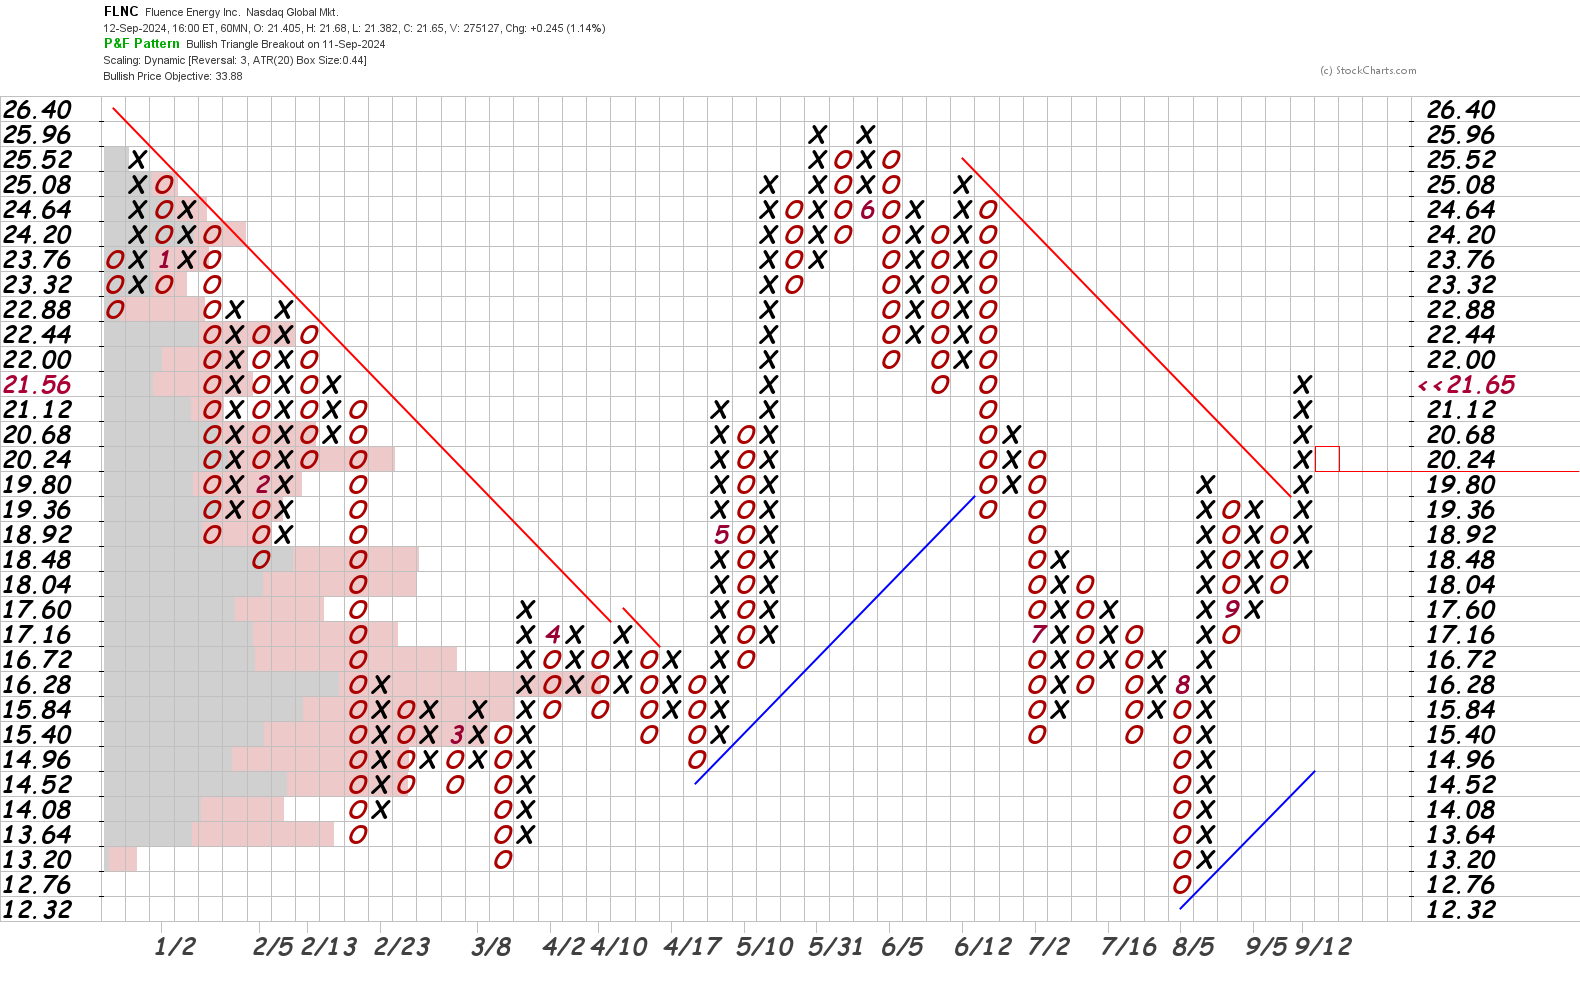
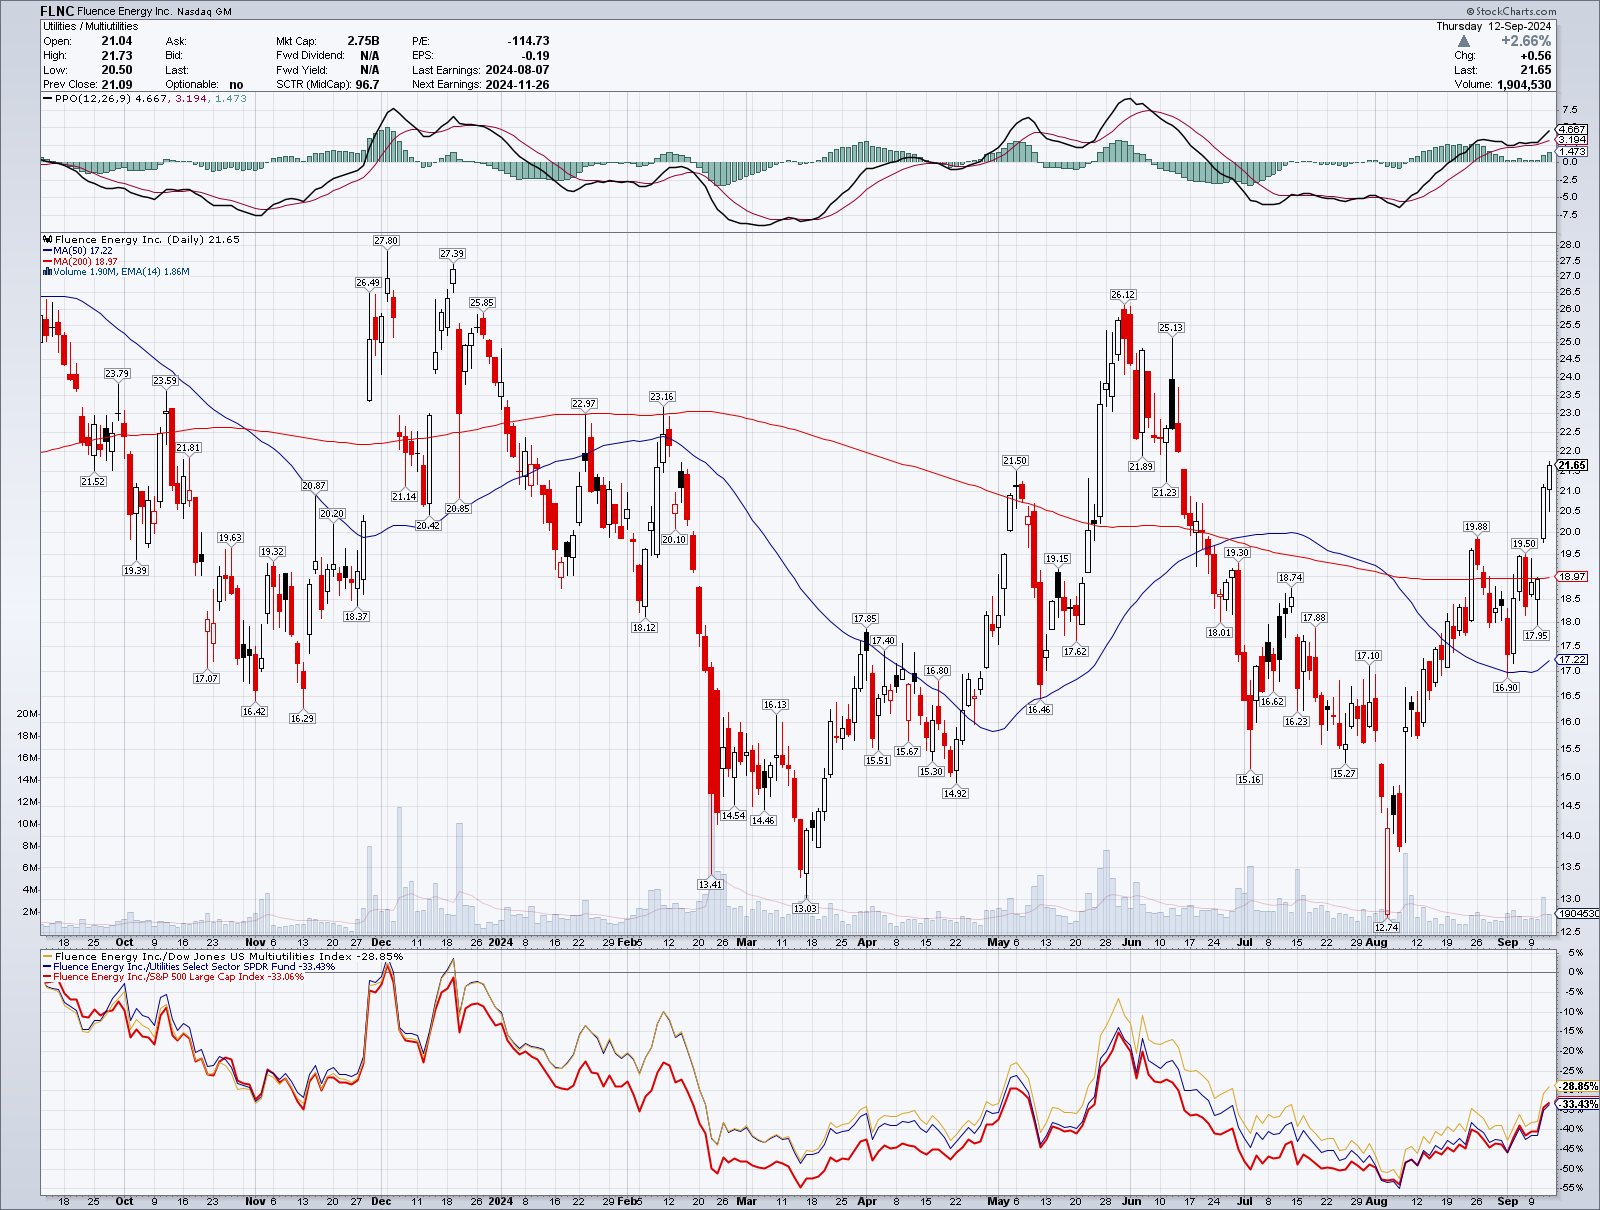
FLNC charts
This is an excellent example of why I love point and figure charts for reducing noise. You can easily see how FLNC trended down until April, then made a rounded top in June, followed by a run back to new lows in August during the market dip. Since then, it held its bullish trend line and broke the bearish trend line with authority. The current price objective is just under $34.
The candlestick chart is quite messy, but I see a 200 day moving average that is flattening and a 50 day moving average that is turning upwards. The PPO recently tested the signal line and then bounced higher. Relative strength is improving equally across the industry, sector, and the index.
This is going on my "wait and see" list. It has a promising look to it, but the risk is too high to jump into it right now. I'd like to see:
- The 50MA cross above the 200MA
- Relative strength to the index should cross above the June highs
- PPO should remain above the signal line and above zero
I'll revisit it if those things come together.
Conclusion
Writing scans and reviewing stocks that meet your criteria is a great way to discover new stocks to trade while also avoiding "chasing" stocks that don't meet your requirements. Scans bring the trades to me and keep me focused on the right charts.
Sometimes the charts have that "ready to go" setup and I can jump on the trend. Other charts give me pause and I set price alerts for when I want to revisit the chart.
I'm still working on my trading psychology every week. Someone recommended a new book for me called Never Split the Difference: Negotiating as if Your Life Depended on It and it's been quite good so far. I've probably made more highlights in this book than any other book. Although it's not about trading specifically, it's definitely a book that makes you question how you approach people when the situation gets tricky.
Good luck to everyone today and have a great weekend! 🍀
Discussion