SPY analysis for January 16

It's a big week in the market! Volatility expiration is tomorrow followed by Friday's OPEX. Let's analyze the risk on a potential SPY trade.

Tomorrow is the VIX expiration date and those days can get a little wild in the market. Most of the folks on Twitter who analyze options flow say that we should get some decent flows into January 17 or 19, but there are plenty of question marks after that.
SPY is sitting at all time highs after a massive rally from the October lows. That would put any chart into some territory where estimating risk gets difficult. As I wrote over the weekend, technical analysis is helpful for analyzing risk, not for predicting the future.
All investments come with significant risks, including the loss of all capital. Please do your own research before investing, and never risk more than you are willing to lose. I hold no certifications or registrations with any financial entity.
Let's break down some charts and plan some bets.
Wide view
Be sure to watch Ciovacco Capital's excellent overview of the markets weekly. Here's last week's video:
On the long term, SPY's rally has lost some steam:
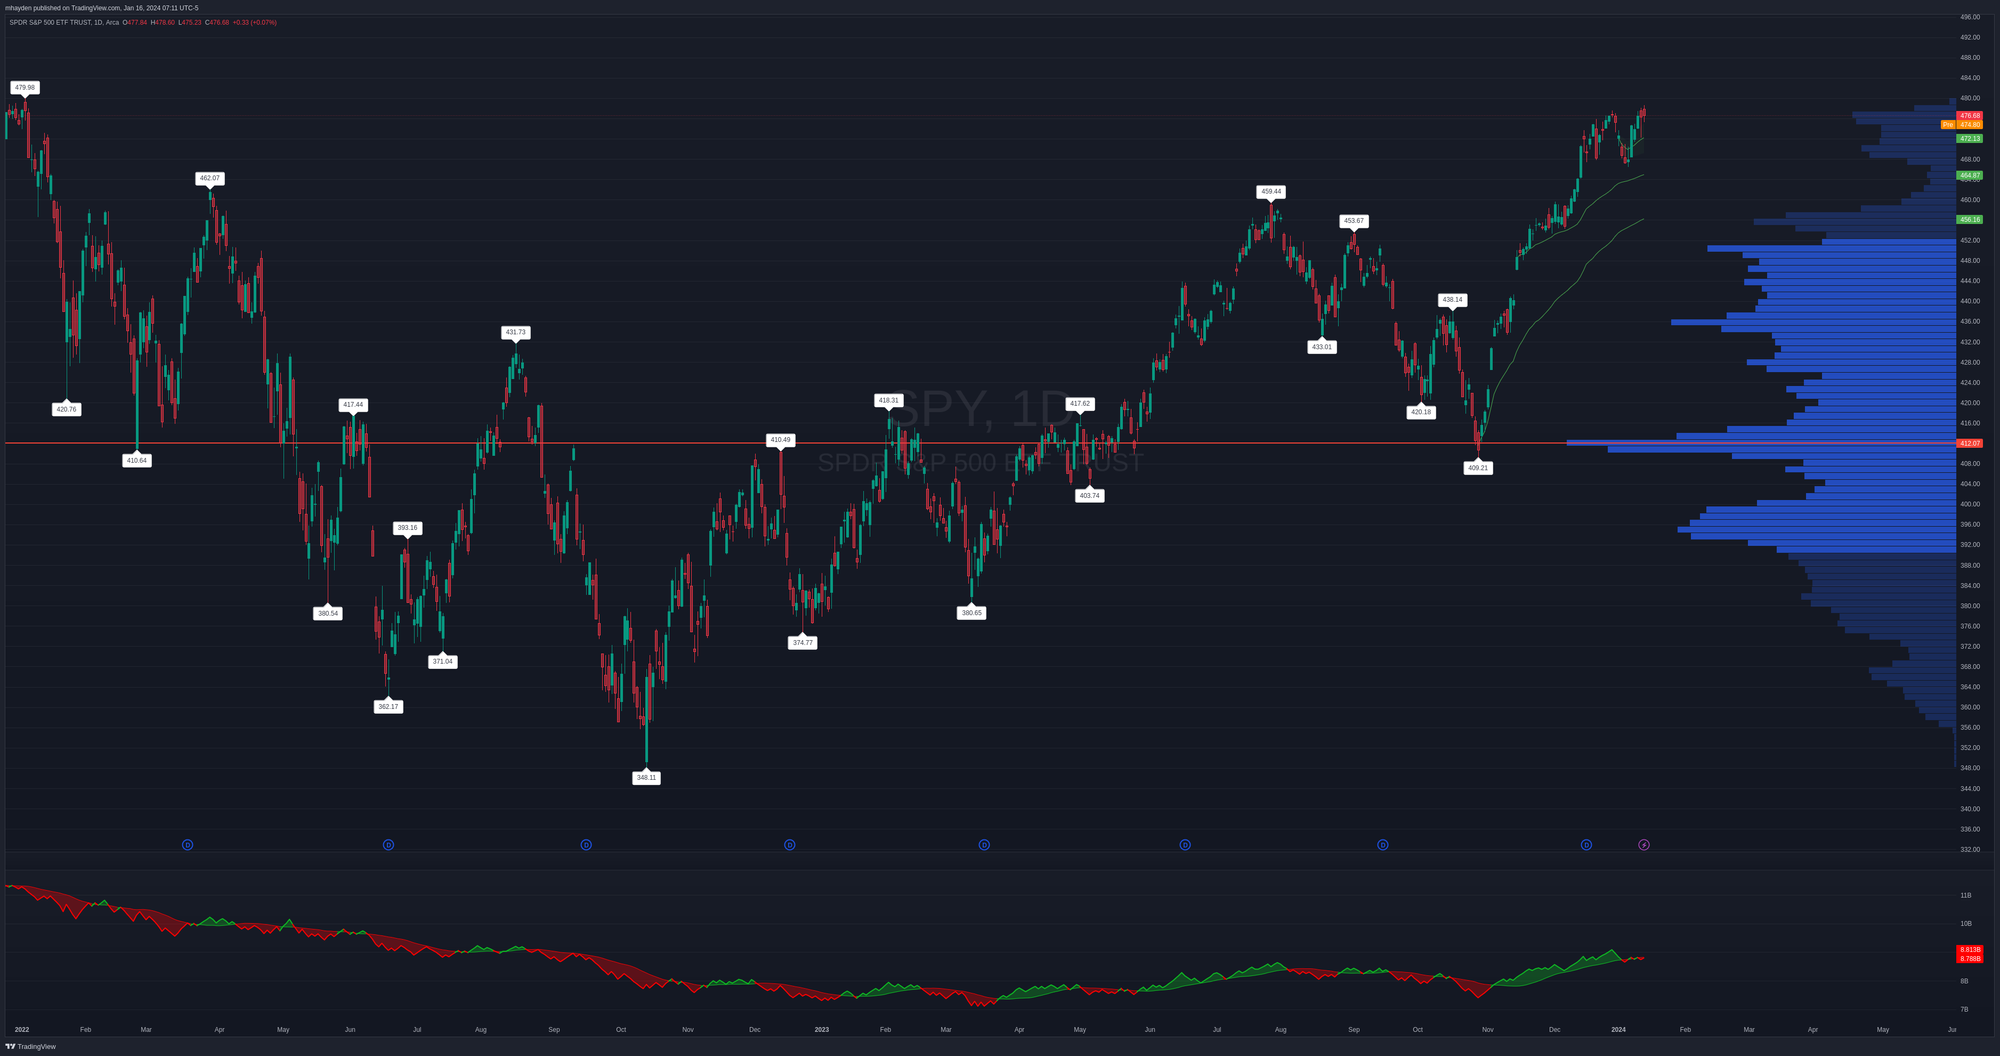
The majority of the volume since the last all time high sits around $412 and that's 13.5% below where we sit now. The on balance volume indicator at the bottom shows plenty of green as bullish volume led the way since October, but volume hasn't made a big move off the moving average this year.
Since the lows
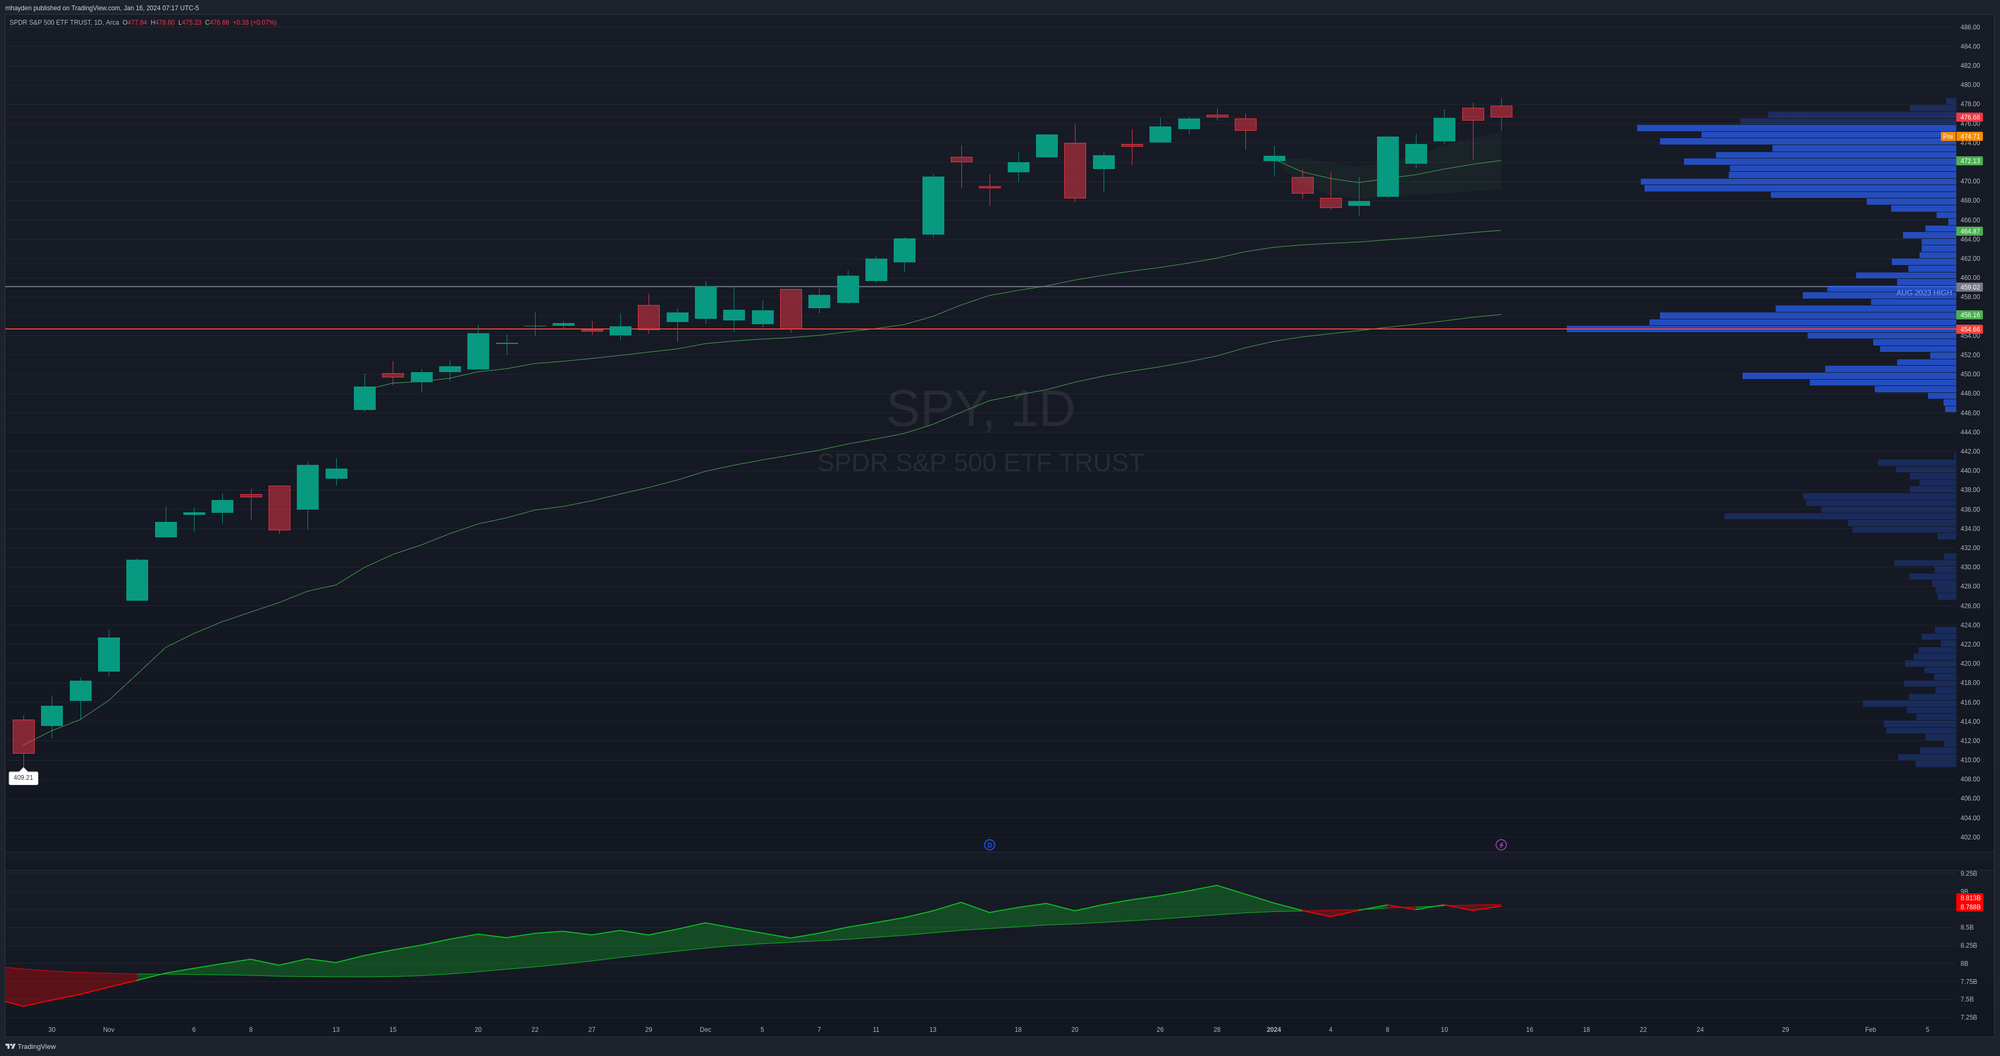
SPY's price action since the October 2023 lows shows a good consolidation around $450-$460 on that long run. That's a good level to watch if SPY decides to make a move down.
Here are the levels I am watching closely to the downside:
- YTD VWAP: $472.13 (1.19% down)
- August 2023 highs: $459.02 (3.68% down)
- VWAP from October's lows: $456.16 (4.31% down)
- Highest volume: $454.66 (4.63% down)
How about the Magnificent 7?
Most of the recent rally came from a huge run in the biggest names in the SPX index. These include big names such as MSFT and AAPL. We can compare SPY to RSP, which is the equal weight SPX ETF. SPY weights all stocks based on their market cap, so larger companies get a bigger exposure in SPY.
In RSP, MSFT and ETSY would get the same weight.
We can compare SPY to RSP over time and the weekly chart appears below. A move higher on this chart means SPY is gaining on RSP and it suggests that SPY's biggest companies are fueling the rally. A drop in this chart means that the largest stocks in SPY are lagging.
The SPY/RSP relationship ran up to the 3x range right after the COVID drop and held there for a while. It slid down until January 2023 when SPY began leading RSP again. That relationship ran up to 3.13x until November 2023 when it began sliding again.
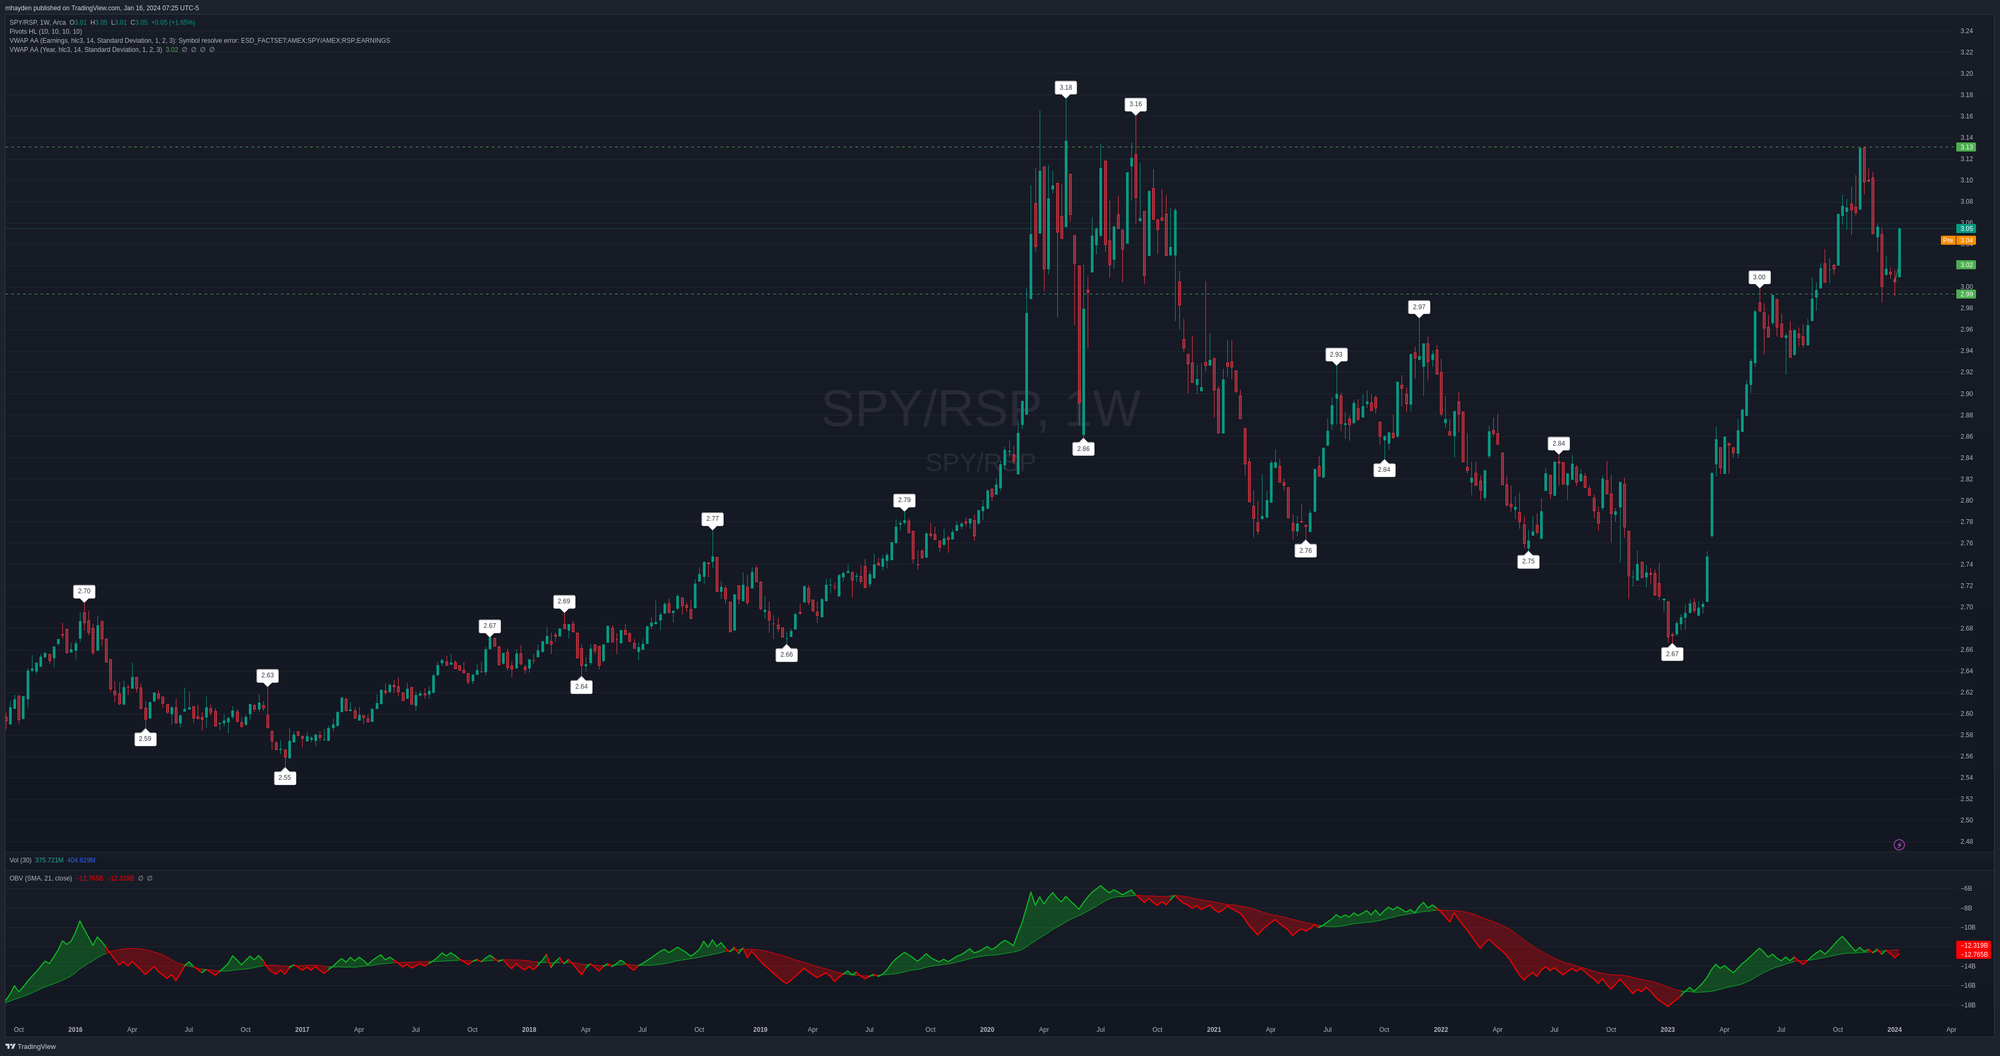
What does this tell us? It suggests that SPY's biggest stocks are again outrunning the breadth of the index again to levels where SPY struggled to keep going in the past.
Does this mean SPY is headed down? Not necessarily, but this is another data point highlighting the market's indecisiveness right now.
Market breadth
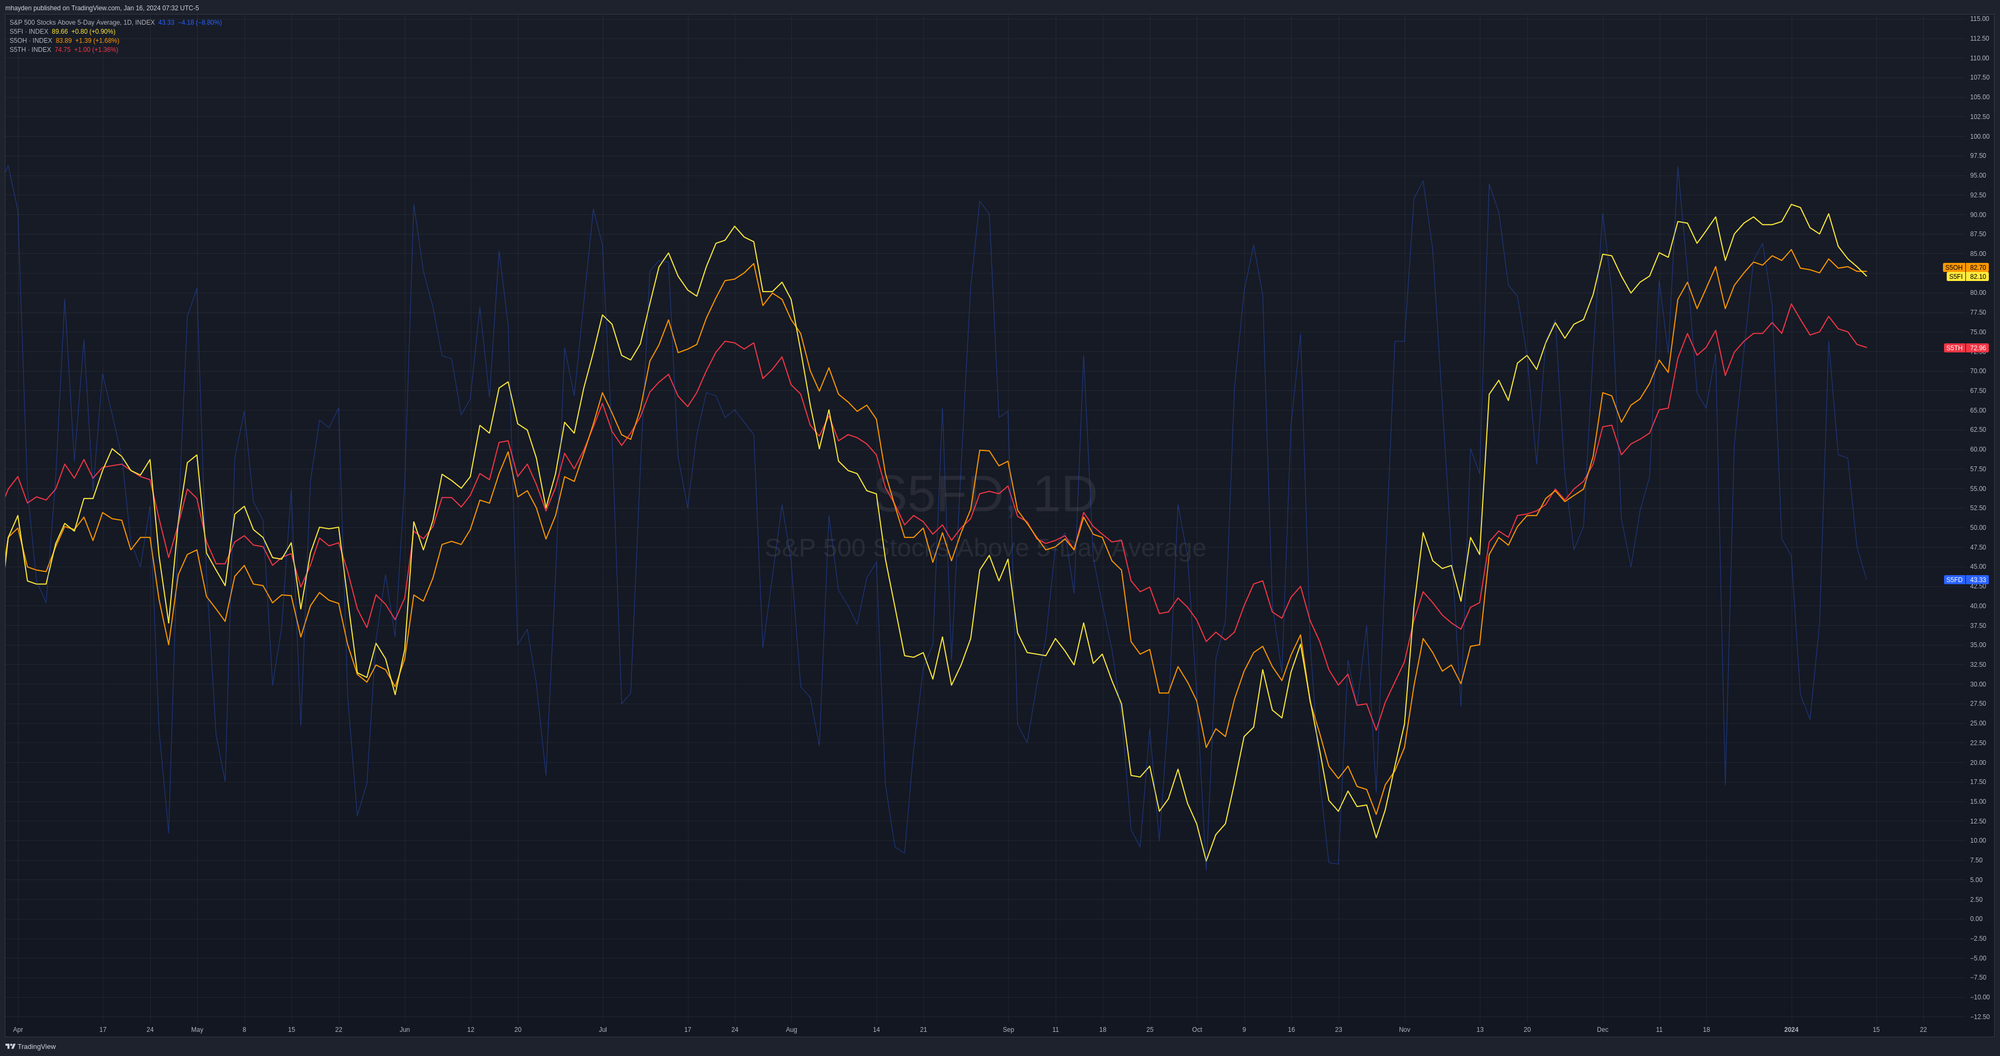
We can look at the market breadth of SPX stocks by seeing where stocks are relative to their moving averages. In the chart below, each line represents how many stocks in the S&P 500 are above a particular moving average
- Blue: 5 day MA
- Yellow: 50MA
- Orange: 100MA
- Red: 200MA
I like to see the lines stacked properly (50 above 100, 100 above 200) and we had that recently starting the first week of November 2023. However, these lines started turning back down recently and the 50 crossed below the 100.
Does this suggest there's risk to the downside? Possibly. My interpretation here is that we're sitting at a consolidation or indecision point.
You can track this chart in TradingView by using my sharing link!
Thesis
We have tons of conflicting information here that makes assessing risk difficult:
- Weakening volume to support a move up
- Many charts, including SPY, are showing a double top formation (which is bearish)
- SPY is holding above multiple VWAP lines, which is bullish, but it's also approaching uncharted territory around the all time high
I pulled back most of my long trades on Friday not because I'm bearish, but I couldn't find a trade worth making with this much indecision at play. I'd really like to see some volume matching a move this week, but I worry that the VIX expiration tomorrow and OPEX on Friday could make that challenging.
AMD and AAPL have the most interesting charts for me this week. AAPL is sitting at some interesting support levels and AMD looks like it rejected a potential double top. However, AAPL did the same thing recently before sliding down to a support level. I don't have any trade ideas for these yet but I plan to see what the market might give me on those two.
Good luck to all of you today! 🍀
Discussion