Is SPY about to give back everything since May?

SPY seems poised to give back all of its gains since May. Will it happen? And where do we go after that if it happens? 🤔

Good morning! That title isn't meant to scare anyone, but it's meant to ask a real question: Is there a potential for SPY to return to May 2023 levels?
TL;DR: Yes, it's within reach now for sure. But let's dig into the data to give ourselves a better edge.
All investments come with significant risks, including the loss of all capital. Please do your own research before investing, and never risk more than you are willing to lose. I hold no certifications or registrations with any financial entity.
Let's dig up some data and build a thesis. 🤔
Chart
Let's start with a chart of where the S&P 500 futures are sitting this morning:
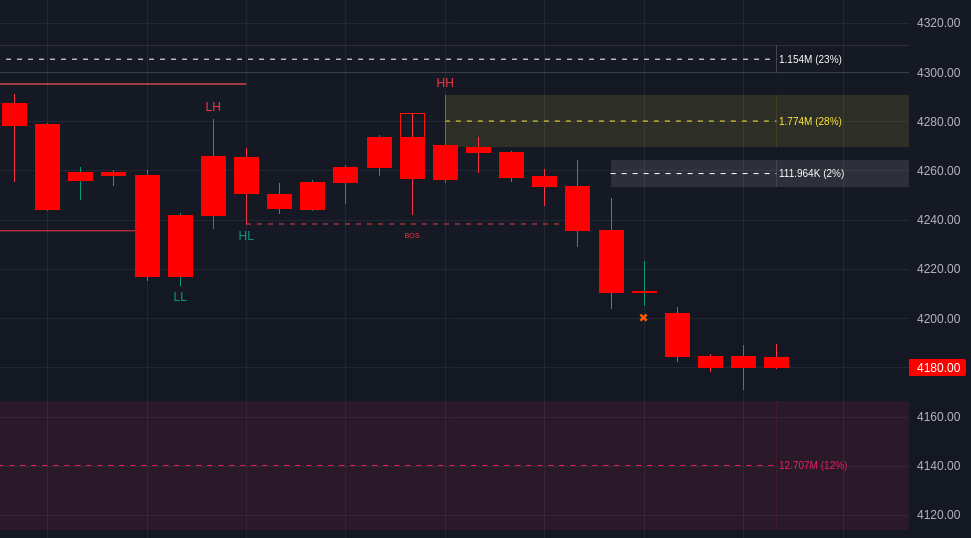
We're underneath two order blocks in the upper 4200's, but that order block down below is the one that is most interesting here. On my chart, white order blocks are on the 1 hour time frame, gold ones are on the 4 hour, and pink ones are on the daily.
There's a large order block there from around 4110 to 4170. That's a pretty wide range and it shows up with 12%, which means it's likely going to have an effect on price. As a reminder, price can do weird things near order blocks and it's a good place to watch for a new trend.
Let's zoom out a bit and include daily bars going back to May 2023:

That pink order block extends all the way back to May 24. If you remember what was happening back then, we had an explosion in AI hype among lots of stocks, including some that you wouldn't associate with AI. There was also a feeling that the Fed was done raising interest rates and that inflation was largely getting under control.
Well, a lot has happened since then.
So the question after that becomes: What if we lose that level in the 4100's? What comes after that?
There are VWAP lines coming up from the COVID highs and lows in the 3800-4000 range. They could potentially provide support and help with some consolidation. There's always a chance we shoot through those levels, too.
Let's find some other data to see if we can figure out what other traders are doing.
Vanna
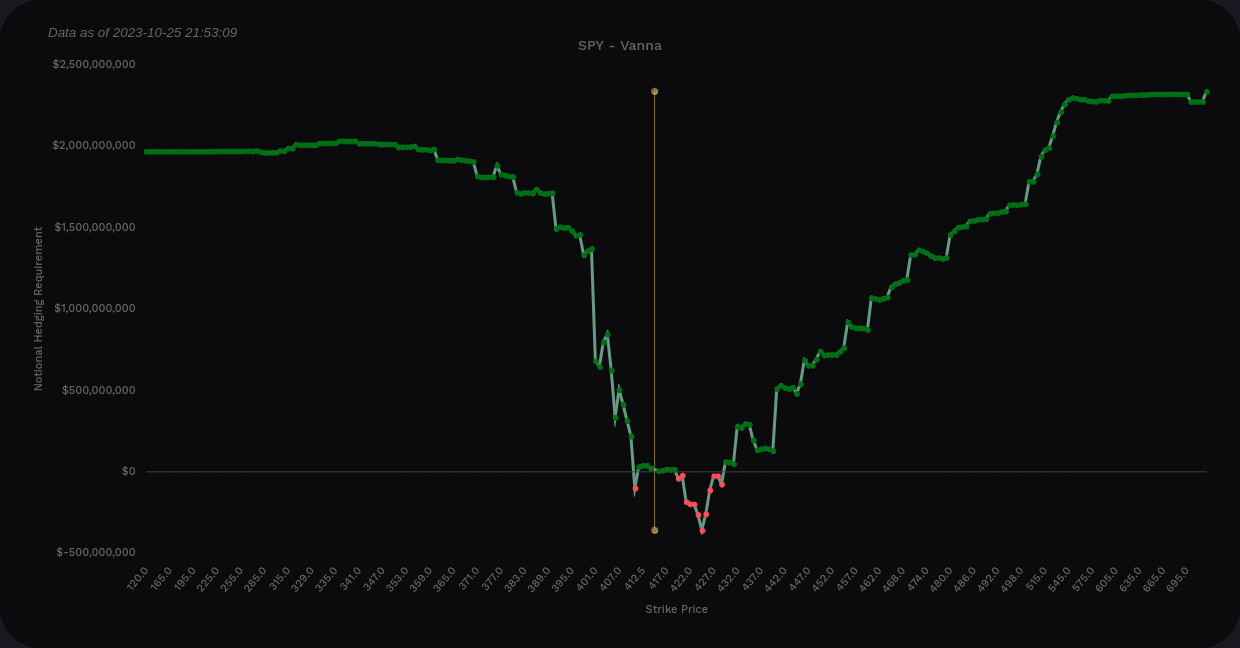
First up is vanna for SPX. The curve shows that we're mostly positive on vanna at the extremes and that suggests bullish price action in an environment where implied volatility (IV) is coming down. This is bearish if the VIX continues to climb.
I always look for the biggest outliers in the bar chart and wow, 4300 looks like a massive stop sign for progress to the upside. There's very little positive vanna above price outside of an optimistic small bar at 4400. However, there's so much negative vanna in between that I can ignore that level for my trades.
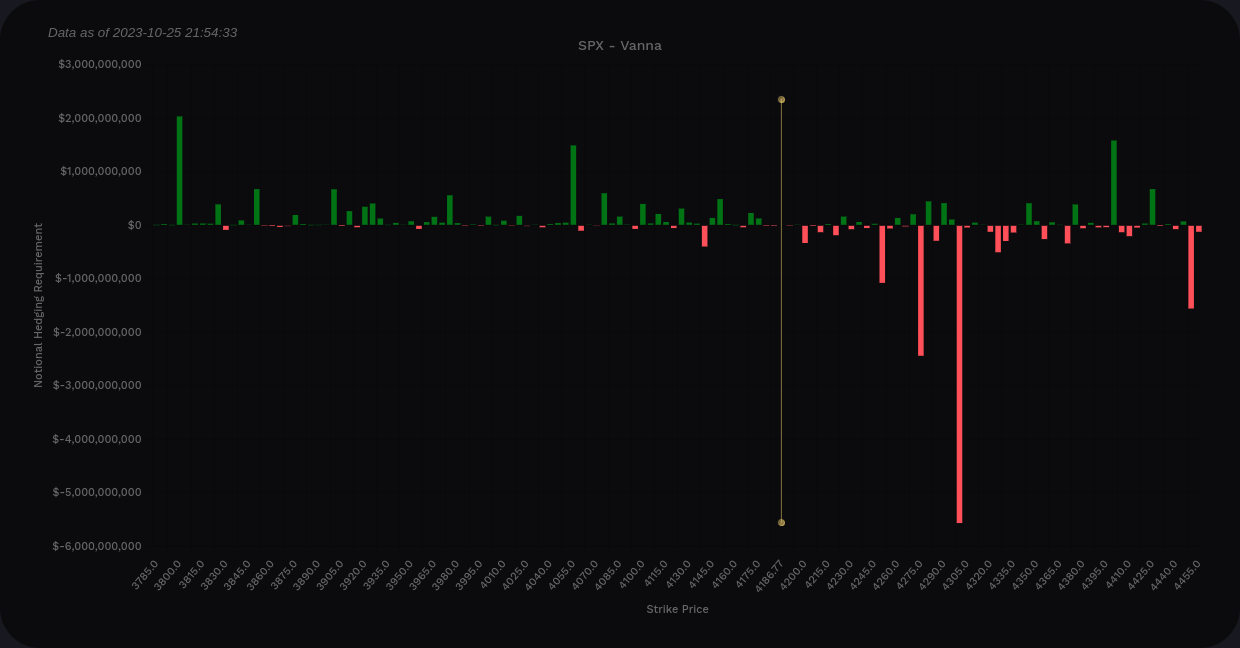
SPX vanna from volland
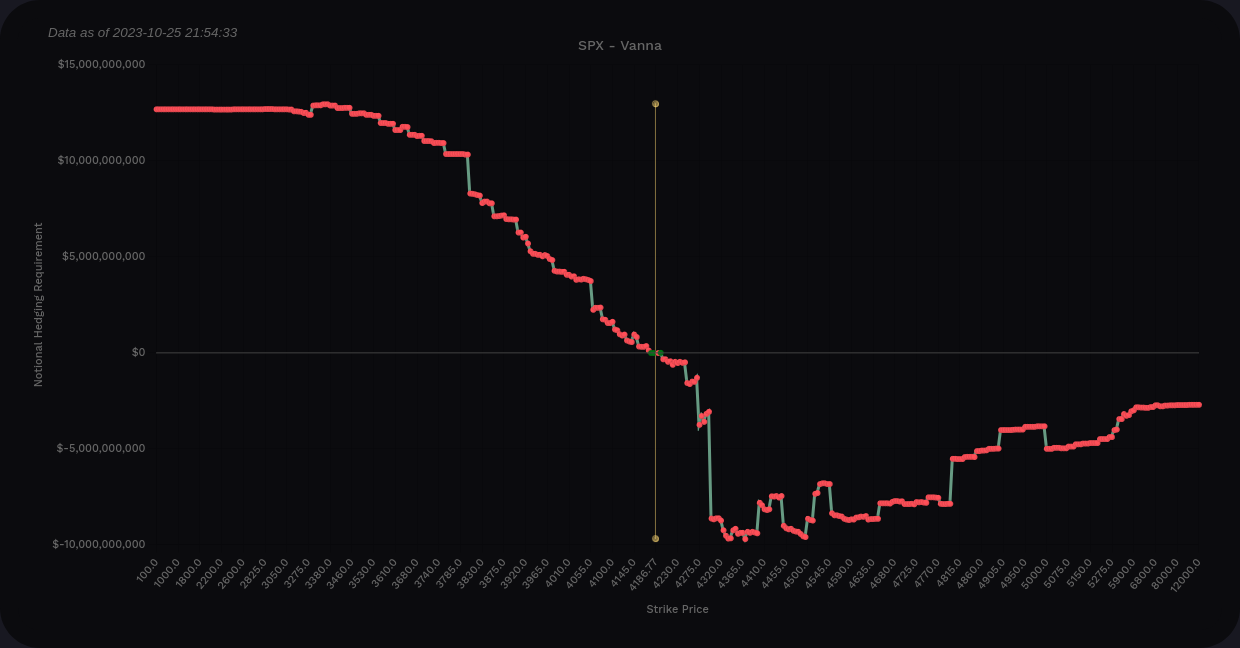
Where could we find some support if we head lower? That's where things get interesting. I've not seen SPX vanna this flat to the downside in a very long time. We had some massive bars at 4000, 4150, and 4210 recently and those have all come down drastically.
In any case, we appear to have two main levels of support from vanna here if IV increases. One is at 4055 and the other is at 3800. The 3800 level is pretty critical if you watch Ciovacco Capital's videos as that's where the COVID high and low VWAPs sit today.
Sometimes SPY and SPX have some important differences, so let's check SPY just to be thorough. First off, SPY's curve is much more positive overall than SPX.
Much like SPX, SPY shows optimism around 4400 as the tallest bar above the current price. 421 shows up as a resistance point to the upside. Support on the downside shows up at 410, 405, and then a big line at 400. Below that, there's some support at 390 and that's about it.
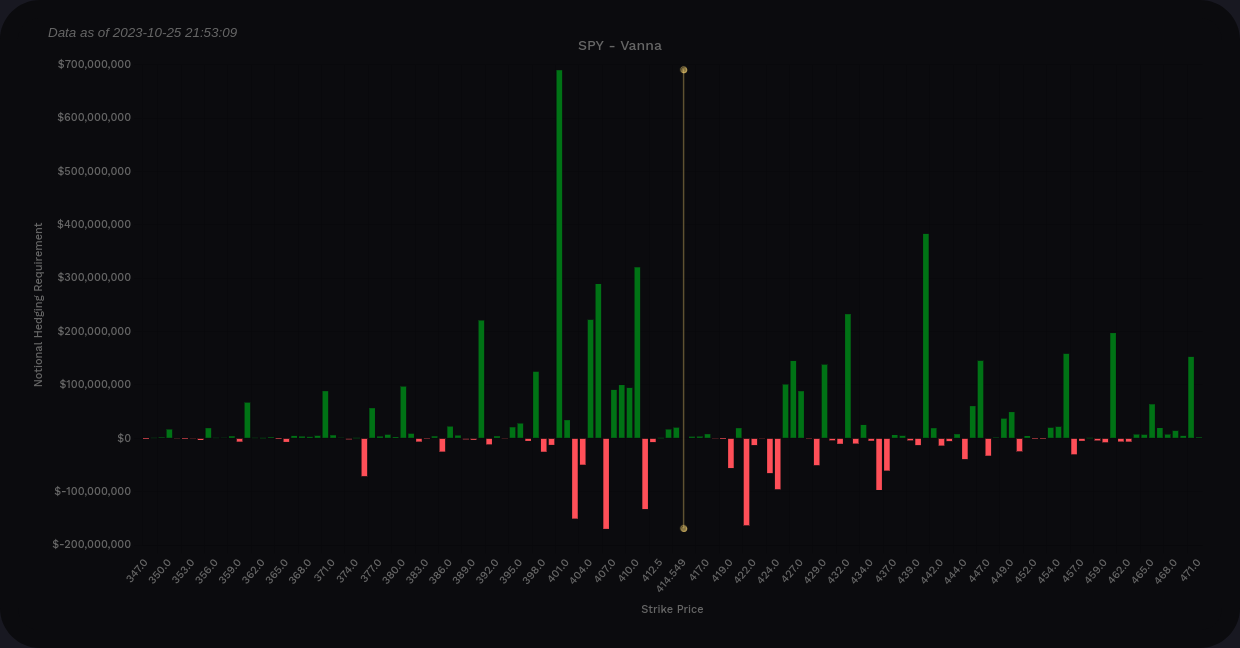
SPY vanna from volland
In summary, SPY looks a bit better on the vanna side than SPX, but SPX has some deeper support at lower levels. SPY is fairly quiet once you drop below 400.
Gamma
Volland's delta-adjusted gamma (DAG) adjusts the gamma bars above the price so that you can read the chart a little easier. Red bars are where dealers will likely sell to maintain their hedges and green bars are dealer buying zones. Here's the DAG for SPX and SPY:
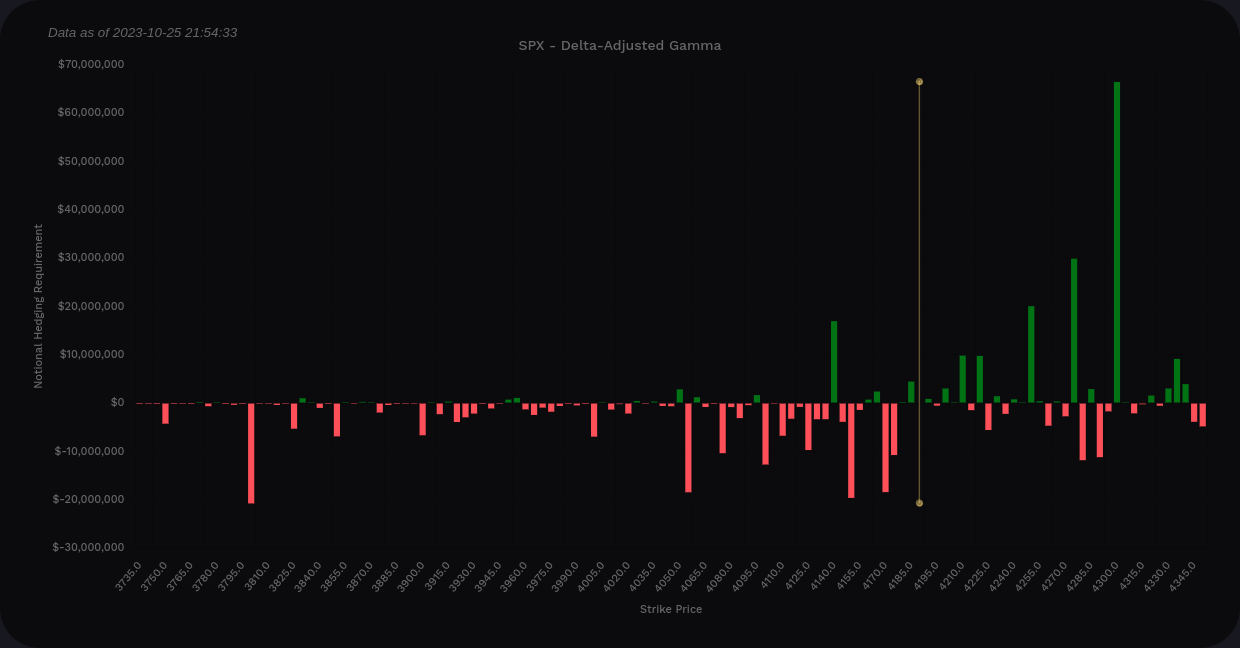
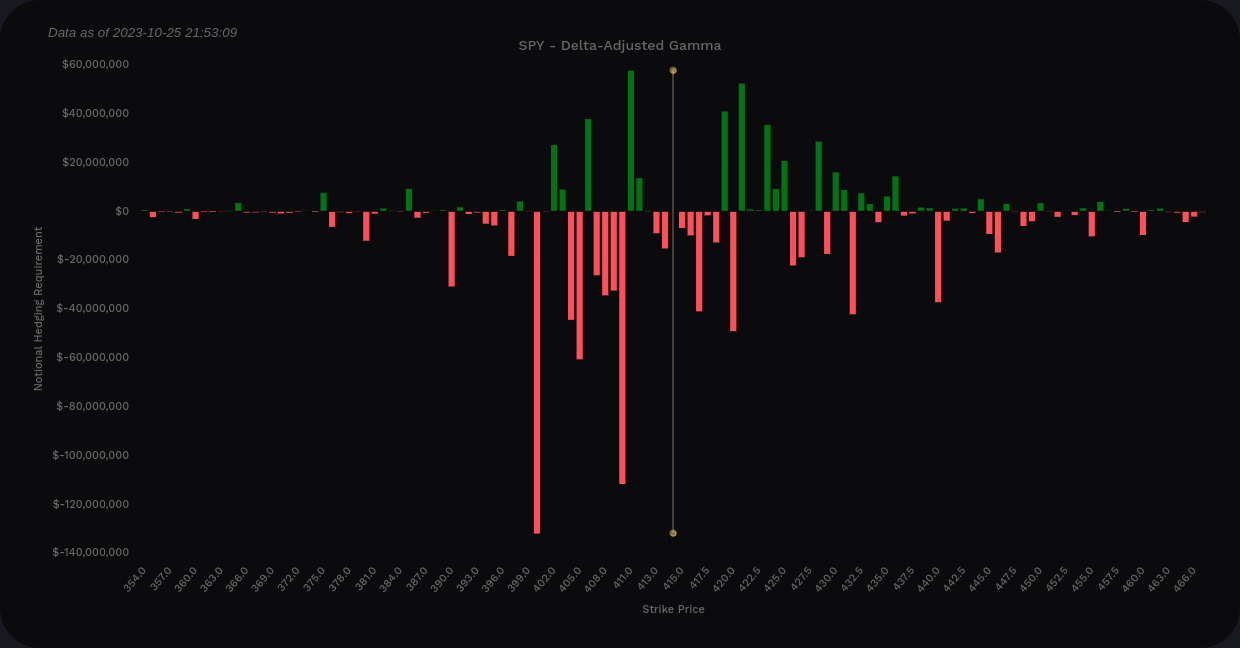
DAG for SPX (left) and SPY (right)
SPY shows mostly selling pressure below the current price with a few blips of buying at 411, 406, and 402. Those large negative bars so close to the positive ones generally cancel each other out.
SPX is mostly negative below the current price with only one lonely positive bar around 4150. Neither of these look bullish.
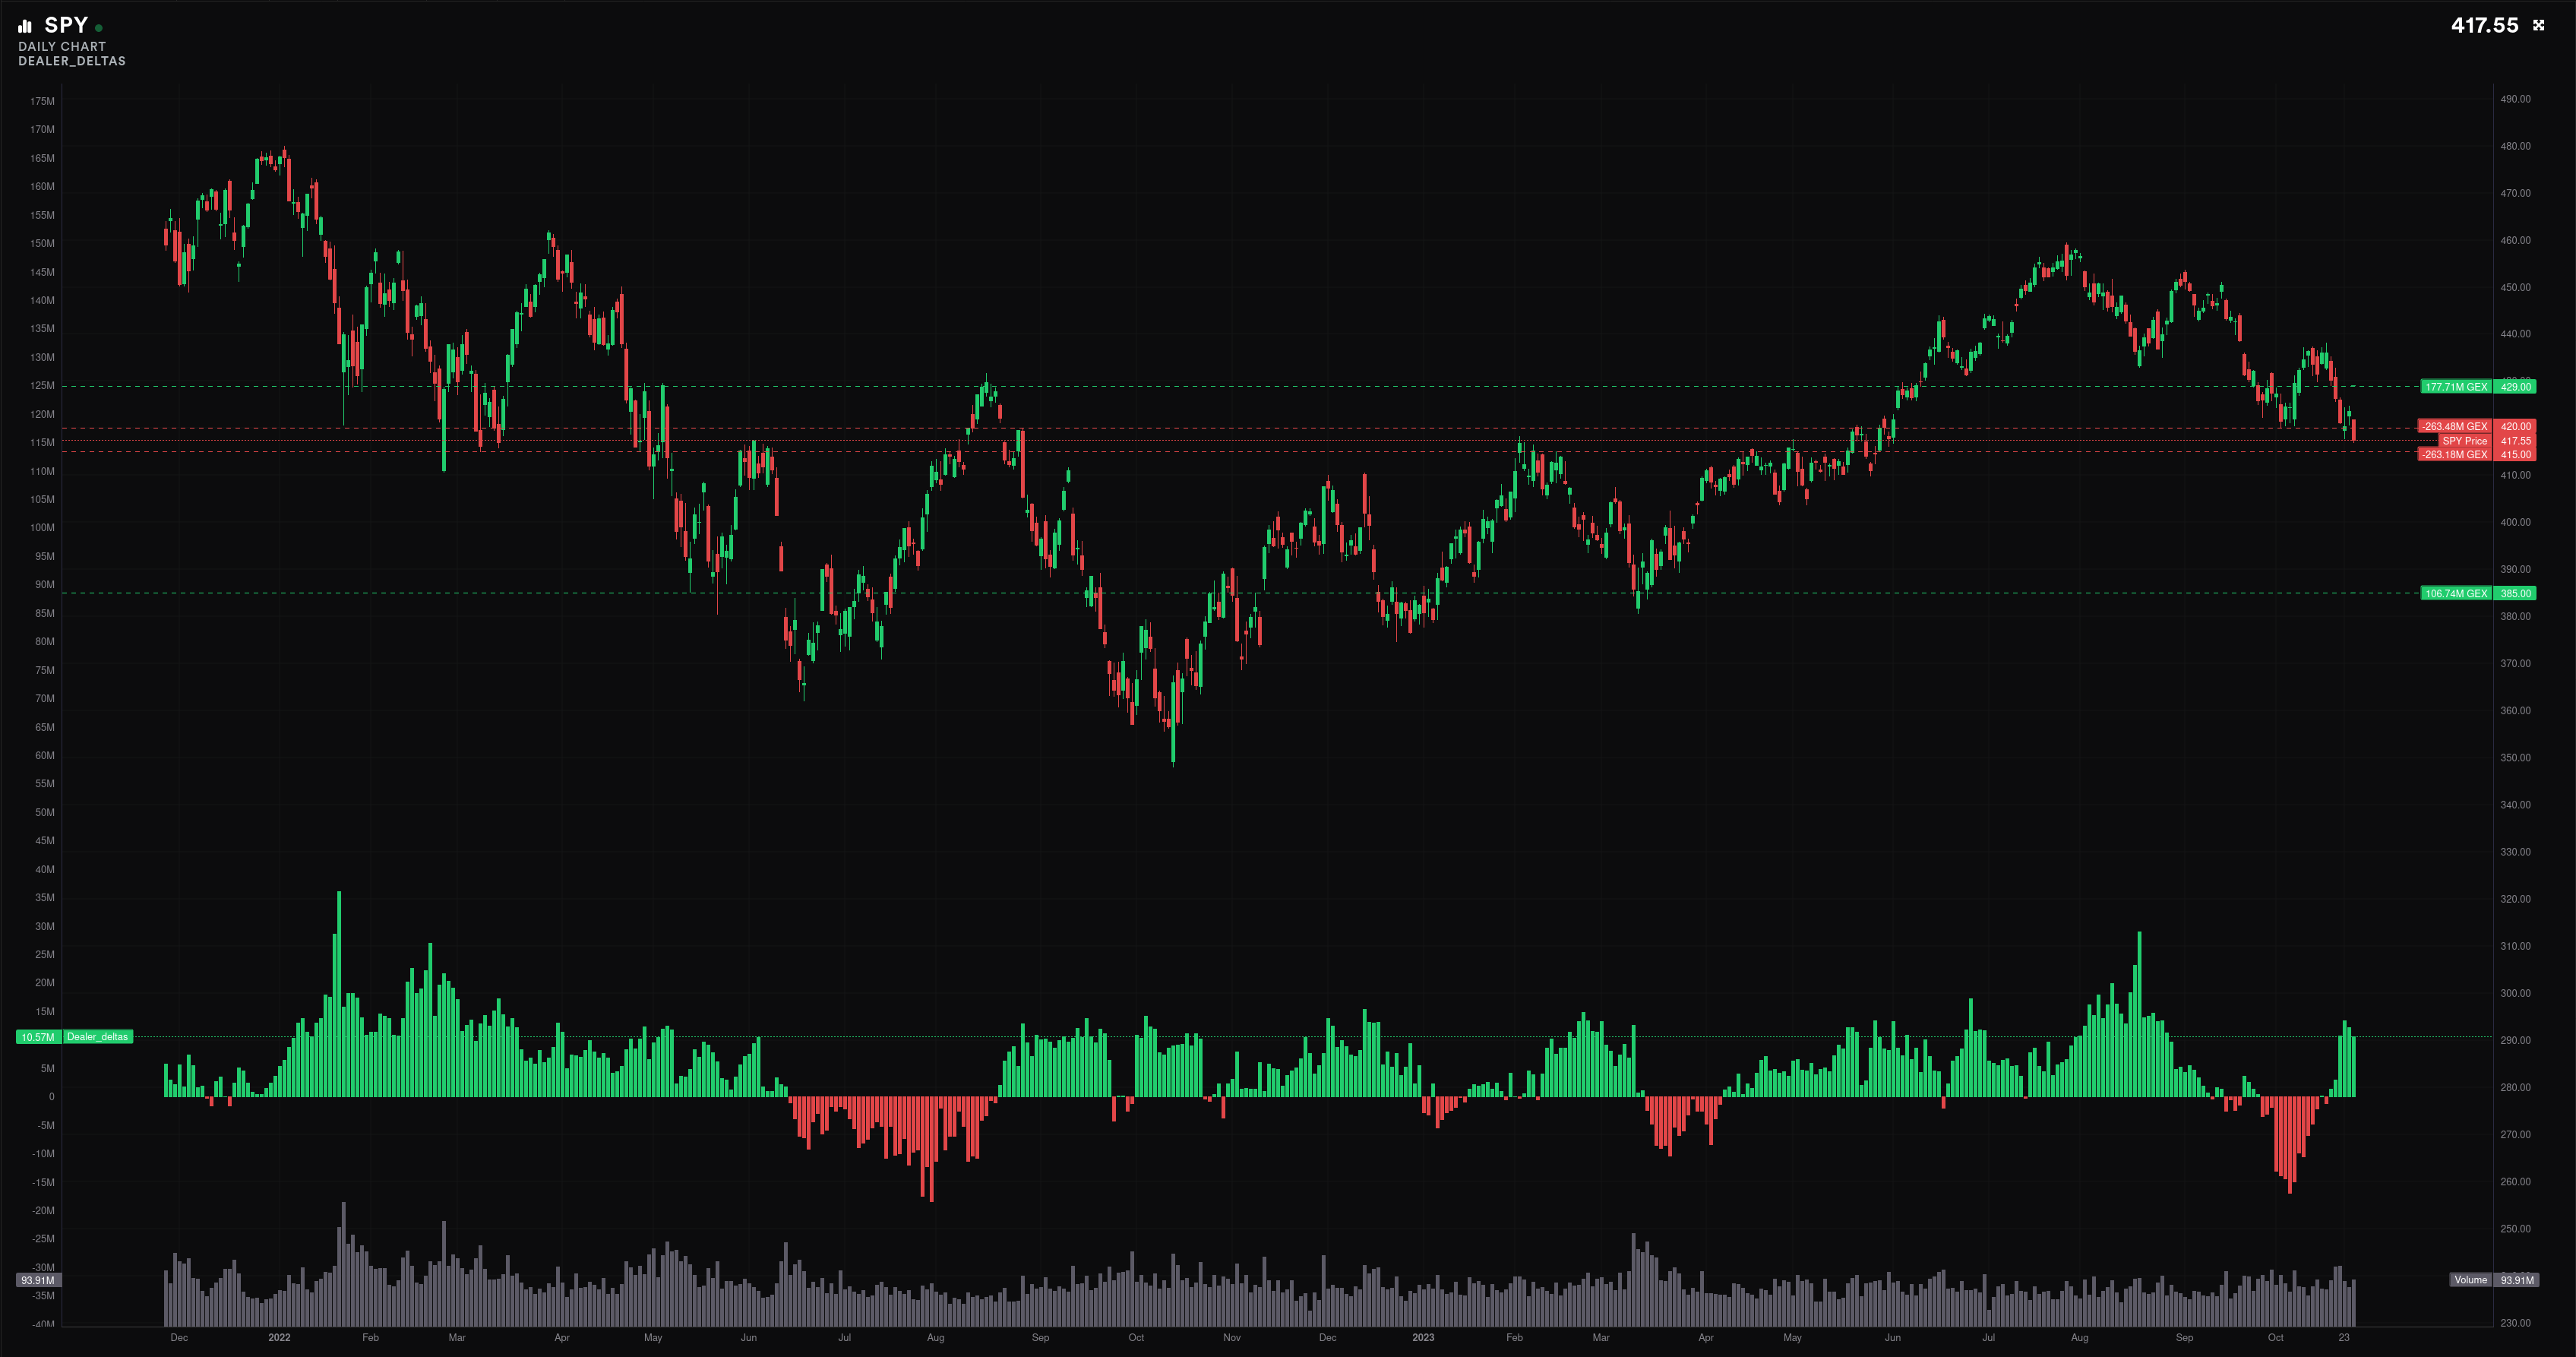
Dealer deltas
A quick trip over to Tradytics shows that their GEX lines have extended down to $385 for SPY. Dealers have gone incredibly long on SPY and that suggests customers are holding more short contracts. The huge peak in dealer deltas in August should have been a sign that price was about to move down, but I missed that one.
Thesis
A return trip to May 2023 levels seems entirely possible with all the data I can find. However, it's difficult to see where we go after that. Traders also seem to be thinking the same because they aren't making heavy bets in that area right now.
I'd love to see us make a consolidation level around the 4100's that would allow the market to get a read on inflation data and interest rates, but that feels optimistic. This really could be a trip to the 3800/3900 range to revisit those COVID VWAP lines.
I still have some bullish trades on the board that aren't looking great right now and the market has taught me another lesson about being optimistically bullish when the data starts to turn in another direction. My next move will likely be some fairly aggressive covered calls on any bullish pops along the route down. This allows me to reduce my cost basis a bit more and collect some theta while VIX still remains quite high.
Use caution around these times in the market. This is when many new traders turn to services or "gurus" that offer them unbelievable insights in the market for a monthly fee. Although some of these are good services, many of them exist solely to separate you from your money.
Good luck to everyone this week. I'll be back tomorrow with a vanna-rama for SPY, SPX, AMD, and TSLA. 🍀
Discussion