SPY and SPX deep dive for 10/23

Fear is rampant, but what does the data say? Let's find the levels to watch and be patient for the good trade setups. 👀

Happy Monday! Fear is definitely creeping up across the market, so I thought it would be a great time to dig up some SPY and SPX data. 🔎
All investments come with significant risks, including the loss of all capital. Please do your own research before investing, and never risk more than you are willing to lose. I hold no certifications or registrations with any financial entity.
Let's get right to it!
Options flow
Although Tradytics' overall market net flow doesn't specifically cover SPY and SPX, it's a really good look at the broad market and it often matches the index performance.
Most of the bearish bets here are more than 30 days out, but there is some bearishness on shorter time frames, too. The 30 DTE chart looks the best here, and I can only use the word best because bearish and bullish flow is equal. 😉
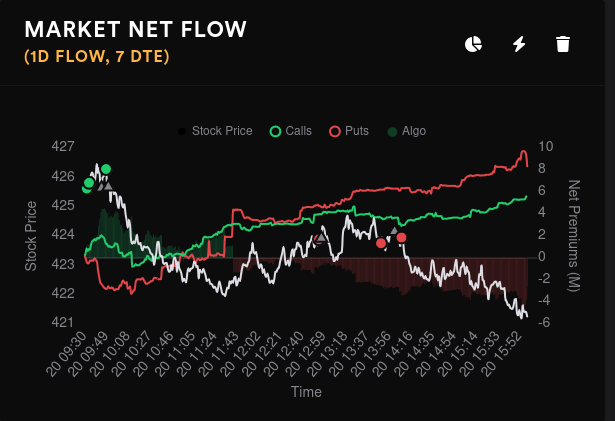
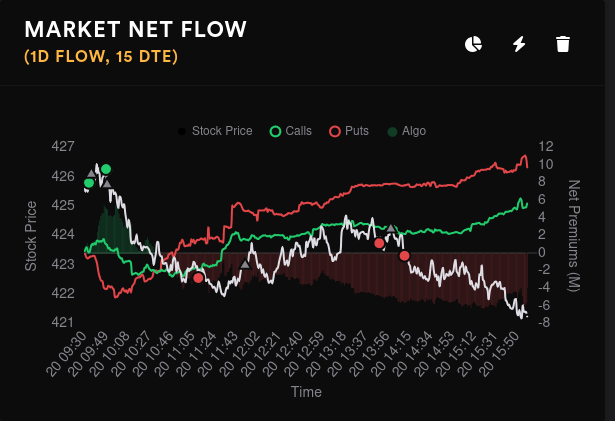
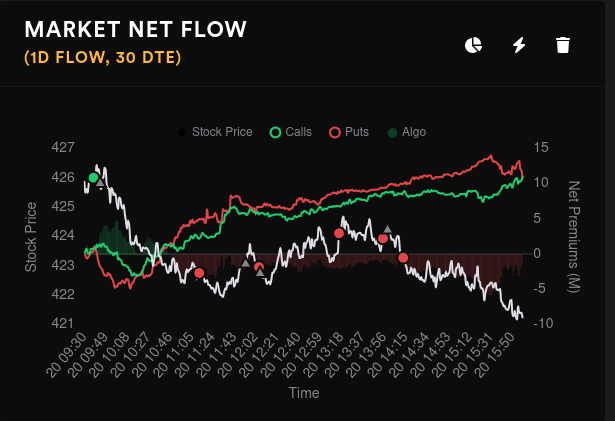
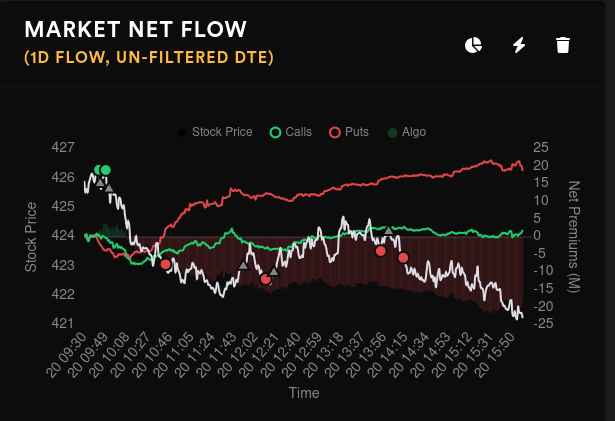
Market net flow across multiple time frames
Vanna
Just as a reminder, vanna measures changes in delta of options contracts when implied volatility (IV) changes. Positive vanna is generally bullish if IV is contracting. Look for more bearish news when we have expanding IV with positive vanna.
Let's get a look at SPY first. I like to read the curve chart first and we have an interesting setup here. Both extremes are quite positive, but we have lots of little negative dips scattered above and below the current price. These negative dips often neutralize a nearby positive bar. It also signals that traders really haven't decided what they want to do yet.
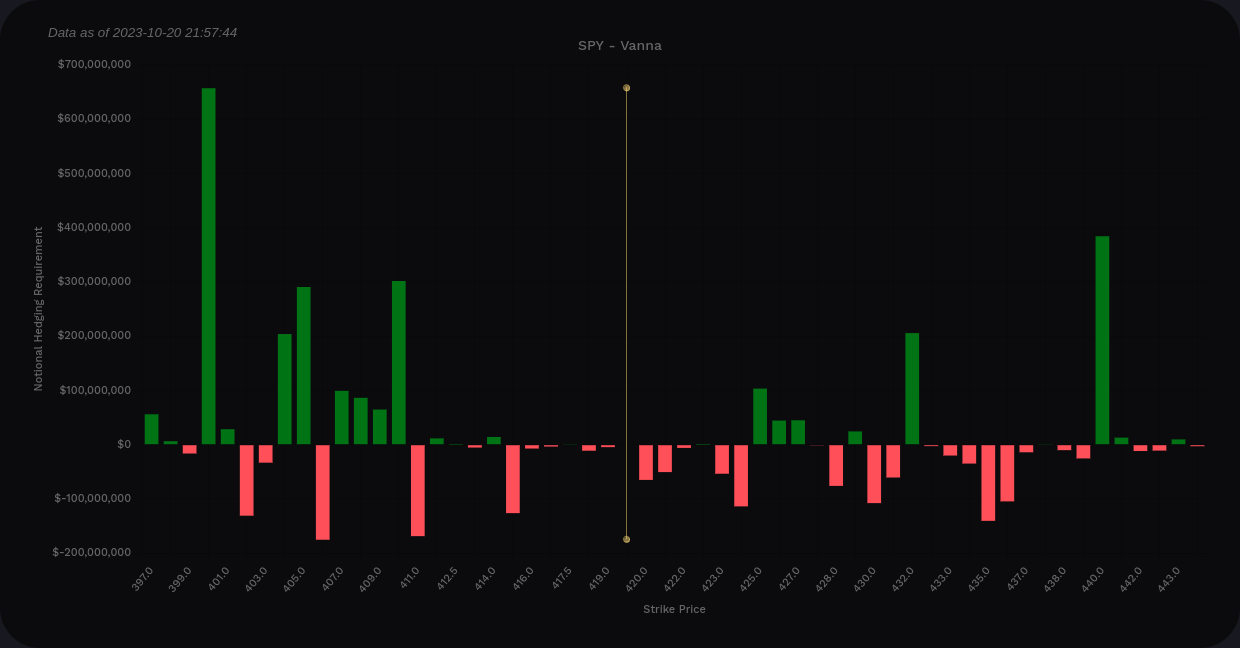
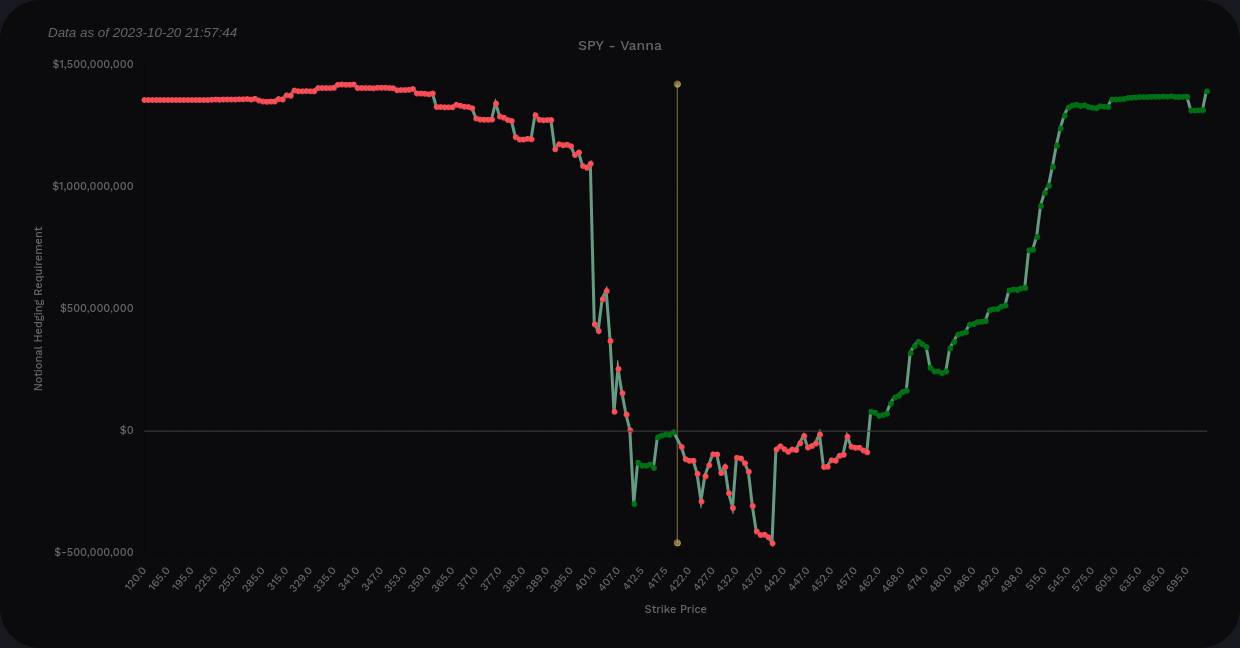
SPY vanna from volland
On the bar chart, our biggest positive level sits around 400. We also have strong positive bars at 405, 410, 432, and 440. The 420 level was a big one last week, but that level has disappeared after the OPEX on Friday. 👀
Expanding IV is not going to be friendly to SPY's price. In addition, some of of these downward stops might be negated by negative vanna until we get to 400. I'm not feeling bullish in the short term so far.
SPX bets often look quite a bit different since SPX and SPY have many differences for traders.
Look at that curve! We have positive vanna below price and negative vanna ahead. This gives me a bearish feeling right off the bat. We're at $10B in positive vanna below price and negative $3B above the price, so we're still net positive.
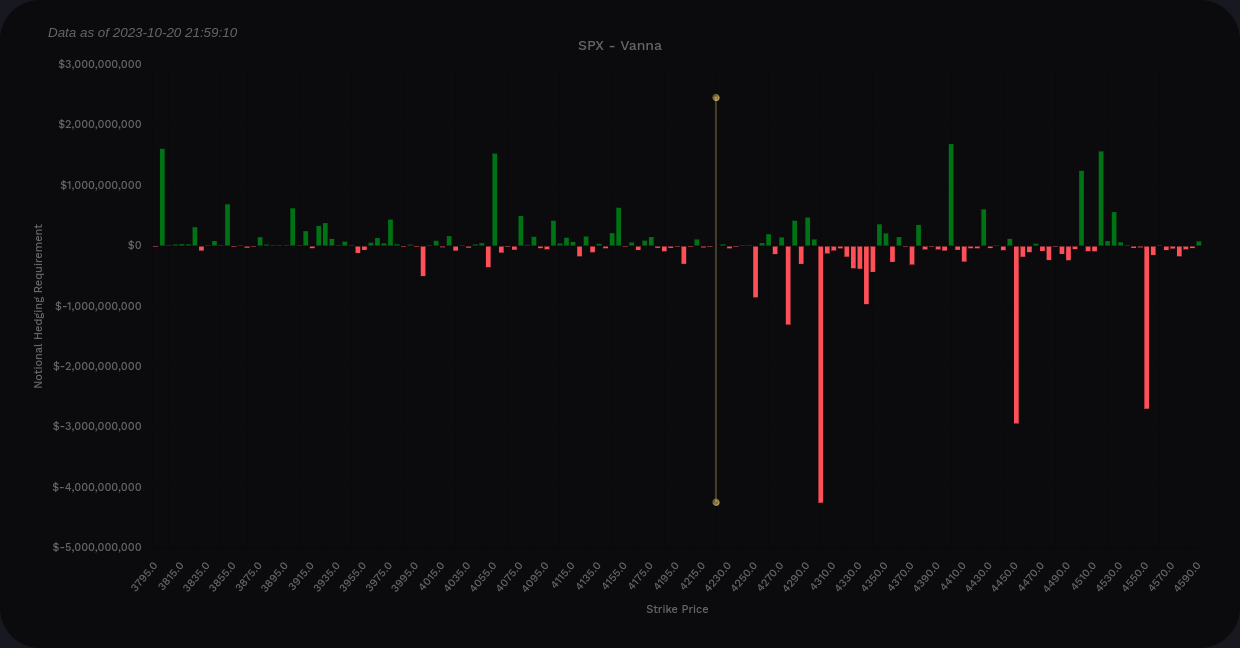
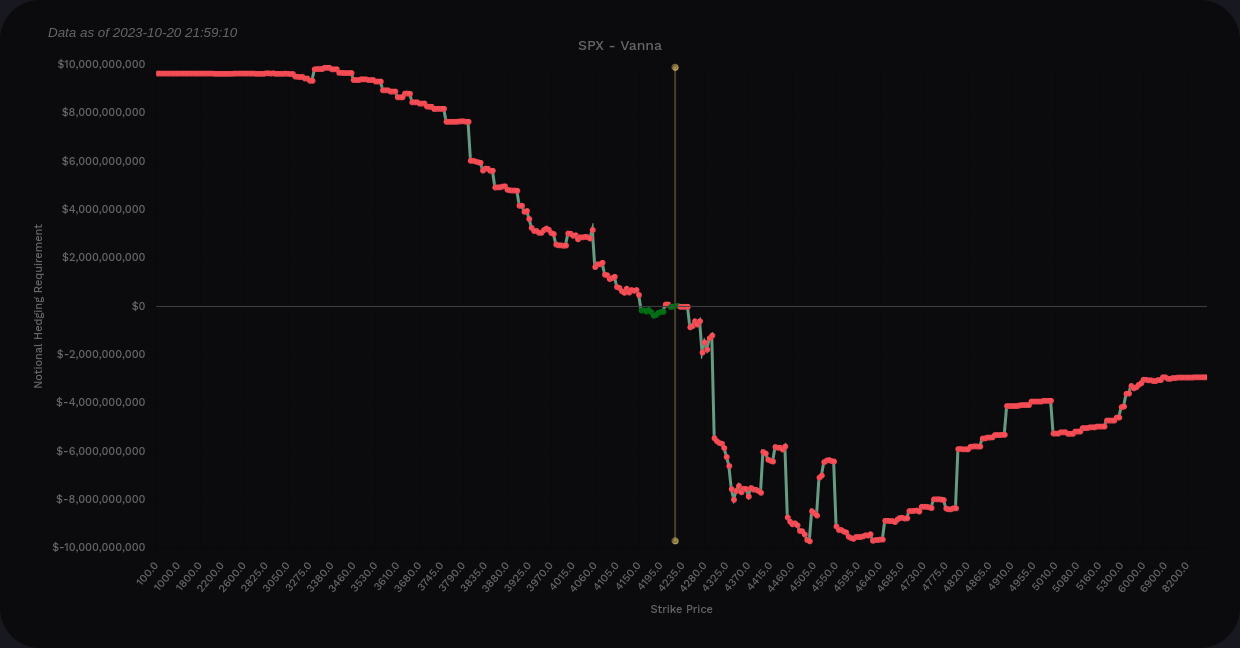
SPX vanna from volland
The big negative bar at 4300 suggests that we're not crossing that level in the short term. Our biggest positive level below price sits at 4055 and that might be our only breather on the way down if IV continues expanding. After that, it's 3800.
I don't want to talk about anything under 3800 right now. It's too early in the morning for that. 😅
Gamma exposure
Tradytics still has Friday's GEX data in their charts, and that skews some of the information. However, there's very little fidelity in the data below $420 here. 🤷♂️

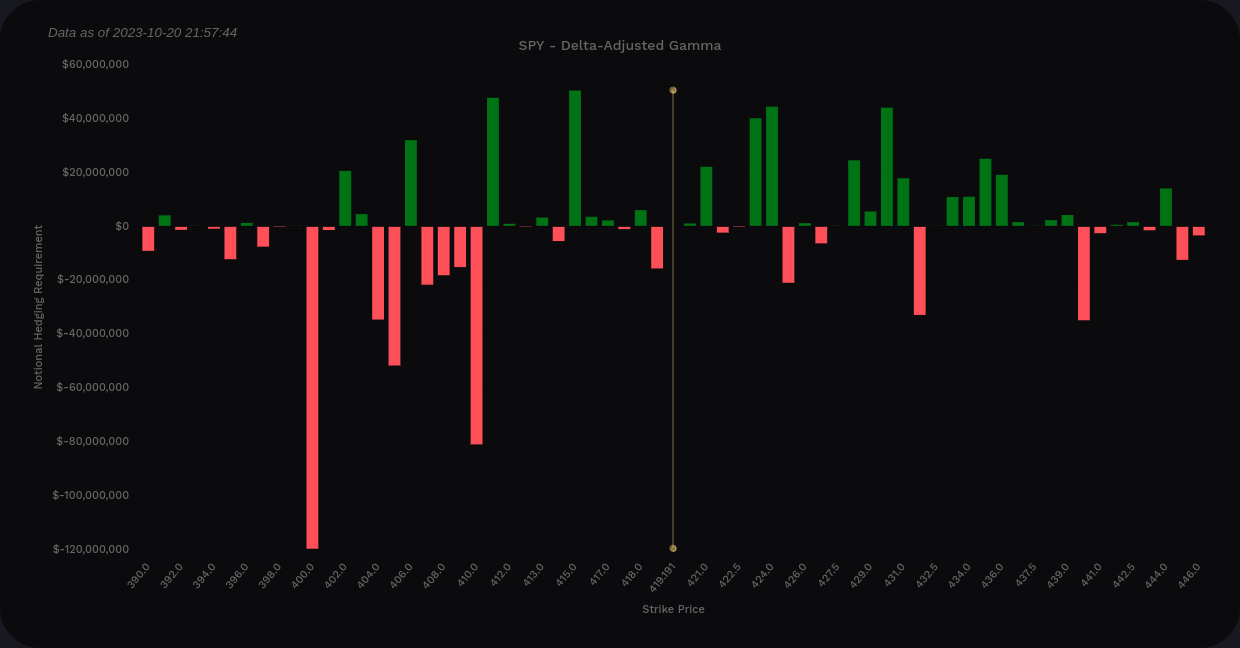
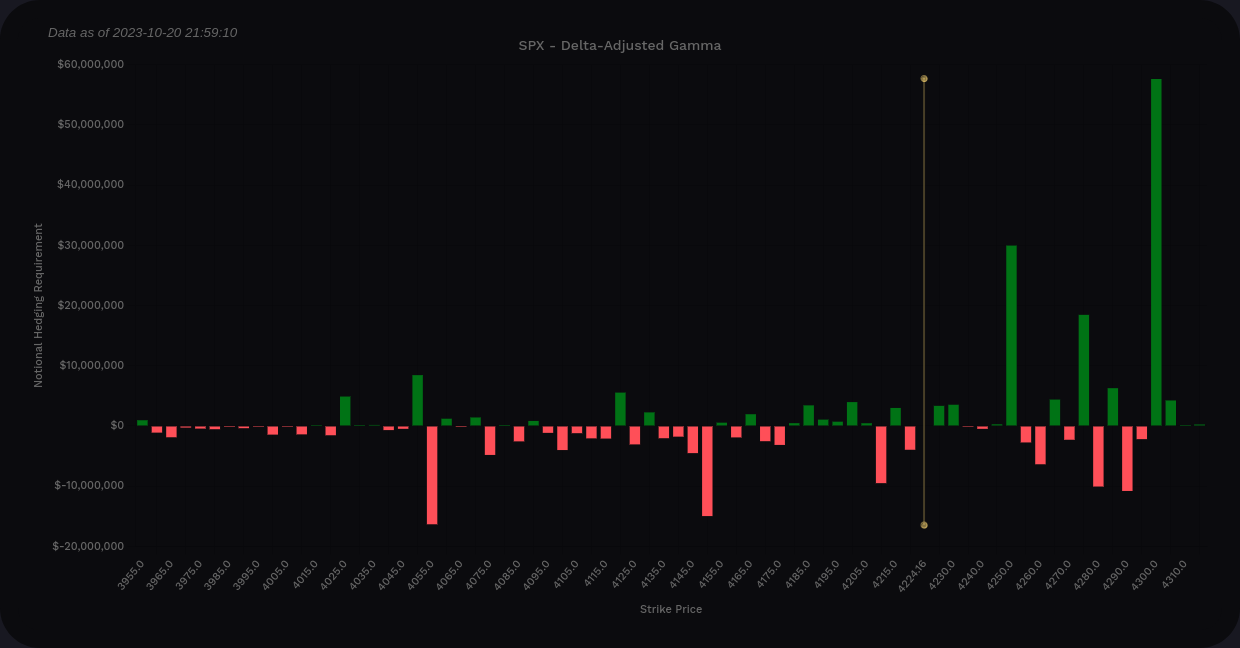
Volland offers delta-adjusted gamma (as well as plain gamma charts) that adjusts gamma bars above price to show what happens at different levels. This simplification allows you to read this chart as green means buy and red means sell – from a dealer's perspective.
SPY's DAG suggests we might catch some support at 415 and 411, but there's tons of negative gamma around these levels, too. Losing 400 here would not be helpful.
SPX DAG suggests that there's not much here to help us if the price starts falling. The small positive levels we do have are canceled out by nearby negative ones.
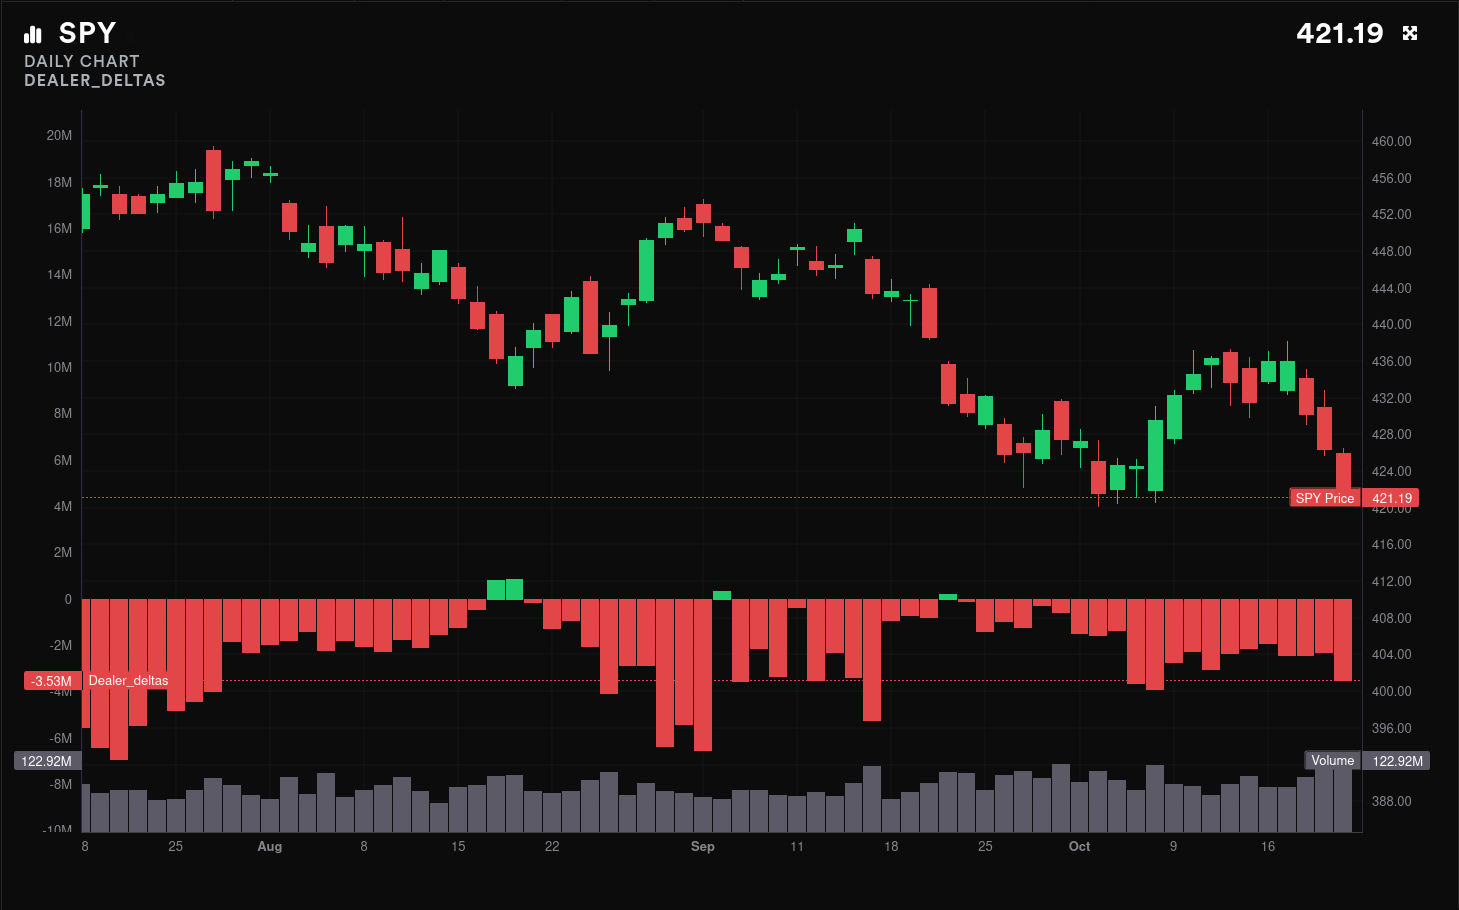
Dealer positioning
Dealers have been short overall and that implies that more customers in the market are picking up bullish options contracts, yet price continues to fall. How can this be?
One angle could be that traders are betting on an upswing if some of our current challenges are resolved. There are multiple large wars and conflicts that could spiral out of control. There's a looming problem with housing in the US as interest rates for mortgages creep up. Vehicle repossessions in the US are reaching very high levels. One of the best times to pick up cheap bullish options contracts is during a market downturn.
Another angle could be that many customers in the market are shorting SPY and they need a bullish options contract as a hedge in case the market starts moving up quickly. That's difficult to determine.
Whales
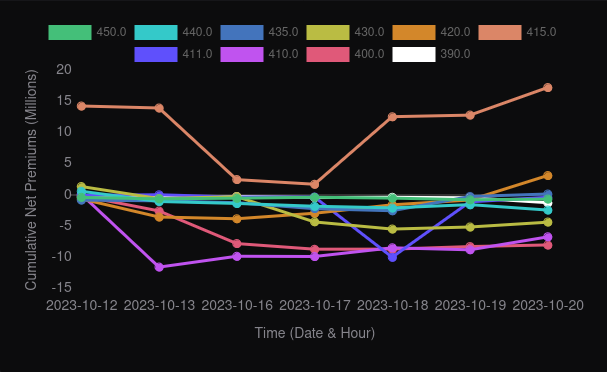
Options traders that trade large amounts of contracts at a time can give us hints about where the market is headed. $430 is moving more and more bullish overall, but this could be due to shorts covering their shorted shares with long calls. It also could be traders betting on a swift turnaround.
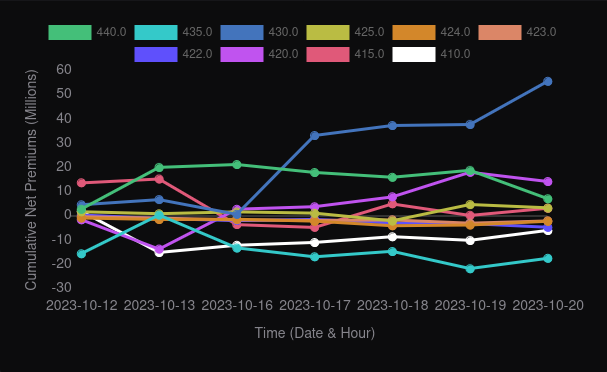
11/17 has $400 going bearish and $430 going bullish.

12/15 has $415 and $420 moving bullish gradually.
Chart
SPY's daily chart shows a bearish turn over the last few weeks on multiple indicators. We're resting right on the equilibrium level where we bounced previously back in October. Will be bounce there again? That's a good question.
If we lose that equilibrium level, we're back to June 2023 price levels. Our next order block starts at $408 and that's a good area to watch. We pick up another order block at $396 followed by the beginning of the discount zone at $384.
Our market structure count is a single break of structure from September, so we haven't seen a change of character quite yet. Seeing one of those would definitely be a longer term bearish sign.

Over to the weekly, things look a little healthier, but not by much. Our money flow in the oscillator is positive, but the wave has shot downwards abruptly after a few recent light bearish correction signals. SPY ran right up to the order block at $456 and abruptly turned around.
We're right above the weekly equilibrium level at $416. If we lose that level, we could find support from $380-$392 from a March 2023 order block. We don't see the discount zone here until we reach the lower $350's.
At the moment, we don't have any bearish market structure changes, such as a break of structure or change of character. That's a positive sign.

Thesis
All time frames shorter than a week suggest a bearish turn that has some support somewhere in the $400-$420 range. Both SPY and SPX have positive vanna and our IV keeps expanding. That's a bearish combination.
However, if we somehow get a volatility crunch, SPY is set up well for a run to 430 and possibly 440. SPX looks less bullish in that scenario, however.
I have a short put at $400 for SPY that I'm watching closely. I've also been selling covered calls aggressively on AMD as the market drifts lower.
Carefully monitor your position sizing and avoid sending good money after bad! Not trading is also a trading strategy (but yes, it is difficult). 😉
Good luck today! 🍀
Discussion