Stock and options analysis for August 22

NVDA earnings arrive tomorrow and they will likely affect the entire market. Let's get a look at AMD and TSLA along with the broader market. 🔍

CNBC would have you believe that NVDA's earnings tomorrow will make or break the market. We will see if they're right. 😜
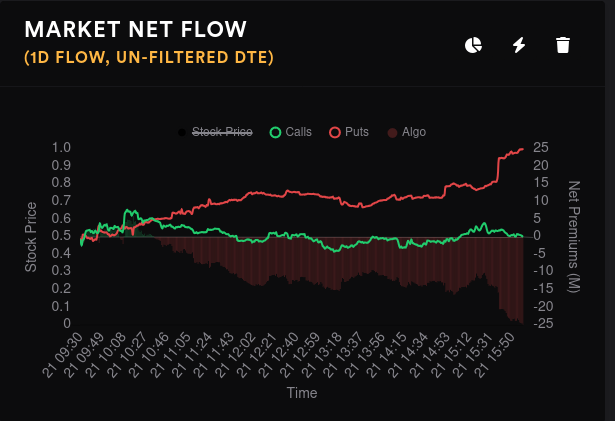
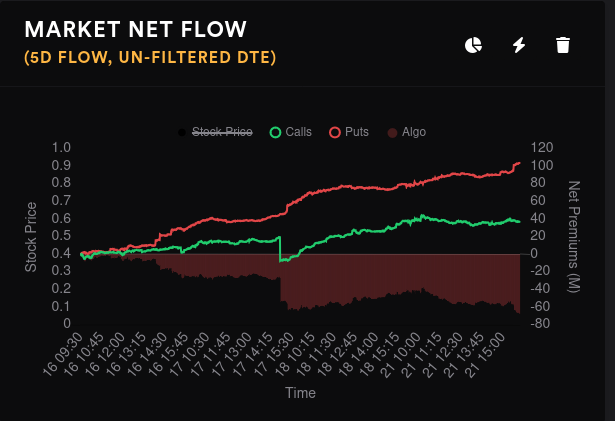
Overall market
We saw some bounce in the market yesterday with most tickers grinding a bit higher. That was nice to see, but I'm still reckoning with the amount of bearishness in the overall market flow:
Aggregate GEX for SPX suggests 4300 is the biggest magnet for price, followed by a fairly close 4350. The 4325 and 4400 levels show a decent amount of resistance, so this makes me think that GEX wants us around 4350 (SPY $435). However, there are plenty more forces in the market outside of GEX.

Big money options traders are going bearish on 4500 and 4400 for 9/15. 4450 had been a really bullish strike, but it's moving towards the middle line slowly. Fear not – there's bullishness in the 4400 as we go into 10/20.
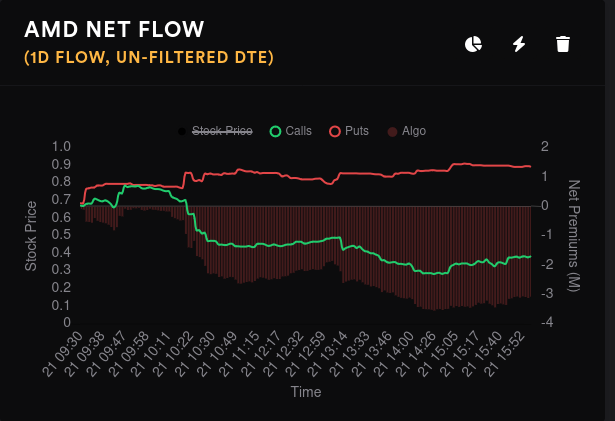
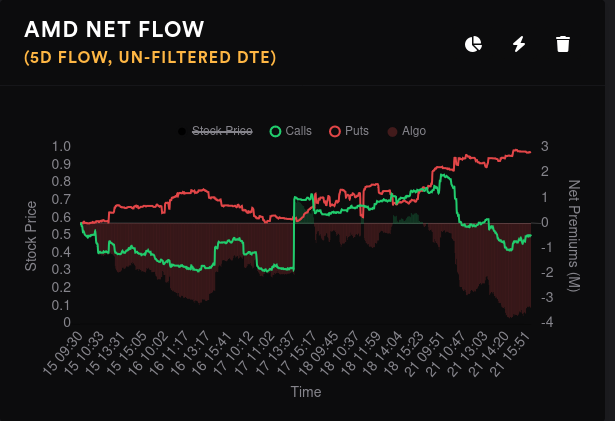
AMD
AMD was firmly bearish yesterday as price moved up and it was a departure from the hotly contested previous days:
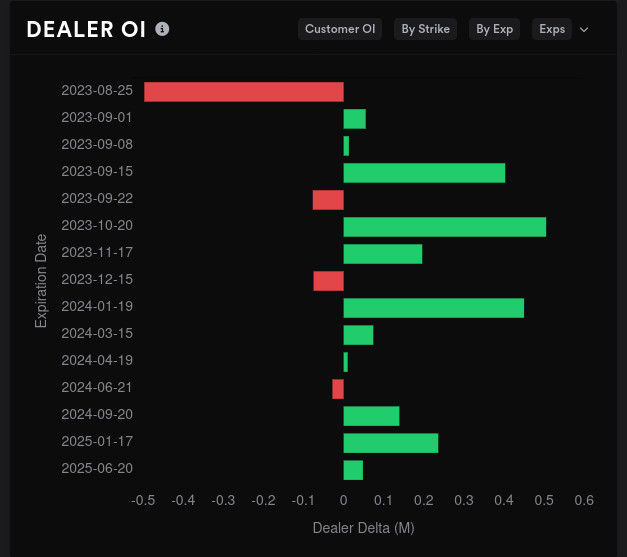
AMD options volume is down, open interest is down, and we've had two days in a row of dealers taking on bullish contracts, which suggests customers are turning bearish (on a 15 day momentum):

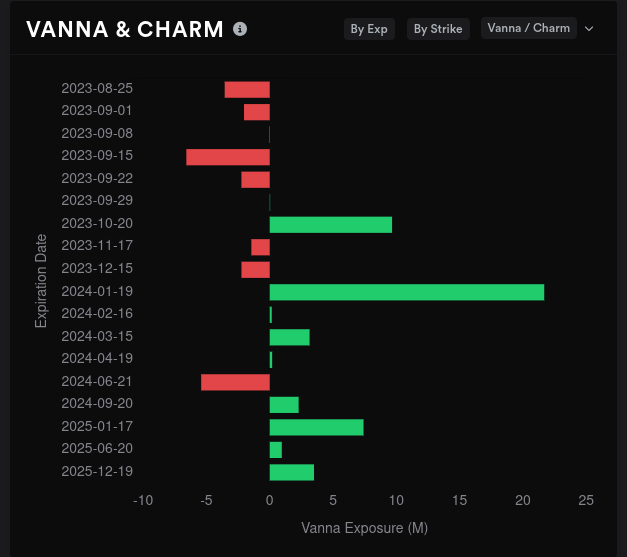
Options contracts are priced for a downward move. This week has a bullish tilt and nearly every expiration afterwards looks bearish. Vanna is mostly positive starting at 10/20 and that should give us a bullish lift if IV contracts or stays steady. I doubt IV will remain low as we head into a potential interest rate hike when the Fed meets.
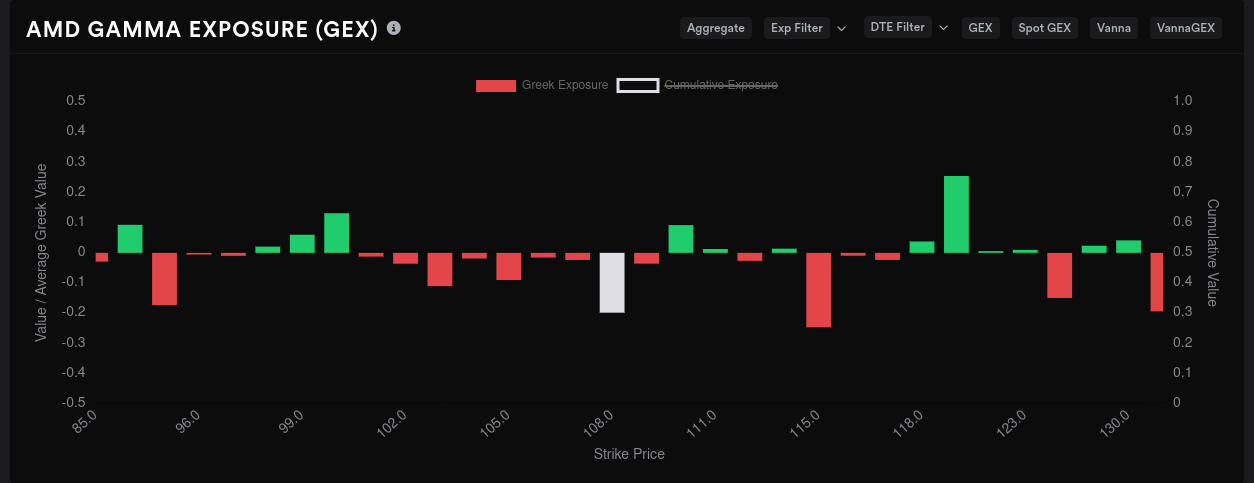
AMD's aggregate GEX suggests a potential move to $115 with a hard stop at $120. There's not much resistance to the downside and there's a growing negative GEX line at $95 that gives me a little worry.
We also have big money options traders going very bearish on $90 for 9/15 and bearish on $110 for 10/20. This correlates to the dealer OI charts above.
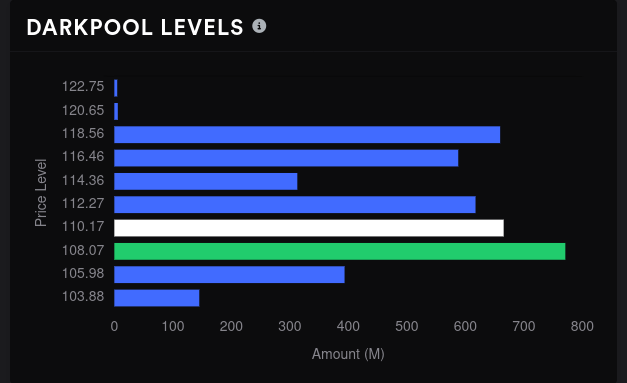
Dark pool trades went further into the red yesterday and our biggest level now sits at $108. With yesterday's bullish price moves, I'd expect to see sentiment improve here to confirm the trend. I'm not seeing that.
TSLA
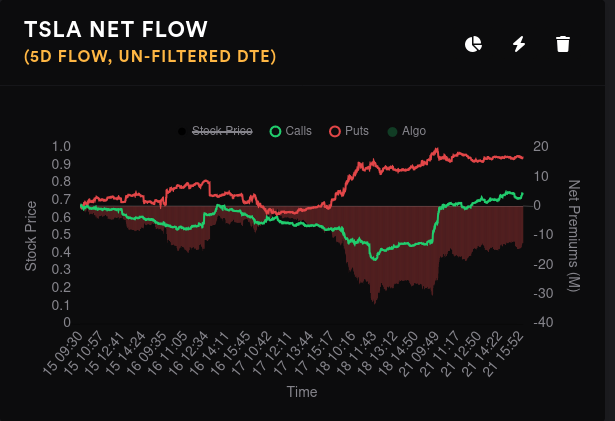
TSLA went absolutely bananas with bullish premium yesterday and the stock responded with some big moves to the upside. However, in the context of the five day chart, the needle didn't move nearly as much:
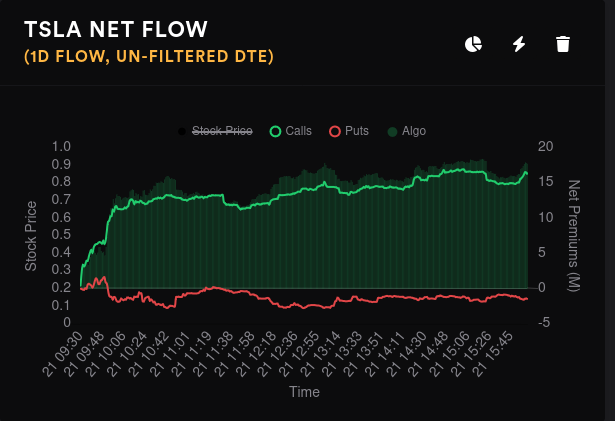
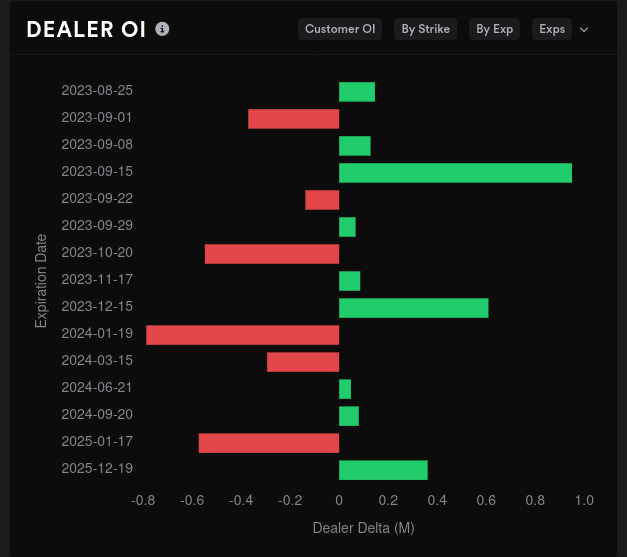
TSLA's options volume fell relative to Friday, but it's in line with other days from last week. Open interest shot right back up to last week's levels after the 8/18 OPEX. Dealers are still long TSLA, which implies that customers are likely short.
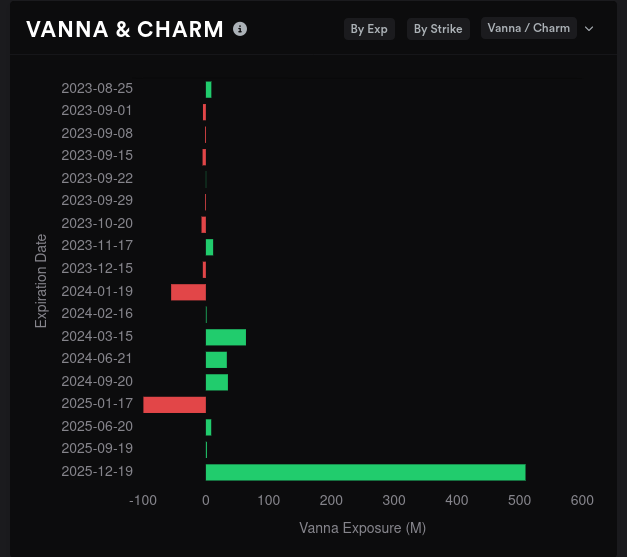
Dealer OI is all over the place depending on the expiration. 9/15 seems bearish and 10/20 is bullish. The vast majority of TSLA's vanna is positive and it's packed into the 2025 expiration.
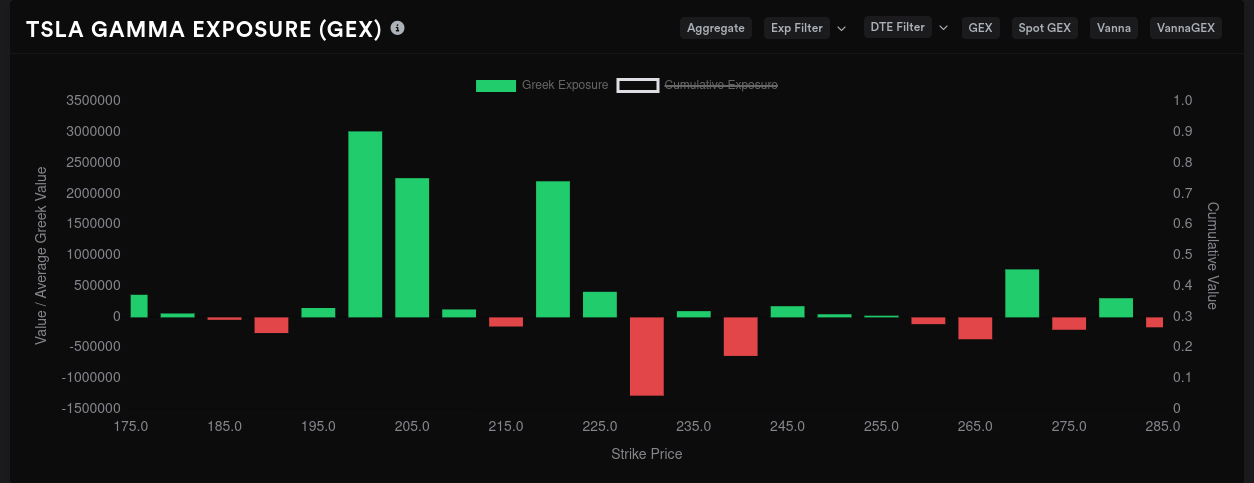
GEX paints an interesting picture here with $212.50 and $270 being the biggest magnets for price. $235 is our biggest resistance zone, but it's fairly small. The one thing this chart tells me is that in a low volume environment, TSLA definitely has room to run up and down.

9/15 still shows support at $210 and the biggest price magnet at $270.

10/20 shows $230 as the biggest magnet with some strong resistance at $200-$205 along with $220.
So what's going on with that TSLA $270 strike for 9/15? It looks like some big money traders have gone in hard on $270 starting last Friday.

A look at 10/20 shows a big bullish move for $220:

These could be massive bullish bets. They could also be a hedge for someone who is aggressively shorting TSLA.
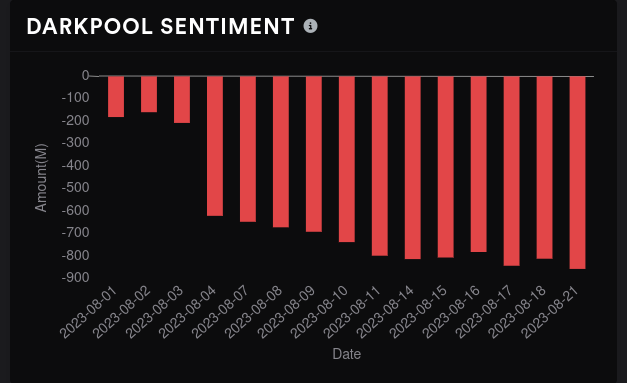
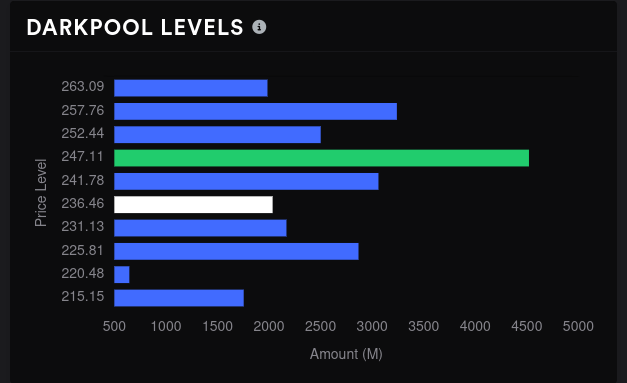
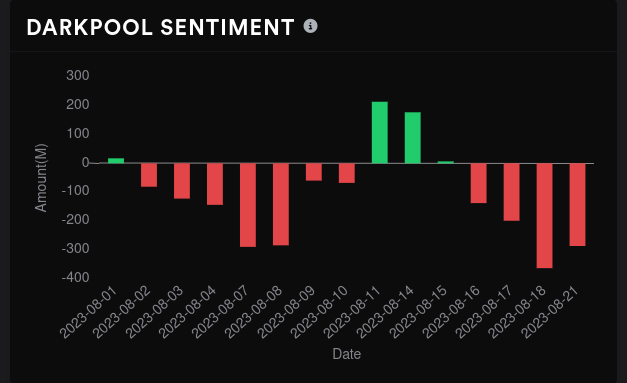
Dark pool data shows the most volume around $247 with sentiment remaining slightly negative. I do like seeing price move up and dark pools getting a bit less bearish at the same time.
Thesis
There's plenty of chop in the market right now across the board and some price action might not make any sense (or make less sense than normal). Volume has been lower in some of the stocks I trade as well. This allows for wild price swings over short periods.
For AMD, I'll be closely watching NVDA's earnings. I don't trust AMD's recent price moves and I've sold plenty of covered calls in the $110-$120 range. My cost basis on AMD is around $94, so getting assigned up here on 9/15 would be just fine.
I'm looking for AMD to trade in a $95-$115 range but I'm expecting plenty of chop. News and hype for artificial intelligence (AI) has likely been driving investor sentiment and that could change abruptly.
TSLA's price moves are wild. I'm not sure if I want to trade this one long term because the swings are so violent. I still have a $210 put on the board for 9/15 and I've covered my remaining shares with calls at $250. As with AMD, I'm a bit leery of the recent price movement. If I'm wrong, I'll collect some options premium and move on to the next trade.
However, with big money playing around in TSLA's 9/15 expiration around $270, anything can happen. 🤷♂️
Good luck to everyone! 🍀
Discussion