Time for defense?

Aerospace and defense stocks are getting plenty of attention right now, but is there enough of the trend left to follow? Let's dig into the data and see how high these stocks might fly. ✈️

Hey there! No, this post isn't about defensive stock plays with the recent pullback in the major indexes. It's about whether right now might be the right time for a trade on aerospace and defense stocks. 😉
Lockheed Martin (LMT) and Raytheon (RTX) have seen some big inflows recently, but has the trend left without us? Let's dig into the data to find out more.
All investments come with significant risks, including the loss of all capital. Please do your own research before investing, and never risk more than you are willing to lose. I hold no certifications or registrations with any financial entity.
Time for data!
The aerospace and defense sector
One good way to find sector ETFs for your favorite stock is to view the stock's page on Barchart and we will start with LMT. The right column shows ETFs that have the stock as one of their larger holdings:
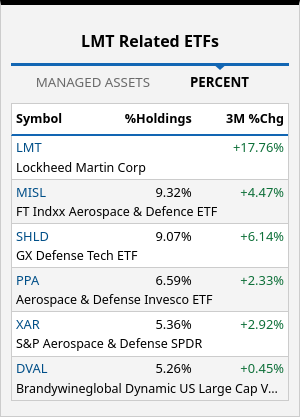
Click on XAR and then click on "ETFs - Defense" under Sectors. Then you can sort by their market caps to find the one that is most often traded:
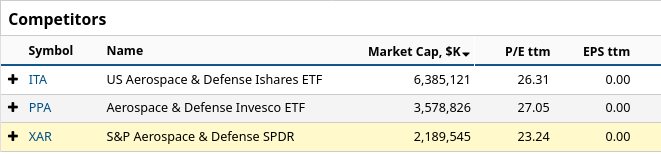
ITA looks like the winner here, so let's find out more about it.
Candlestick charts for ITA
Let's start with a broad look at ITA since 2019 on a weekly chart. This is a great looking chart, especially when you notice that the 2022 downturn was fairly gentle to the aerospace and defense sector relative to technology. The whole year of 2022 looks more like a sideways move here.
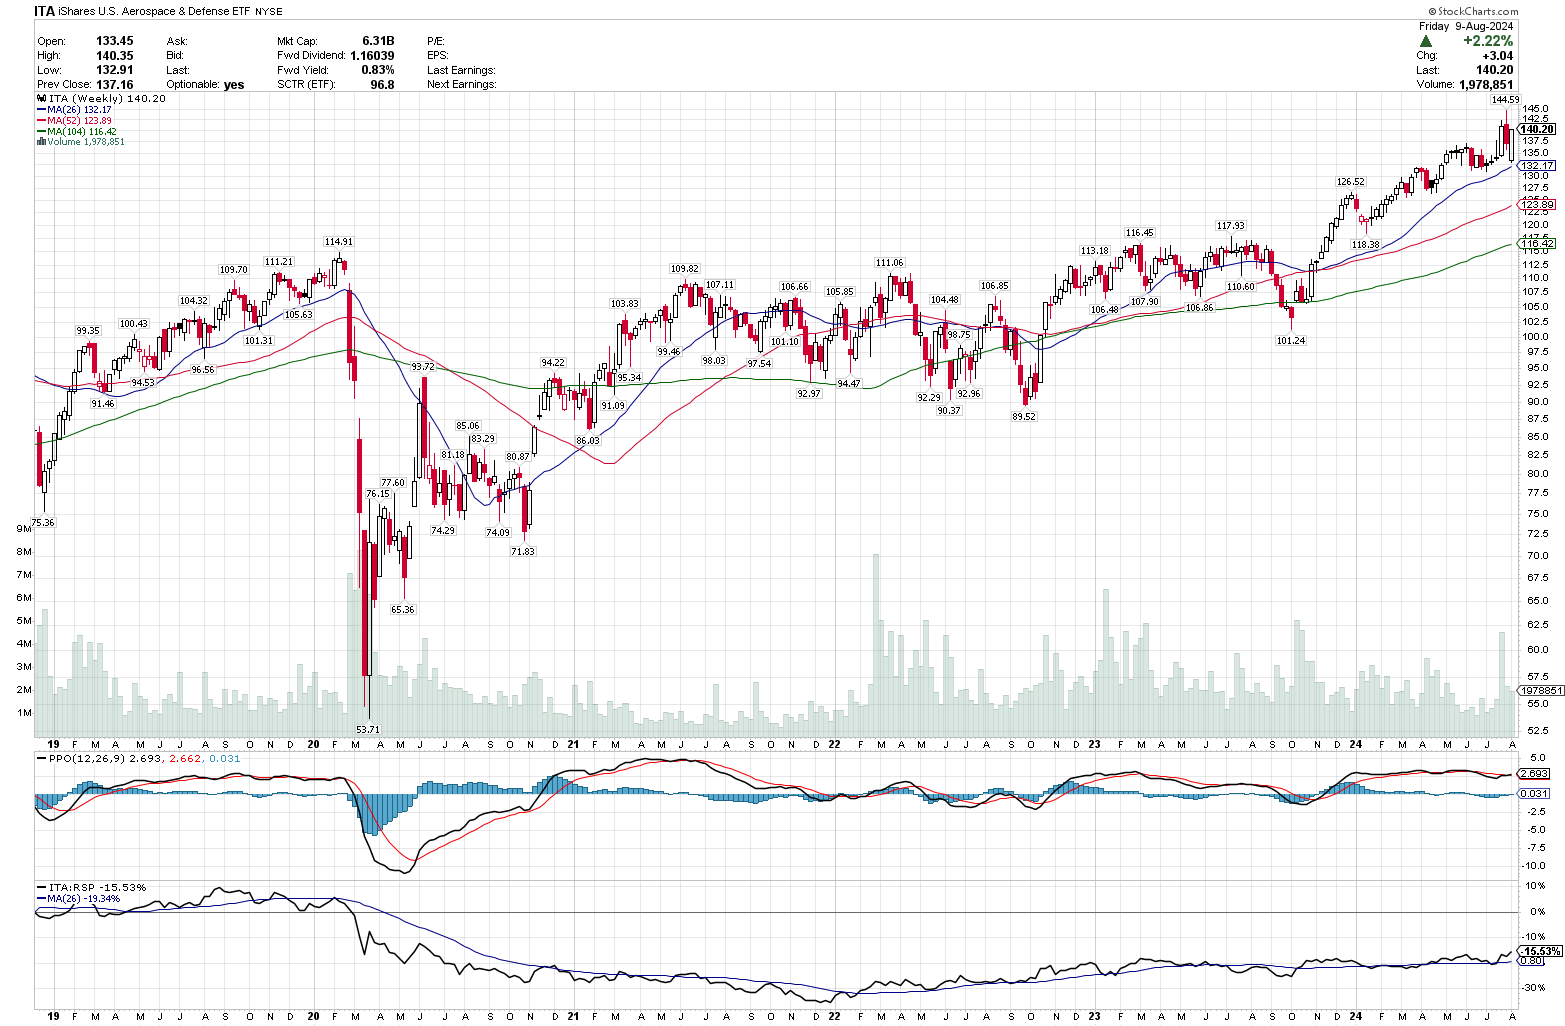
Recent price performance since the fall of 2023 looks steady without any significant spikes. ITA's performance relative to RSP (equal weight S&P 500 ETF) has been growing slightly and is now above the 26 week (6 months) moving average.
Let's get a look at a weekly chart of just this past year. The recent highs were made on a bit higher volume, but the volume backed off to the average over the past two weeks. The PPO (Percent Price Oscillator) is showing a lower high for the most recent high which suggests ITA might be losing some momentum. However, the drop over the past two weeks we much smaller than what we've seen from almost all other sectors.
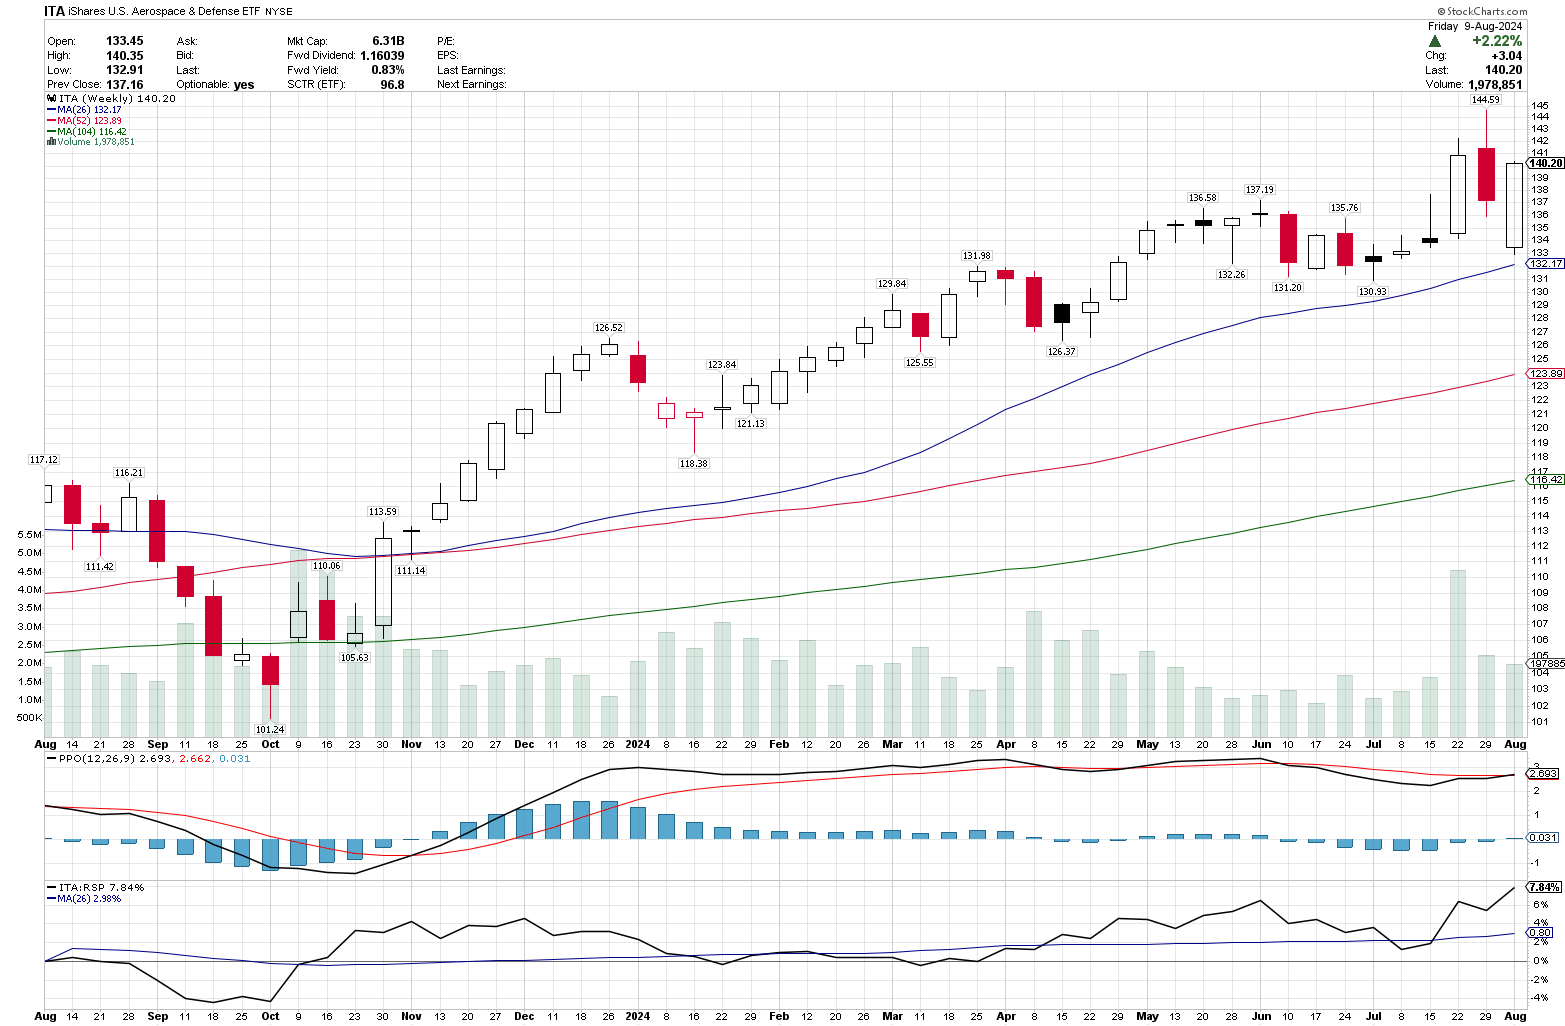
If we start counting the strength of ITA versus RSP since this time last year, it's already beating RSP by almost 8%. That's a good sign for the short to medium term.
My initial thoughts here is that we likely have resistance from the highs around $150 with some support around $126 and $130-$131.
Point and figure charts for ITA
I've started using point and figure charts in my weekly research for a few reasons:
- They smooth out some of the wild moves in the market.
- Every point and figure chart is showing a bullish or bearish signal at all times. There might not be an active pattern in play, though.
- You can plot out some potential price objectives higher and lower on the chart.
If you're new to point and figure charts, I highly recommend the Chart School pages from Stock Charts to learn more. There's also an awesome two part video series on YouTube that explains these charts well.
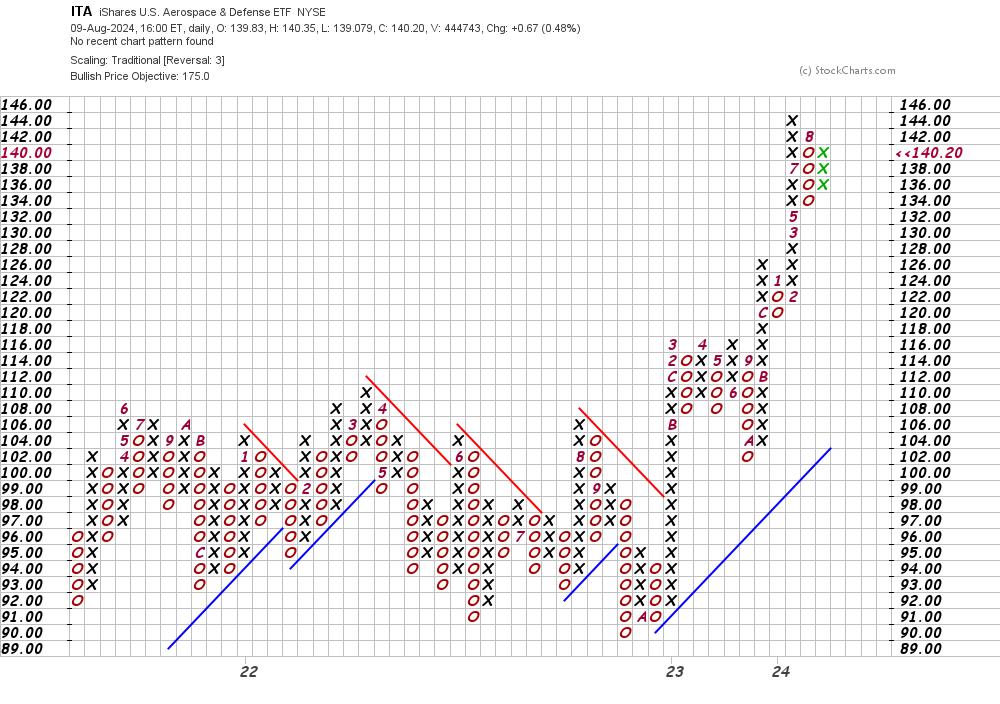
The column of green X's on the far right suggests we have a bullish breakout underway, but there isn't a pattern to trade with yet. If the price revisits $144, we will have a double top (that's bullish on point and figure charts!). However, we need to see price get above $144 to get a double top breakout. That could be a great long entry.
But how far could the price go? We can use the vertical method to take this upwards momentum into account.
We had a double top (two X's at the same price) at $126 and then price broke out from there. So we had 8 vertical boxes since the last bullish breakout (counting up from the double X's at $126), we have $2 per box (Y-axis scale), and then we're using a 3 box reversal. Multiply those together to make $24 and add it to the double top level, $126. That gives us $150 as a potential target. That's likely a psychological level that ITA will need to break, too.
What about the individual stocks?
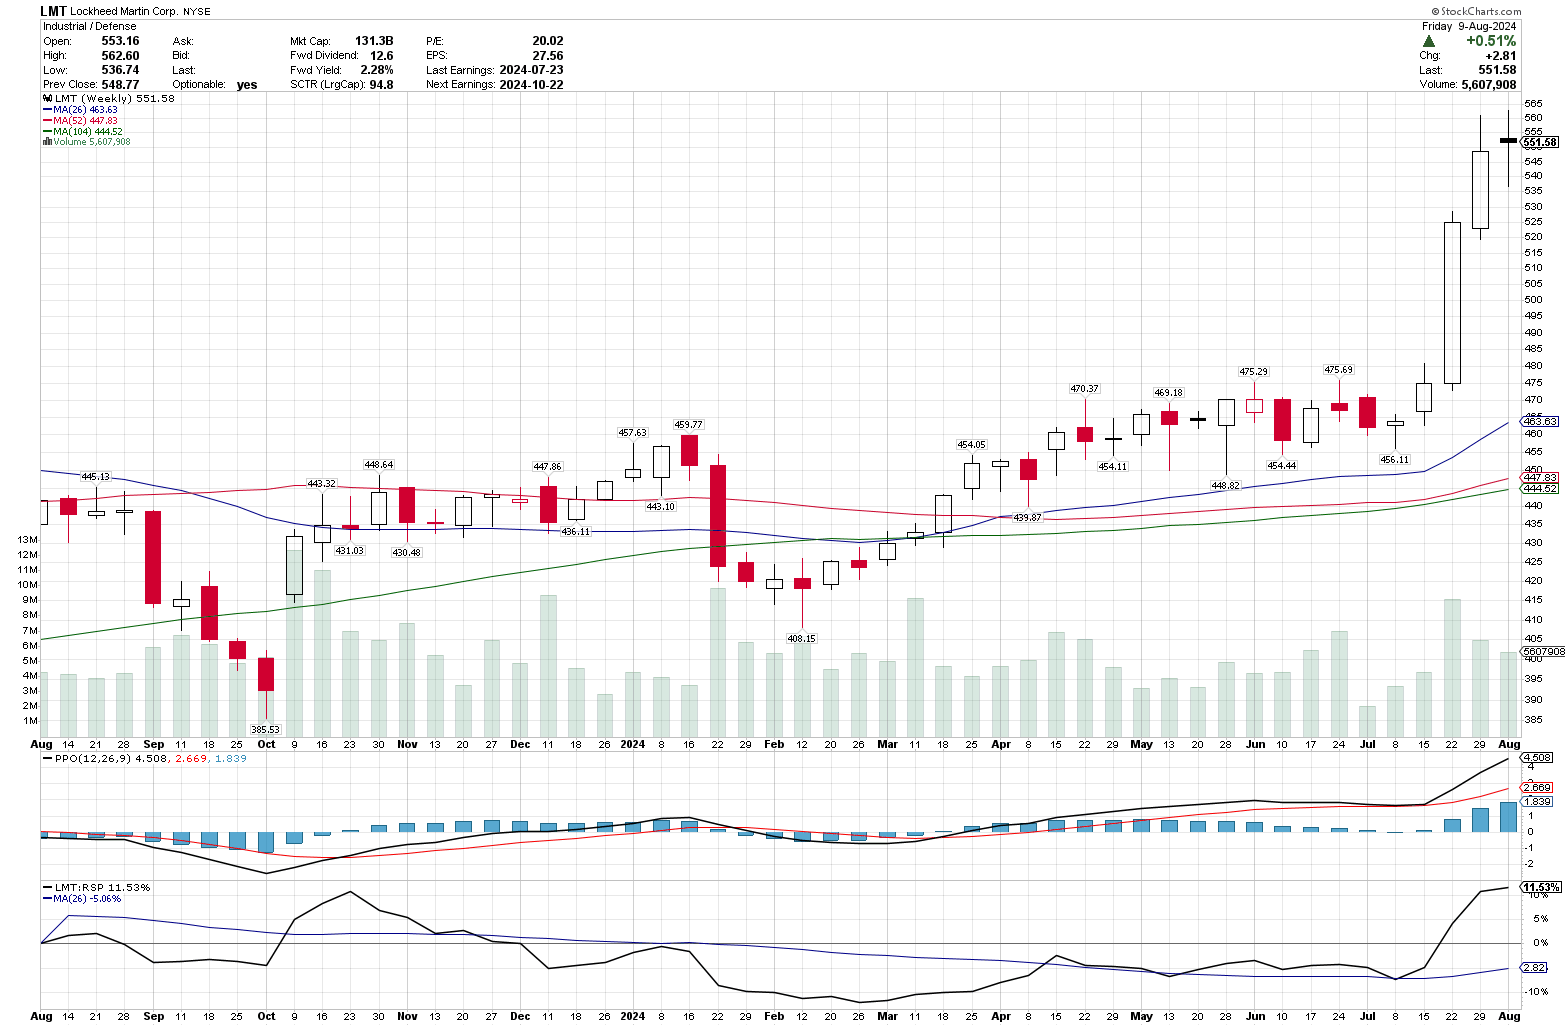
LMT looks great, but the recent rise has been quite steep. I thought we might see a blow-off top here from the July 22 rally, but it kept rising. We have a doji candle from last week on reduced volume, so we should watch here for a potential pullback or a sideways consolidation.
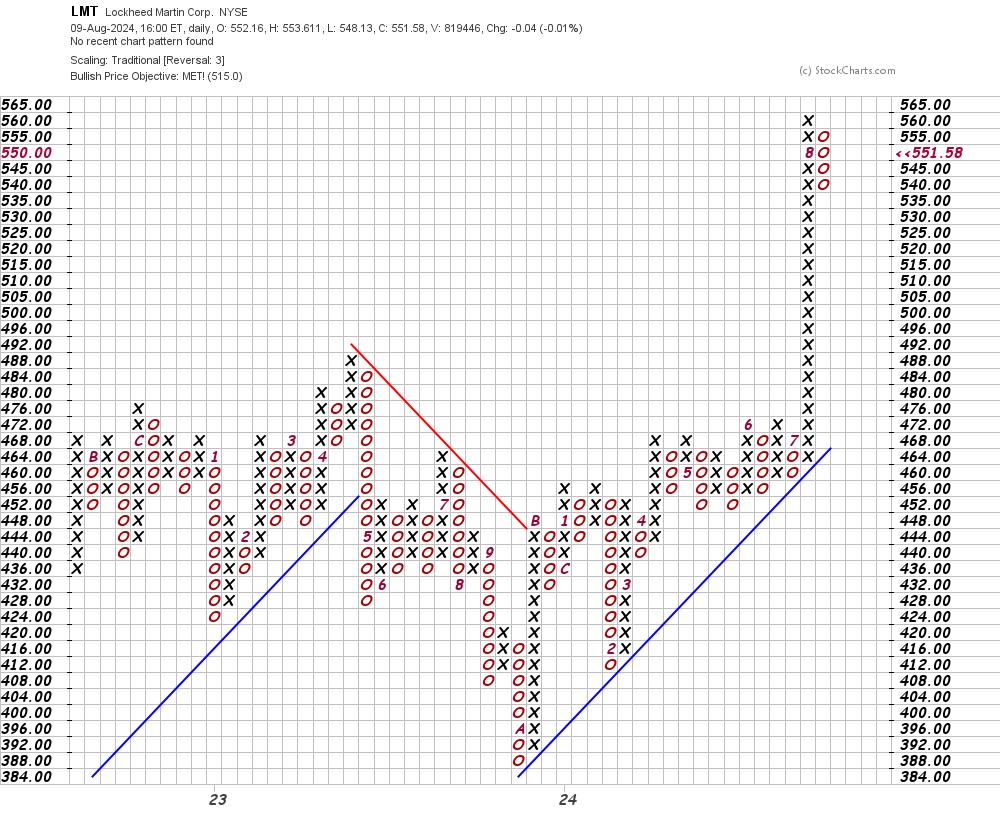
LMT's point and figure chart gives us more of the story since it shows that our recent consolidation around $450-$470 has a price objective of $515 that was already hit. This chart suggests to me that price needs to consolidate here a bit and build a new base to sustain more moves upward.
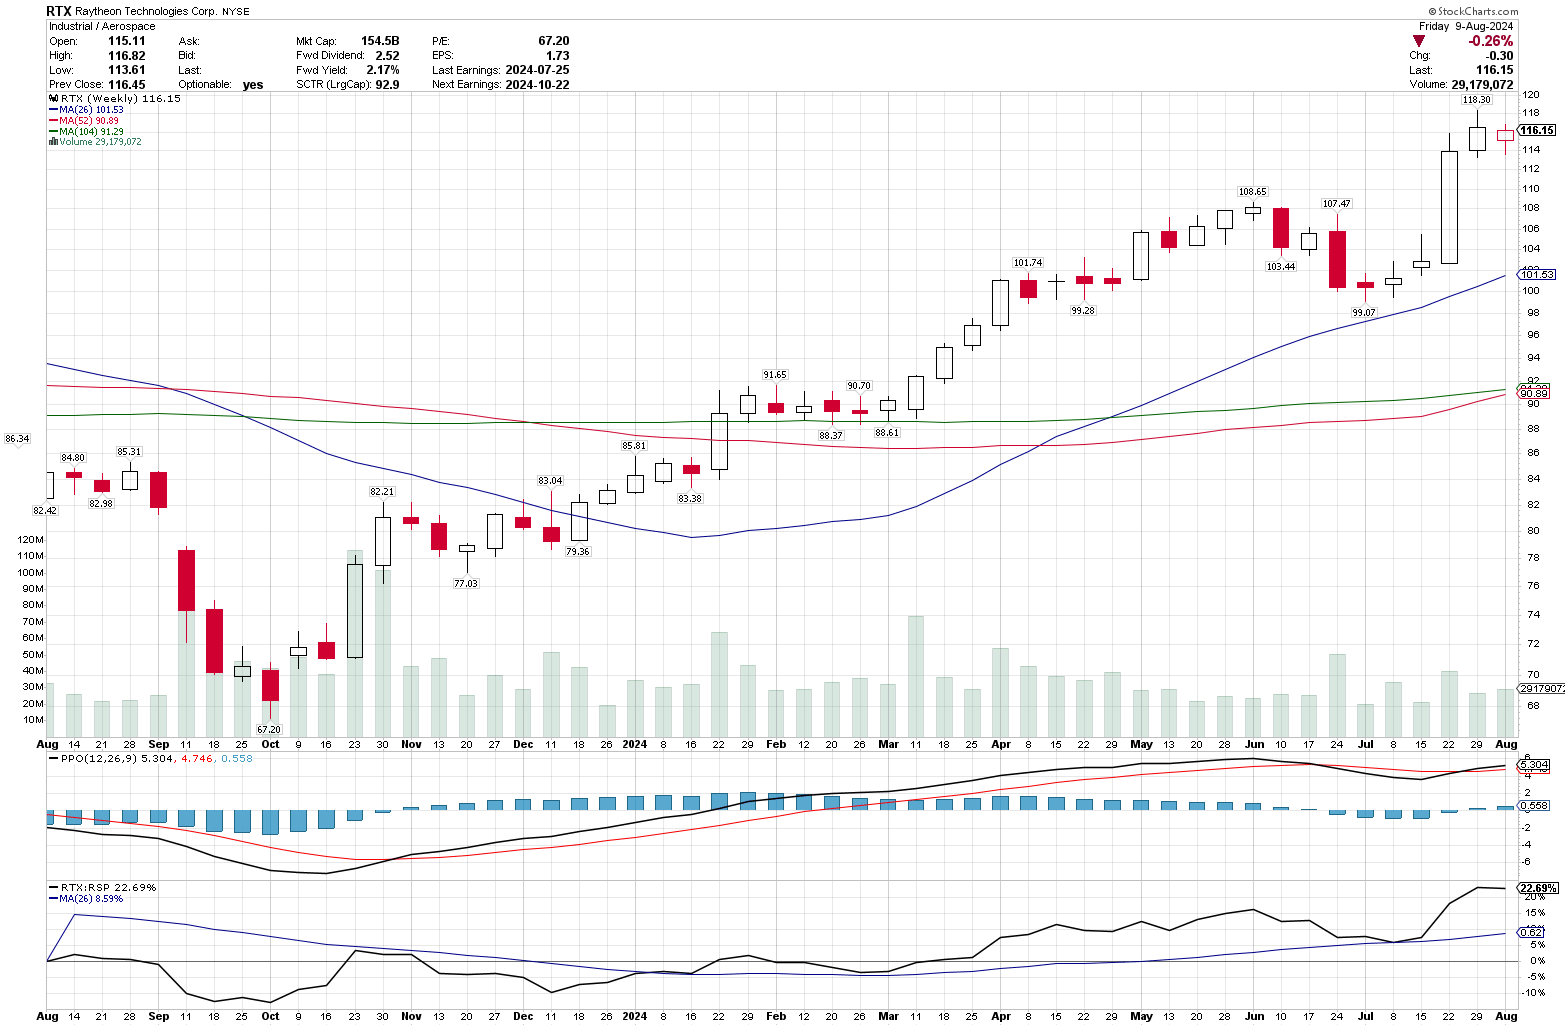
RTX had quite a jump as well, although it was much more muted than LMT. The volume here is much more steady as well. However, we're looking at another doji candle as the week finished down slightly (LMT was up slightly).
RTX's point and figure chart shows that the last consolidation around the lower $80s led to a price objective of $93 which was hit already. But now we're looking at an ascending triple top breakout and that increases the odds of a bullish outcome. You see a double top of X's at $108 and also at $91. This is a sign of significant strength, but it's unclear how long the current breakout might last.
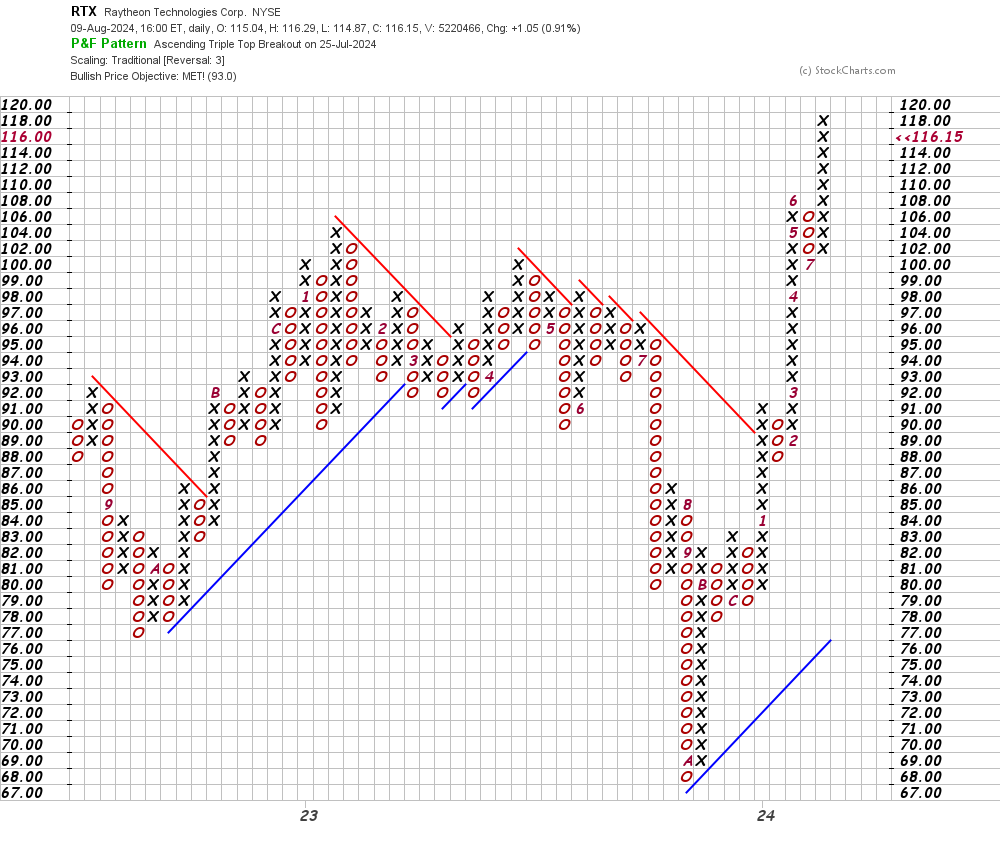
Let's break out the vertical method here once more. The breakout happened around $110 and we've seen six X's as part of the breakout. We can take 6 X's, multiply by the $2 box size, and multiply that by the 3 box reversal. That means we're looking at $36 in potential gains past the base at $102, which takes us to $138. That's pretty ambitious with how far it ran already, but it's something to plot on the charts.
Thesis
I'm a firm believer that following trends works well, provided that you can tell when the trend is losing strength. Wise traders often say that the exit point is much more important than the entry, so keep your exit points in mind. Here are some "lines in the sand" where you may want to re-evaluate your position:
- ITA: $128 and $118
- RTX: $102 and $92
- LMT: $476 (long way down from the current price!)
LMT looks like the riskiest bet of the bunch because it has run off from many of its support levels. ITA has LMT as a major holding, so watching that ETF might give you an earlier sign of trouble.
Good luck out there this week! 🍀
If you want to improve your market psychology a little this week, watch this interesting video from David Keller. He has three good tips at the end that gave me some new ideas to consider:
Discussion