Trading options with vanna

Second order options greeks, such as vanna, aren't easy to learn. This post explains the basics of vanna, why it's important to your options trades, and how to increase your odds of success by using vanna. 📈

If you spend any time trading options, you'll hear about options greeks. It's a quick way to reference certain parts of an options contract in a consistent way. Although these are well known among seasoned traders, it can be challenging for newcomers.
First order greeks, like delta and theta are described on many websites in great detail. There are also great charts to explain how these change over time and how they change when the underlying stock or ETF moves.
Vanna presents an extra challenge as a second order greek. It's a derivative of another derivative (hello my calculus survivors!), so we're looking at things on a secondary level.
This post covers what vanna is, what makes vanna important, and how you can use it.
But first, let's get the disclaimer out of the way:
All investments come with significant risks, including the loss of all capital. Please do your own research before investing, and never risk more than you are willing to lose. I hold no certifications or registrations with any financial entity.
Let's start learning! 👨🏫
A note about market volatility
Before we talk about vanna, we need to talk about volatility. Something that's volatile has a rapidly changing price. Increased volatility in the stock market means that traders are uncertain about the future and they're eager to do one of three things:
- Insulate themselves from the uncertainty with protective options trades
- Take advantage of the uncertainty and take extra risks for extra profits
- All of the above
When traders buy up lots of options contracts, the price of those contracts increases. It's simple supply and demand. When these prices surge, volatility increases. Options contracts become more expensive and traders prepare themselves for potential larger moves.
For an average retail trader that is holding long puts or long calls, volatility is exciting! Options contracts get more expensive and your contract might go up in value even if the underlying price isn't getting closer to your strike!
However, volatility presents challenges for the deeper pockets in the market. Market makers must quickly adjust their hedges in the market to maintain their position neutrality. Hedge funds and other large traders might load up on protective trades to avoid a surprise.
What if there was a way to get an idea where these hedges are stacked up and where the market makers might need to make big adjustments to their holdings? That's where vanna comes in.
What is vanna?
Vanna measures how much volatility affects the delta of a particular options contract. If we want to get really nerdy, vanna is the "change in delta for every 1% change in implied volatility". 🤓
Let's break this down into simpler terms.
You have a .30 delta call the $105 strike for a stock that is trading at $100. If the price of the stock moves up to $104, your delta might suddenly move to 0.45. That means your options contract is closer to the money and it's worth more than it was before. As deltas increase, so does the value of the contract. 👏
On the other hand, if that stock moves down to $95, your contract at $105 is much further from the stock price. The delta might be 0.20 now and your contract would be worth a lot less. You're now sitting there with a loss. 😢
How does vanna play into this?
Let's say we have a stock at $100 with your call at $105. Some news comes out that affects your stock's market sector and traders rush in to protect their holdings with options contracts. That increases volatility. That increased volatility will increase the deltas on your options contract even if the underlying price does not move. This is vanna at work!
Your 0.30 delta call might now be 0.35 delta even if the underlying stays at $100. It will be worth more.
If volatility crashes because everyone realizes the news is no big deal, then your call might call to 0.25 delta as a result of implied volatility dropping. The options contract would be worth less now. That's vanna working against you.
Why is vanna important?
Many traders look at the VIX as a representation of overall market volatility even though it really only measures options contracts on the SPX index. The SPX index (and its long line of ETFs, such as SPY) are so popular with traders that VIX has become well known and regarded as a good overall volatility metric.
If you have a guess as to where volatility might be going across the broad market by examining the VIX, you might get an extra edge when making trades based on volatility.
Typically, a reduction in volatility corresponds with a bullish move on most indices. Increases in volatility typically correspond with a move down in price. These aren't always the case, but they happen together most of the time.
Combine that guess on where volatility is headed with the vanna profile of a particular stock or ETF and you can increase your odds slightly with your trades. Vanna often helps me determine the boundaries of where a stock might trade in a certain time period as volatility goes up and down.
How do I use vanna in my trading?
As a second order greek, vanna is complicated to calculate. You also need something that will make educated guesses about the dealer side of trades and compile all of that into a helpful chart. In my case, I use Volland. They offer a helpful platform with varying plans that gives you access to lots of vanna charts along with other greeks.
Let's start with a simple vanna chart and break it down. Vanna charts come in two varieties on Volland: a curve and a bar chart.
Vanna curve
The curve chart provides a great way to get a high level look at vanna for a stock or ETF. The example below is from AAPL and it covers vanna from all available expiration dates.
The first thing to look at are the left and right extremes of the chart. On both sides, vanna is very positive since both sides are well above the zero line. The gold line in the middle notes the current price. Note the big dip in the chart above the current price around $200. That's significant and I'll explain more later.
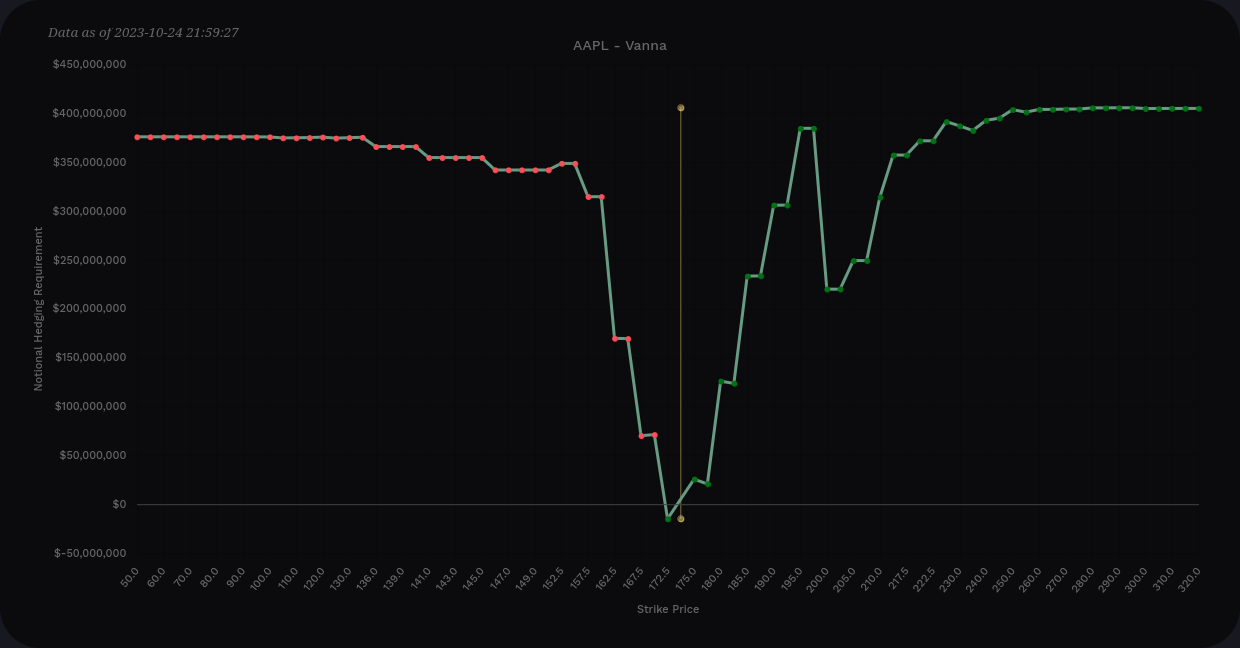
AAPL has very positive vanna here. This suggests that as volatility decreases, dealers will need to buy shares of AAPL to hedge their positions – up to a point.
However, if volatility were to increase, this chart suggests dealers will sell shares to maintain their hedges – up to a point.
You'll notice I said up to a point twice here. I'm making a point. 🤭 Vanna shows you what dealers will likely do up until a particular price point. That is where you can get the edge in your trades.
Vanna bar chart
Where the curve excels in a broad look, the bar chart excels in a more detailed look. This is the same data we saw above, but it's represented in bars to identify particular price levels.
My first step here is to look for anything out of place that isn't in line with everything else. How about that $200? Wow. That's a big area of negative vanna that will cause dealers to sell if price reaches that area. A decent volatility increase has a chance of getting stuck around that level.
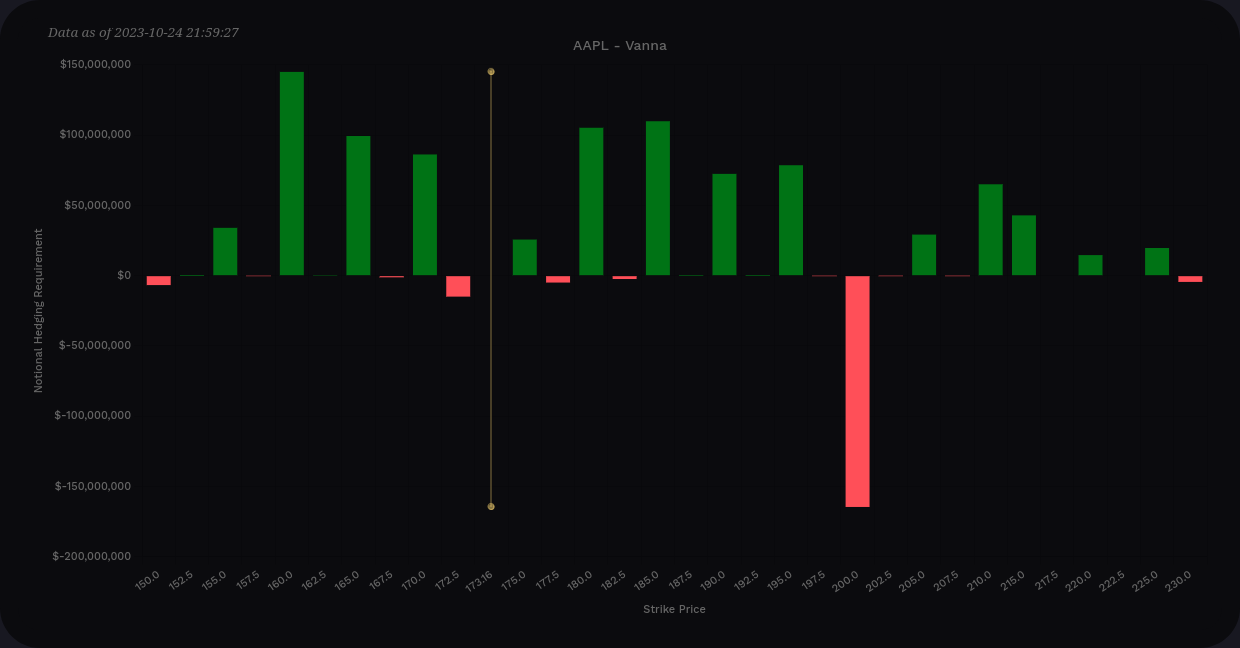
The other things I notice here is that our tallest positive bar sits around $160. If volatility increases, all of this positive vanna will cause dealers to sell shares. However, that pressure from dealers diminishes as we get to $160 because we don't have more vanna bars beyond that level.
Does it mean price will stop there? No, there are no guarantees.
Does it mean there's a good chance that the level will form a high probability level of support? Likely so. I'd also look to $200 as resistance.
Positive vanna bars act like magnets for price as volatility decreases. They push price away as volatility increases. But much like a magnet, vanna needs room to operate.
Vanna needs room to operate
Although vanna can have really strong effects on options during volatility swings, it needs room to operate. Gamma is the strongest options greek when the price is sitting right on a gamma level, but that's where vanna is the weakest. Vanna is strongest at 0.15-0.35 delta.
This chart from TalkDelta explains it incredibly well:

Notice that on the spot price of $100, vanna runs to zero. This means vanna has almost no effect on price when the price of a stock is sitting right on the vanna level. Notice that gamma is the strongest right on the strike.
Therefore, if you see a big vanna level and the price moves onto that level, consider that vanna level dead for a while. Could price move away and revisit it? Absolutely. But if price suddenly starts moving off that level, there's another greek in play and it's likely gamma.
Vanna behavior and trading setups
I often see price make its way to a particular vanna level, hang out there briefly and then begin making a move elsewhere. Typically that move is towards another vanna level on the chart.
Let's use another example from AMD this time. This chart is much quieter than AAPL's chart. Note the massive positive gamma at $110 without much above it. I love vanna charts like these because the levels are so clear.
This chart with mostly positive vanna suggests an overall bullish tilt if volatility decreases. In addition, that positive vanna runs out past $110. This leads me to think that AMD is bullish to $110 and not much more.
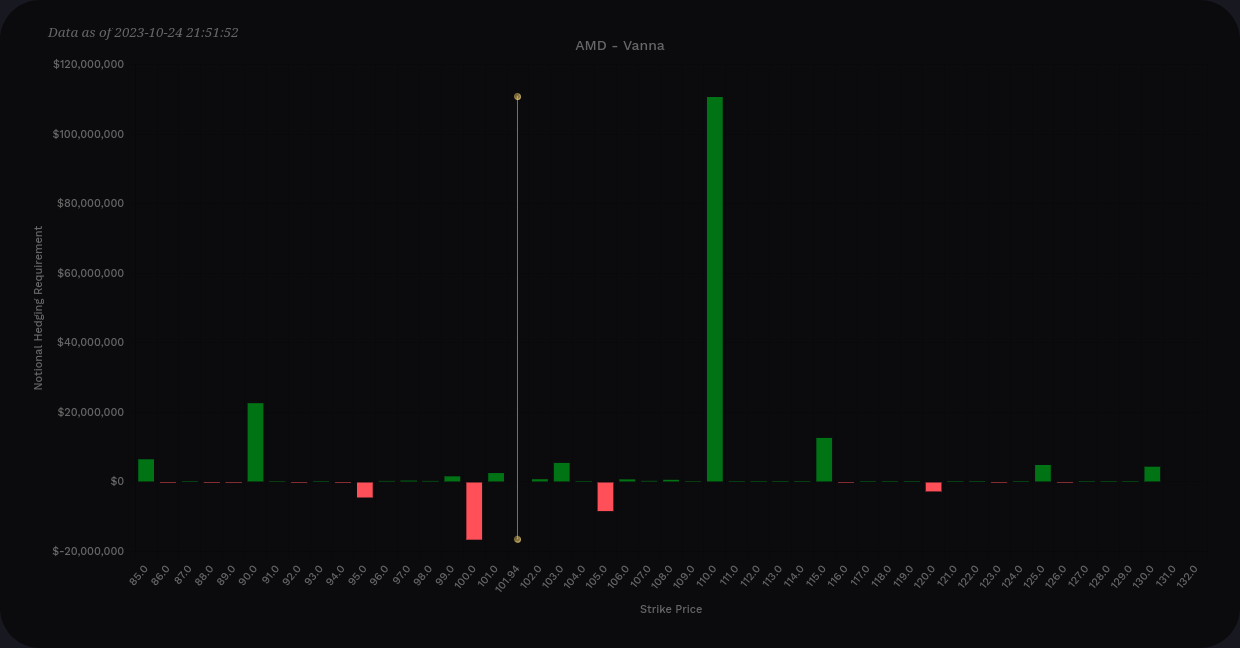
In situations like these, I often see price eventually make its way to the big positive vanna line, touch it, and then look for the next move. With no big vanna lines past $110 here, I would expect AMD to touch something near the $110 level and fall back a bit.
However, if AMD started approaching $107 or $108 and the vanna chart started showing more positive vanna at $115 or $120, I'd be thinking about bullish positions above $110 on AMD. There's just not enough there right now.
Further reading
You can read a bit more about vanna and all of the other options greeks in Sheldon Natenberg's Options Volatility & Pricing. I'm told this is the religious text of market makers and I'll warn you that this book is incredibly dense. The content is extremely useful and I pick it up as a reference guide a few times a month. Getting through it from cover to cover takes some time and you will likely find yourself re-reading chapters again.
You can also read Jason's Wizard of Ops updates on Twitter for more detailed looks at vanna and charm. He also has a blog with really detailed posts on options greeks, market makers, and the options industry as a whole.
Hopefully this post helped you! If you have questions or comments, leave them below and I'll write a follow-up post soon.
Discussion