TSLA analysis for September 26
Let's take another look at TSLA as it approaches a trend line and the 100MA line. 📈

Happy Tuesday! 👋 I'll get another look at TSLA today to see what the data shows. TSLA is in a precarious spot as it broke through two critical VWAPs: one from the recent high in July and another from the pivot back in August.
It bounced off the 100MA line and the bottom of a line drawn from bottoms since the April pivot. There's still plenty of room down to the 200MA which sits around $205.
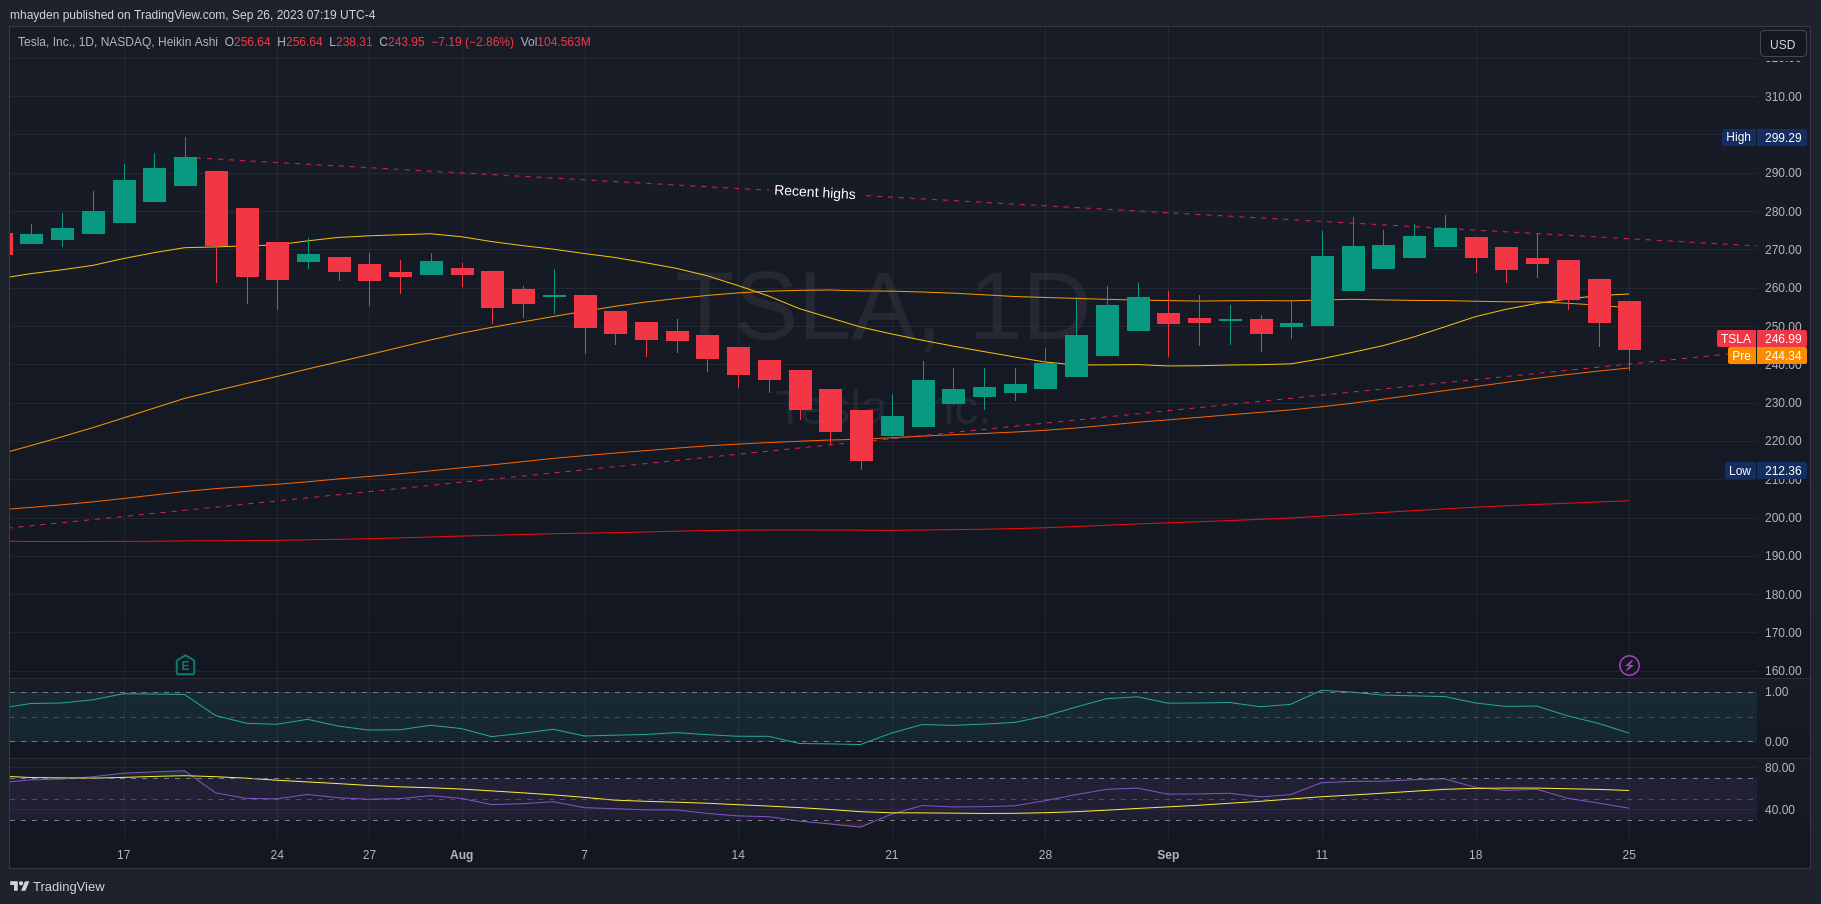
TSLA's RSI is around 40% and it's below the midpoint of the bollinger band at around 16% up from the bottom of the band.
All investments come with significant risks, including the loss of all capital. Please do your own research before investing, and never risk more than you are willing to lose. I hold no certifications or registrations with any financial entity.
Let's get to it!
Options flow
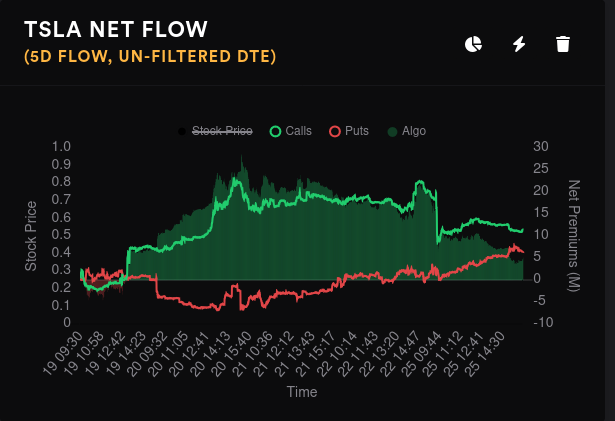
Overall flow is a blunt tool, but it gives me an idea of overall momentum. The five day shows bullishness beginning to narrow after yesterday's abrupt selloff in calls. Puts didn't come up terribly fast, but they did make an appearance:
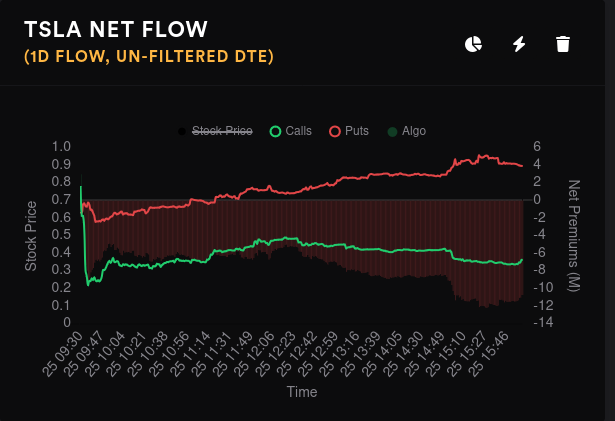
Yesterday's options volume dropped aggressively:

TSLA's IV rank sits around 7% and that means that options premium is at one of its lowest points of the year.
Dealer positioning
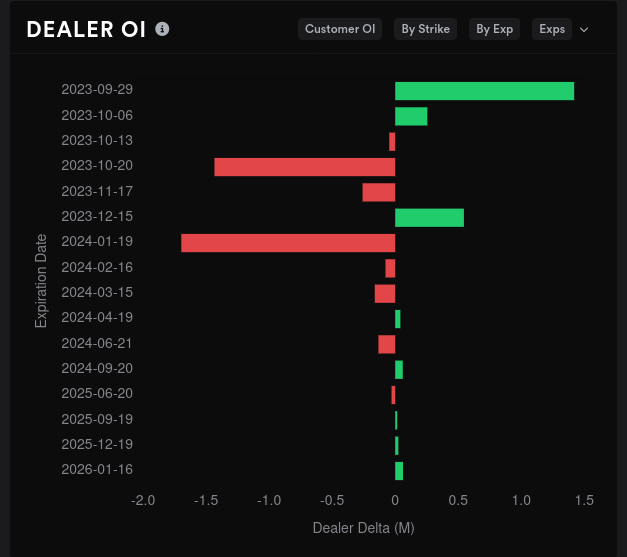
Dealer delta buildup suggests customers are currently short on TSLA with strong momentum that has shrank a little over the last three days.

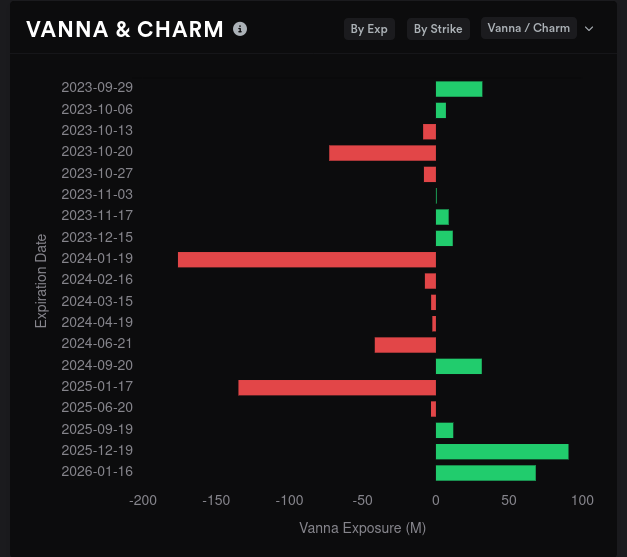
TSLA's vanna started to spread down from the 2025 expiration and we're seeing decent amounts of vanna showing up on upcoming expirations, most notably 10/20. This suggests vanna might play a stronger role in TSLA's price moves in the shorter term.
Both 10/20 and 11/17 look bullish based on dealer positioning. January 2024 has been bullish all along with plenty of bets on $300. I wonder if those bets are still there? 🤔
Vanna
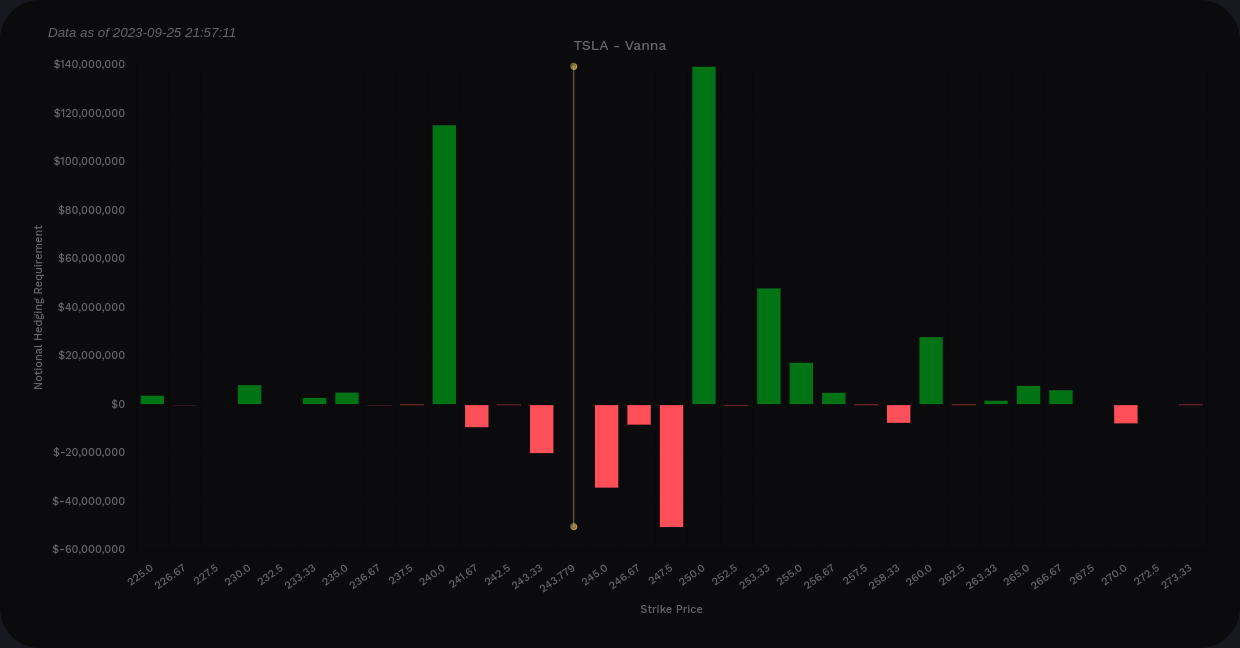
With the VIX being a bit elevated, bullish traders are looking for positive TSLA vanna above price to help pull price upwards. Unfortunately, traders are getting a mixed bag here.
On aggregate, vanna is quite positive, which is good for bullish traders if IV contracts more. The downside here is that there's a negative vanna zone between $240 and $250 that will slow down upward moves, even if IV contracts. However, the positive bars are much taller and they could outweigh the negative vanna shown here.
We're likely to see a pull to $250 here. Could we exceed that and get to $260? There is a little bit of positive gamma sprinkled in there but I'm not sure it's enough to get us there.
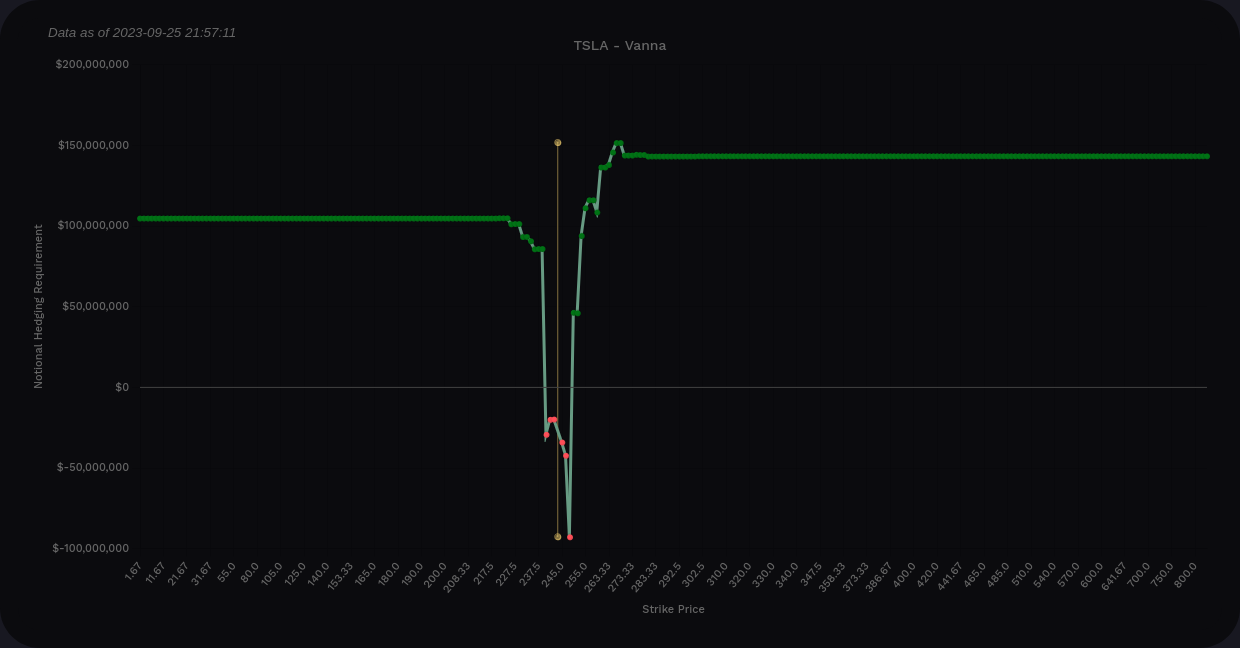
If you're trading through 11/17, here's the vanna chart from now until then. Not much here except a potential pull towards $250.

Gamma exposure
Let's start with the aggregate view. We're sitting on a small resistance level now (white bar) and we have resistance ahead at $257.50. If we get past that, our first big price magnet shows up at $265. It's nice to see $300 on here as well, but that's a far reach from the current price.

The biggest GEX dates are 9/29, 10/20, and January 2024.

9/29 suggests a run to $265, but we have some decent resistance levels in between:

10/20's biggest level is $250, but there's a secondary level around $230. $220 looks like a big resistance level for any moves to the downside. TSLA earnings are 10/18!

January 2024 is where everyone is lining up their $300 bets. There are some secondary levels in the $260's. Keep in mind that this is still a long way out and it's not supported by vanna for the moment.

Whales
Traders that throw down big sums of money into options trades can sometimes give helpful clues about the market. On aggregate, there were some big bullish bets on $260 that are still being held.
Someone's also betting bullish on $240 and still holding that position. $265 and $270 moved bearish on Friday. (These last two are mainly showing up for 9/29 only.)

Someone is making bullish bets on $250 after TSLA's earnings.

Dark pool trades
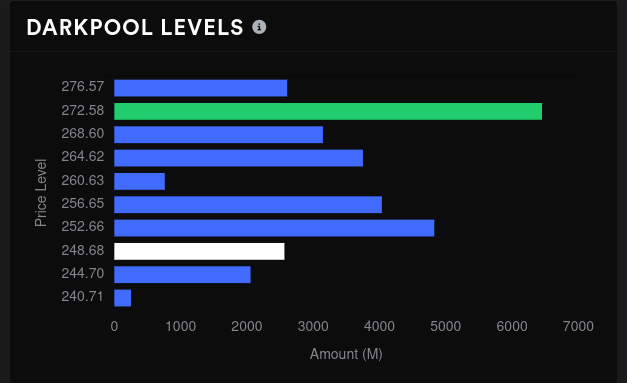
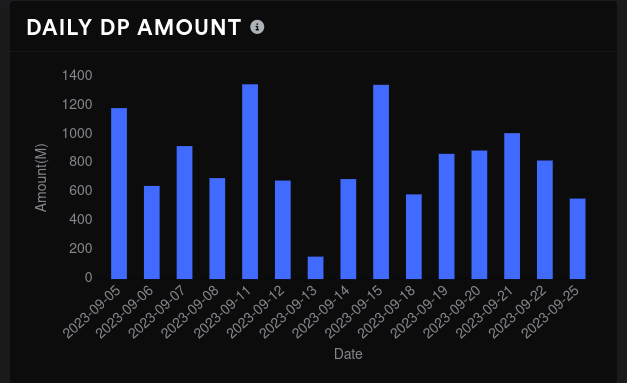
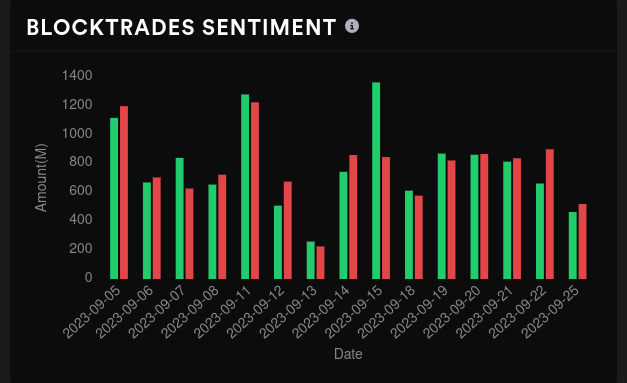
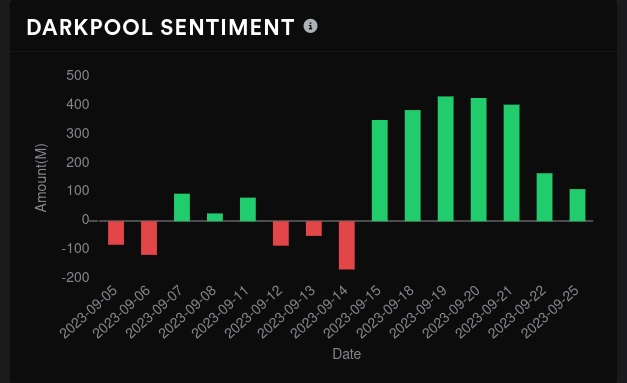
The most volume shows up here around $272 with another volume shelf around $252-$257. Sentiment is headed towards the middle line with volume gradually decreasing.
Thesis
We're in rocky territory right now with TSLA. There's evidence that traders are making bullish bets on it, but it just broke through some VWAP lines and it's approaching the bottom of a trend line up from the April pivot. If TSLA loses support from the trend line and the 100MA, there's a decent drop down to the 200MA around $204.
However, there's decent evidence that $220 might be a support level again based on GEX data. We had a good bounce in August from that $212-$215 level but I'd rather avoid revisiting that one again. 😉
I'm sitting on some shares as well as short puts at $250 and $260, both expiring this Friday. Looking back, I made these trades as bets on support levels without noticing that the rest of the market was seeing bets on a downtrend as we headed into October. Late September has some bearish seasonality to it and that was something I totally missed.
I still think TSLA has some bullish potential around this $240-$245 level and if I didn't have trades on the board already, I'd consider some bullish bets around this area if we dip a little more this week.
Good luck to everyone! 🍀


Discussion