TSLA analysis for January 17

TSLA's descending trend line looms large on the chart, but could we be seeing the first signs of a turnaround at a repeat of last summer's lows? Let's dig into the data. 🤓

There's been no shortage of news around TSLA lately, but that seems to be fairly common. They make lots of products that changed the game around electric powered things and the company leadership is ... well, I'll just stop there. 😉

But this blog isn't about news and pundits, it's about data! 🤓
All investments come with significant risks, including the loss of all capital. Please do your own research before investing, and never risk more than you are willing to lose. I hold no certifications or registrations with any financial entity.
Let's get a look at TSLA's data and see what trade makes sense here.
Long term
If we look at TSLA on a weekly chart since the all time high at the end of 2021, there's a clear trend line down since then. TSLA has come back to touch this trend line multiple times and then bounces off for a move lower. It hasn't had a weekly close above the line yet.
Since the high at $414.50, the heaviest volume sits around $256 and our current price as of this morning is around $216. It made some higher lows since the beginning of 2023, but the most recent run since the summer of 2023 shows lower lows and lower highs.
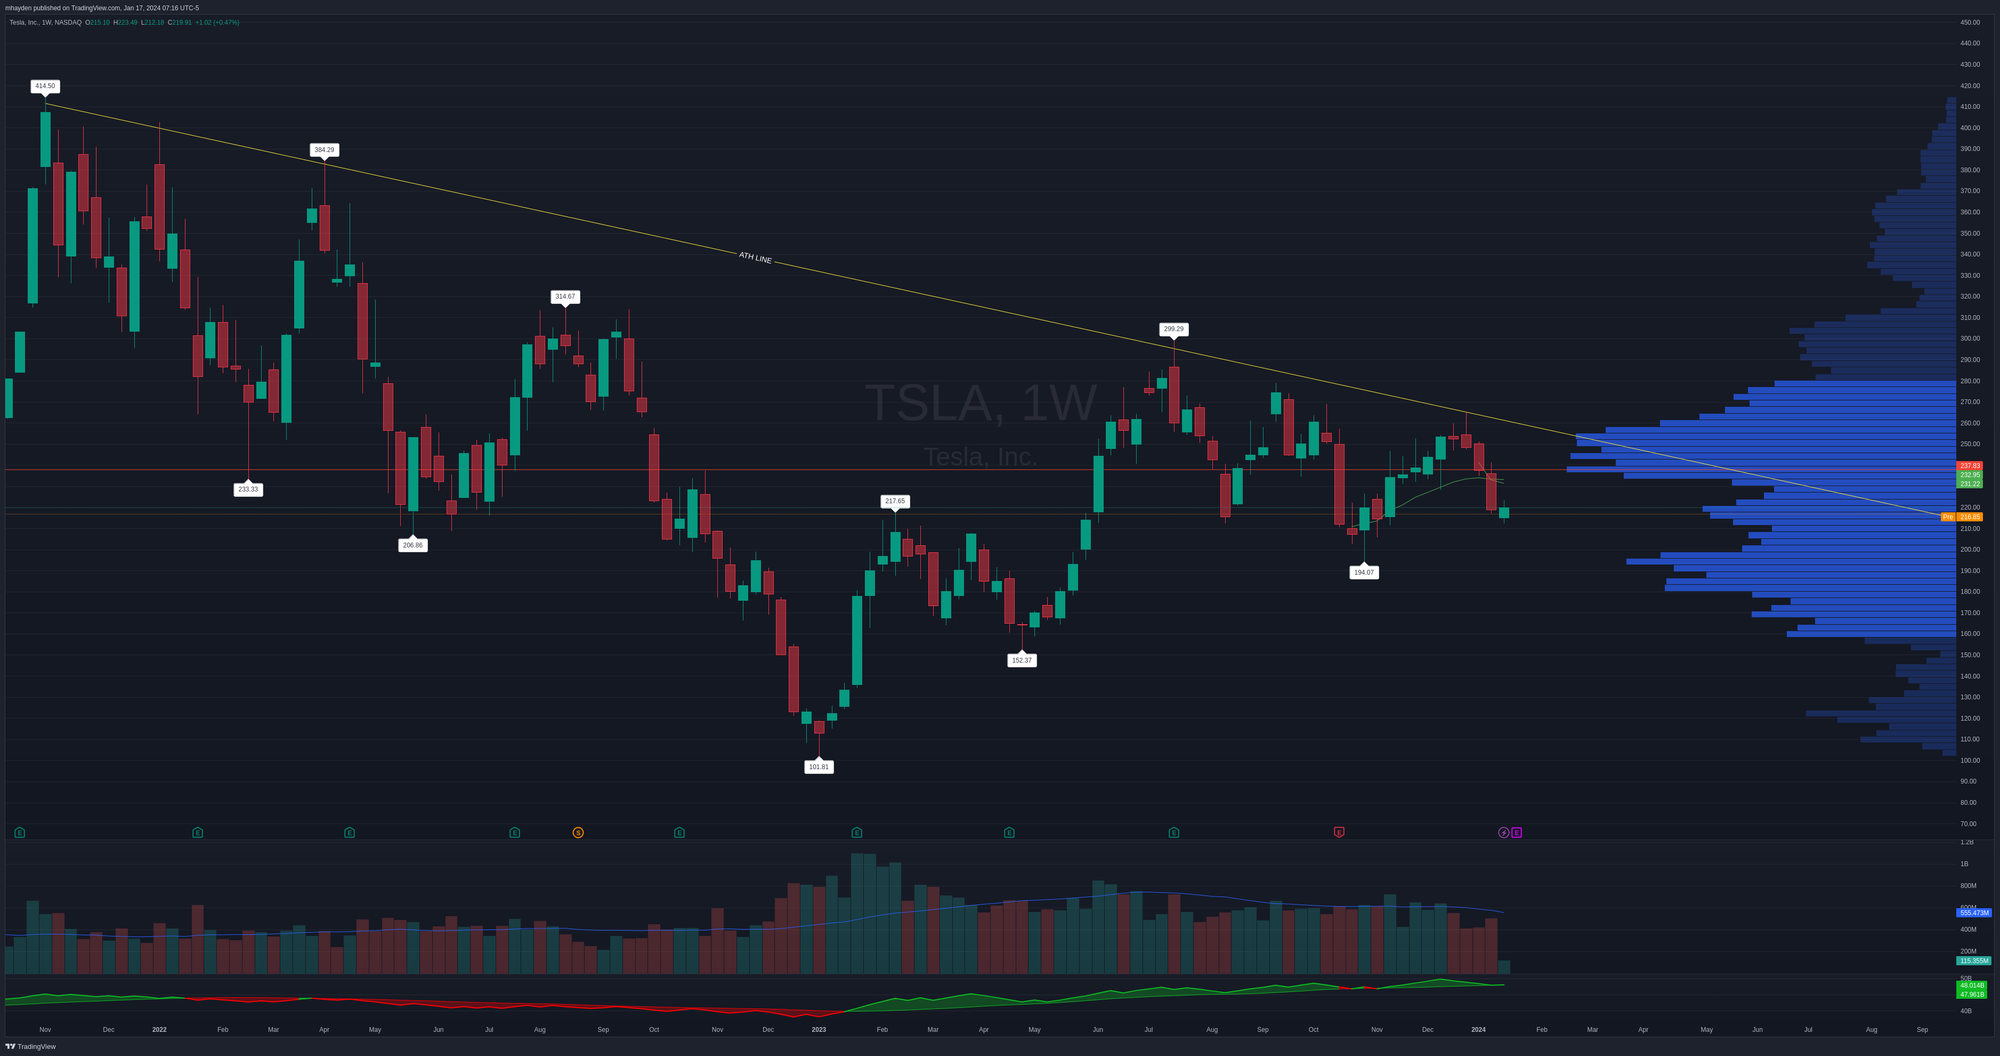
One thing to note is that the trend line of TSLA volume has trended downwards since the summer time. If we're really entering a strong downward trend, I'd expect the volume to increase a bit as we head down. The on balance volume indicator suggests there is some bullish volume in there, but it isn't moving the price in a sustained way.
Since the lows
Let's get the bad news out of the way first and then look for a silver lining:
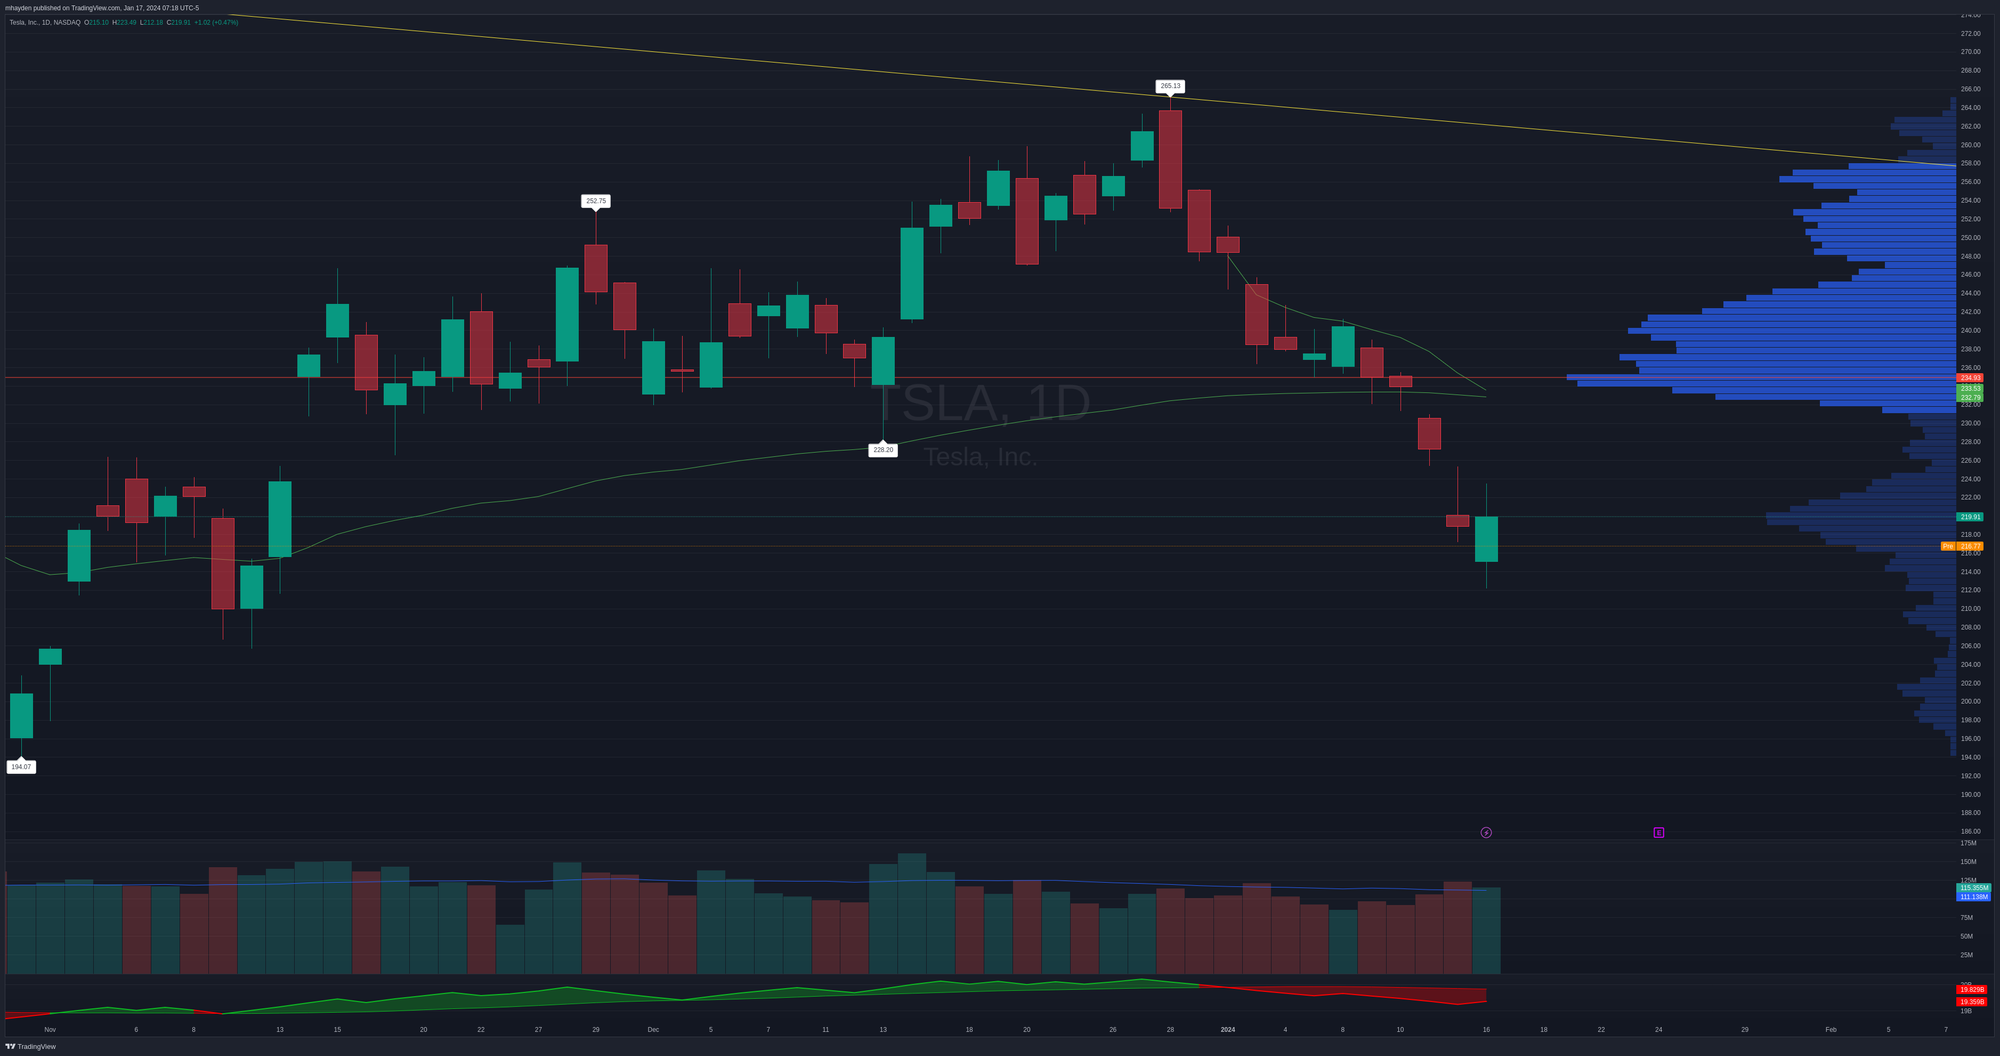
- TSLA hasn't been above its year to date VWAP line yet and it recently fell through the earnings VWAP like a knife through butter.
- TSLA sits well below the point of control (PoC) on the volume by price (VBP) indicator on the right side (the red line around $234.93).
- The recent run downwards from $265.13 came on increasing bearish volume, which tends to confirm the trend.
How about the optimistic take?
- TSLA's most recent daily bearish bars don't match up well with the volume bars. This signifies we have greater effort from traders than what we see reflected in the price. Wyckoff talked a lot about effort versus results. When one doesn't seem to be matching with the other, a change in trend could be happening.
- TSLA has good volume and liquidity around $219 and price likes to seek out areas of higher liquidity. If we do get a bounce here from higher volume, we face a resistance zone around $224-$232 with out next stop around the PoC at $235.
- The area around $214 corresponds to a big low from August 2023. Yesterday's candle attempted to break below that level and failed to do so. There's some upside risk here from that level.
Institutional levels
Volume Leaders shows heavy volume from institutions that trade various stocks and these levels could give us hints about liquidity levels we might be missing in the chart.
Here are TSLA's top 10 trades over the last year:
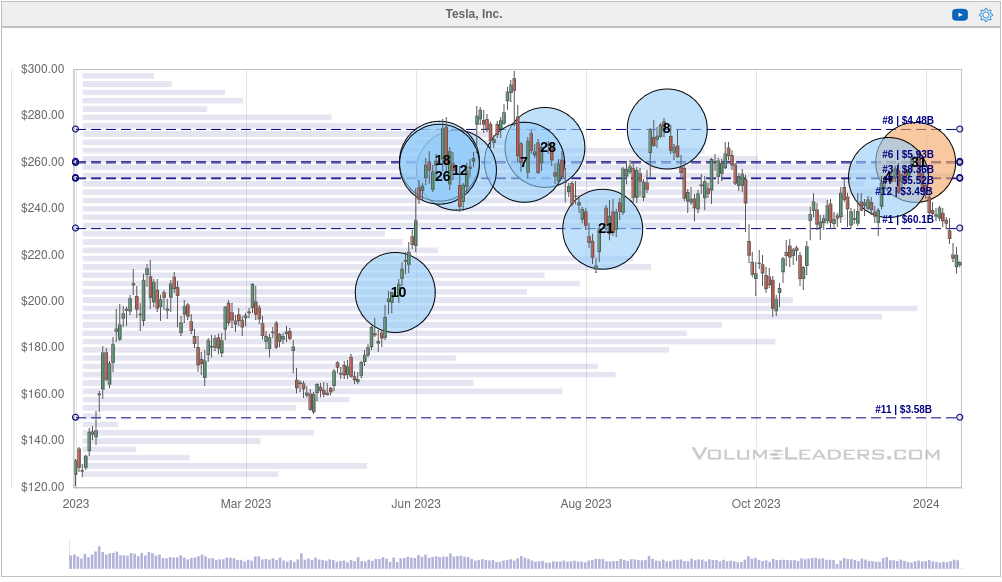
$231-$274 is a very hot range of trading since June 2023. $231.70 is the number one volume level over the past year. That's a big level of consolidation for TSLA recently where it tried over and over to break the level and finally did it this year. It also matches up with our PoC from the VBP indicator.
We can also pull a chart that matches the timeframe of our daily chart above:
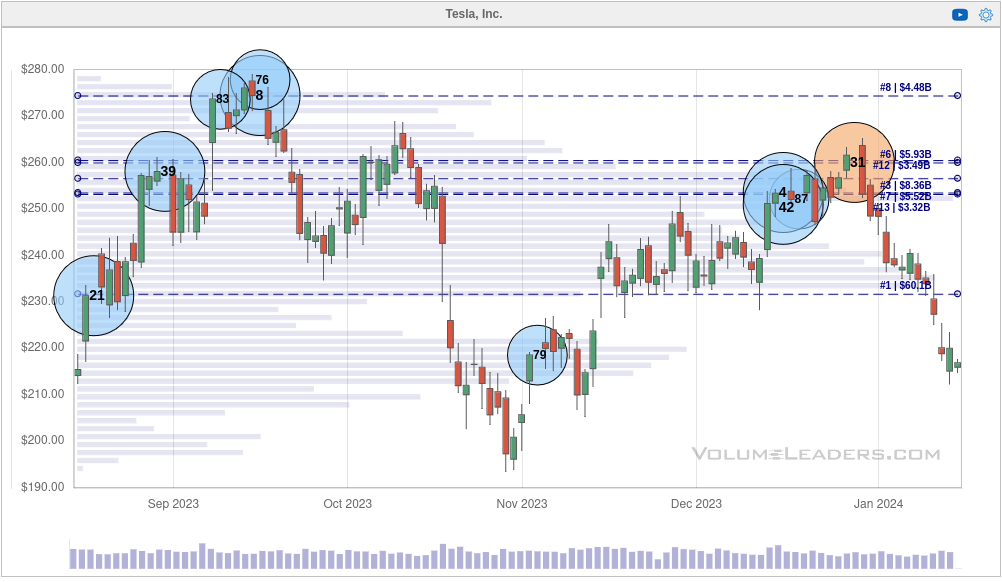
We can see some massive institutional trades at the lower high recently around $260. We're sitting at a level now where a big #79 trade came through at $218. Will institutions make trades here again? I'm not sure. TSLA has respected this downward trend for quite some time.
Thesis
TSLA sits at a crossroads right now.

It's just below some big volume areas and it's resting on a support level. However, even if we do get a rally, it needs to break through the descending trend line which is likely going to sit around $240-$250 if or when TSLA makes a rally.
I sold a $185 put on TSLA expiring on March 15th. It's well out of the fray of the current pricing and that gives me a little wiggle room before earnings. I'm not looking for much exposure to TSLA right now and I doubt I'll sell anything else on it until I've seen the earnings reaction from the market.
Good luck to all of you this week! 🍀
Discussion