TSLA Friday analysis for 9/29

Is TSLA ready for another bull run? What's going on with $300 for Jan 2024? 🤔

Happy Friday! I'm jamming out to some awesome synthwave this morning and feeling strong 1980's vibes. I hope your Friday is getting off to a great start. 🌄
I'll dig into the data for TSLA today to see where we might be headed. I'm getting a between two ferns gut feeling as we're sitting in between some pretty big price levels.

But before we get right into it:
All investments come with significant risks, including the loss of all capital. Please do your own research before investing, and never risk more than you are willing to lose. I hold no certifications or registrations with any financial entity.
Okay, let's get into it.
Options flow
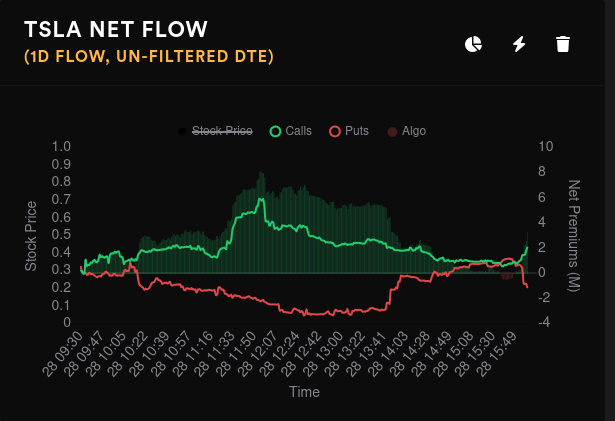
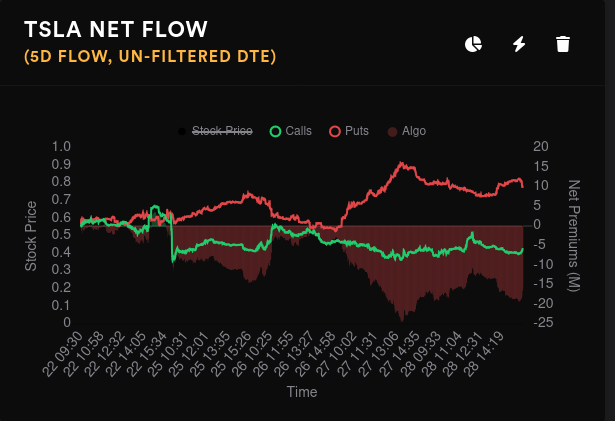
Aggregate options flow gives me a good idea of overall trader momentum on a stock and I usually take a look on one and five day time frames. In the longer term, TSLA has a bullish pattern, but the divergence isn't terribly strong. We saw a divergence over 40M a week or two ago!
On the daily, traders were bullish on the open but it seemed like the market ran out of volume to move higher. A little bullish run started going just before the close.
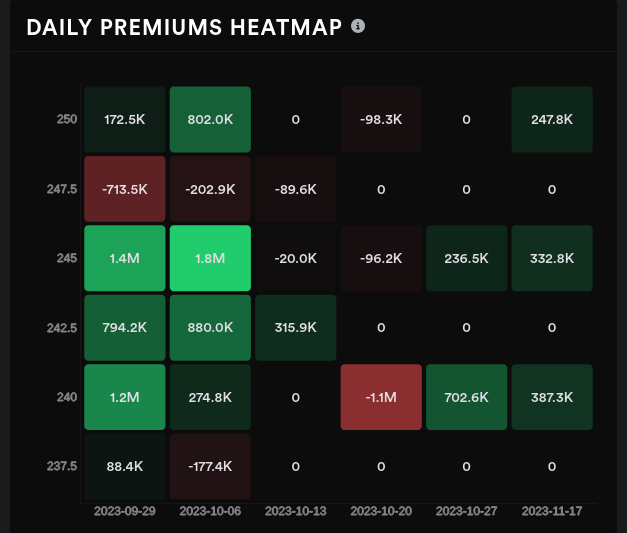
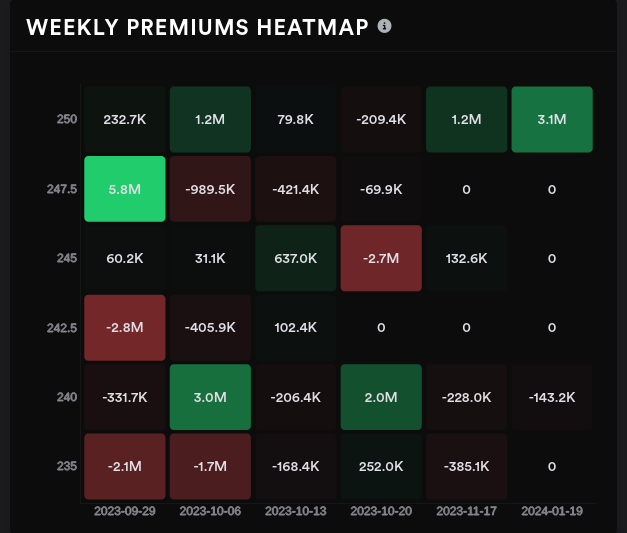
The majority of the bullish attention yesterday fell on the $245 strike for next Friday, 10/6. On the weekly premiums, $240 received more bullish volume for 10/6. Looking further out, January 2024's $250 strike saw a big increase in bullish premiums.
Dealer positioning
TSLA's current dealer delta buildup suggests that dealers are long and customers are short. However, the 15 day momentum on this indicator is on a run to the middle line. Bearish dealer delta buildup (red lines on this chart) have typically signaled or coincided with bullish moves in TSLA stock.
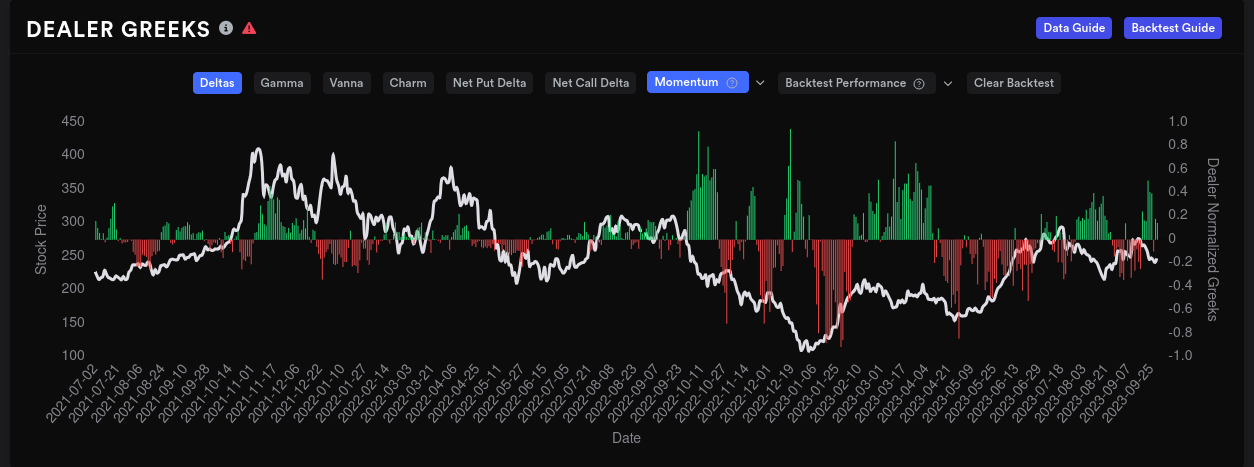
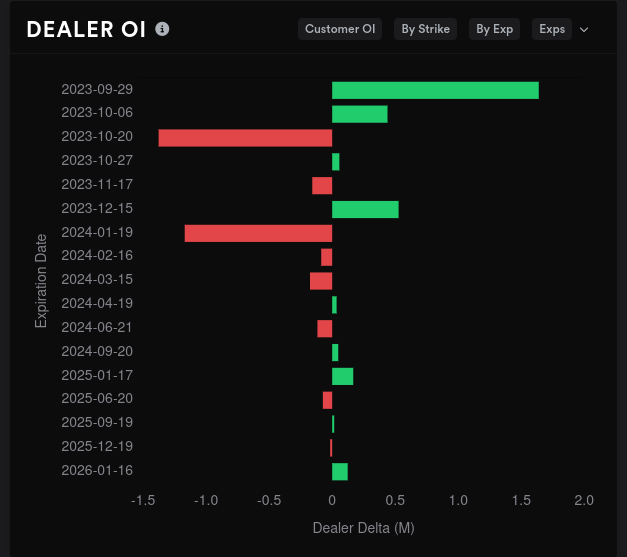
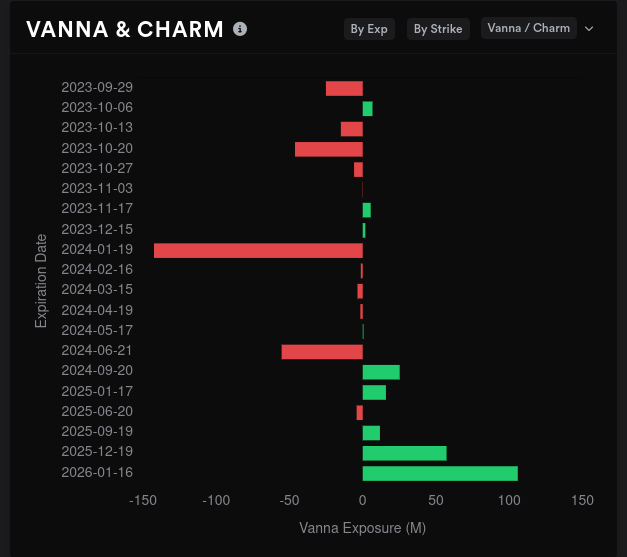
10/20 and January 2024 are the most bullish expiration dates on the chart. If you remember recent posts here, the $300 strike for January 24 has received a lot of attention. Most of TSLA's vanna is packed into January 2024 and far off LEAPS contracts in 2025/2026. The vanna we do have for January 2024 is mostly negative, which suggests lower IV might not pull TSLA to the upside.
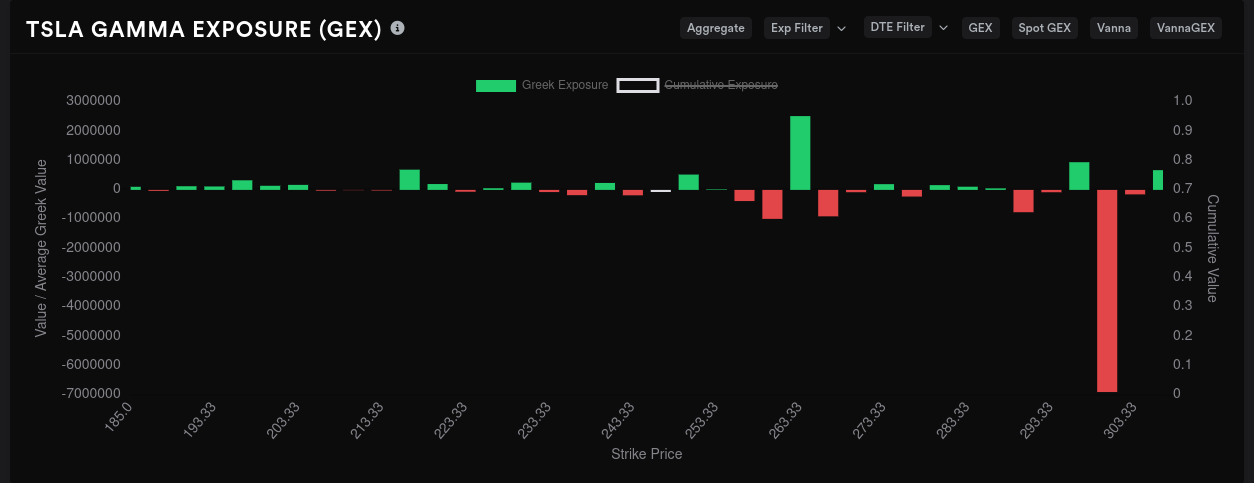
Gamma exposure
TSLA is famous for just doing whatever the heck it wants relative to options data, but GEX is a helpful guide of sorts to help with directionality. I wouldn't use it as a map for planning trades down to the strike, though. TSLA often blows through these levels like they don't even exist.
Aggregate GEX suggests shows some scattered price targets around $245, $265, and yes, $300. Downside resistance comes in heavy at $240 and that might be our base for now. (There's a big order block down in that area, too. More about that in the chart section!)
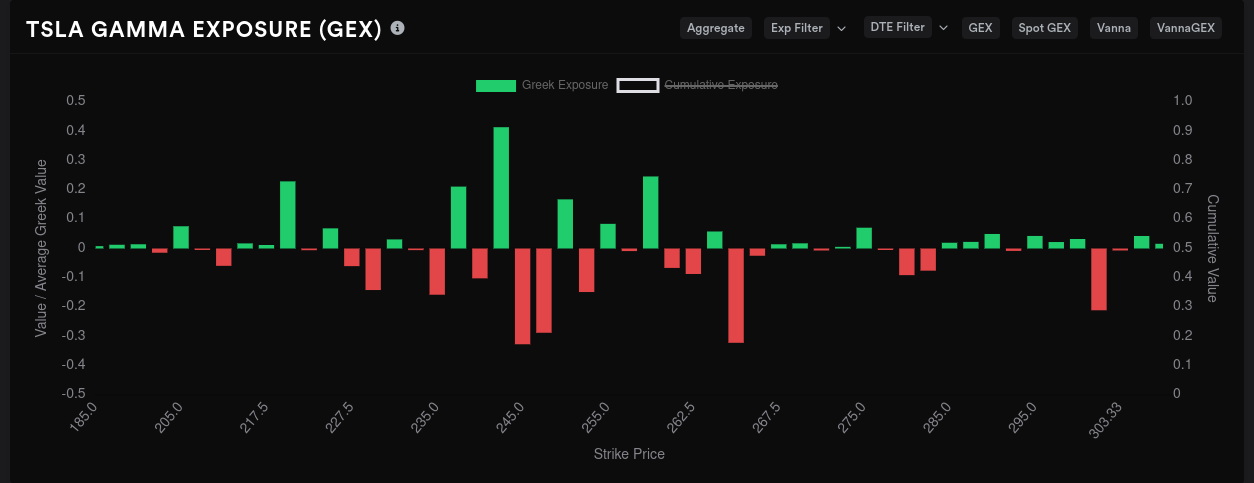
TSLA's GEX really started spreading out this week. There used to be one or two big expirations but now there are bets scattered across multiple dates. 10/20 and January 2024 look huge, so we'll take a look at those.

10/20 shows strong resistance at $220 with a price target area around $250-$255. There's a key difference here when compared to the aggregate chart, though. The $240 resistance is largely missing and $230 is a much larger price target in relative terms. That's something to watch as the lower $230's have a big unmitigated order block there.

January 2024 is bananas. Just bananas. 🍌 $300 is massive here. There's a decent resistance zone in the lower $260's but we won't see much resistance showing up here until we're within one or two monthly expiration dates.
Chart
Here's an excerpt from TSLA's four hour chart starting on 9/21. I've added the GEX lines from above to the chart and I'm also using LuxAlgo's Price Action Concepts indicator on TradingView.

TSLA fell through the $240 negative GEX, hit the top of a sizeable order block from August 24th and ran back up. Ideally, I'd like to see TSLA come down and mitigate this order block, which means price action would run down to about $228 and possibly retest that area before going higher.
There's that area of negative GEX for 10/20 at $230 and I wonder if that's potentially what traders are looking for as well. If we do reach down into the upper $220's, I'd expect another nice bounce like we saw during the summer.
If we zoom out to the daily, we can pick up some other trends:
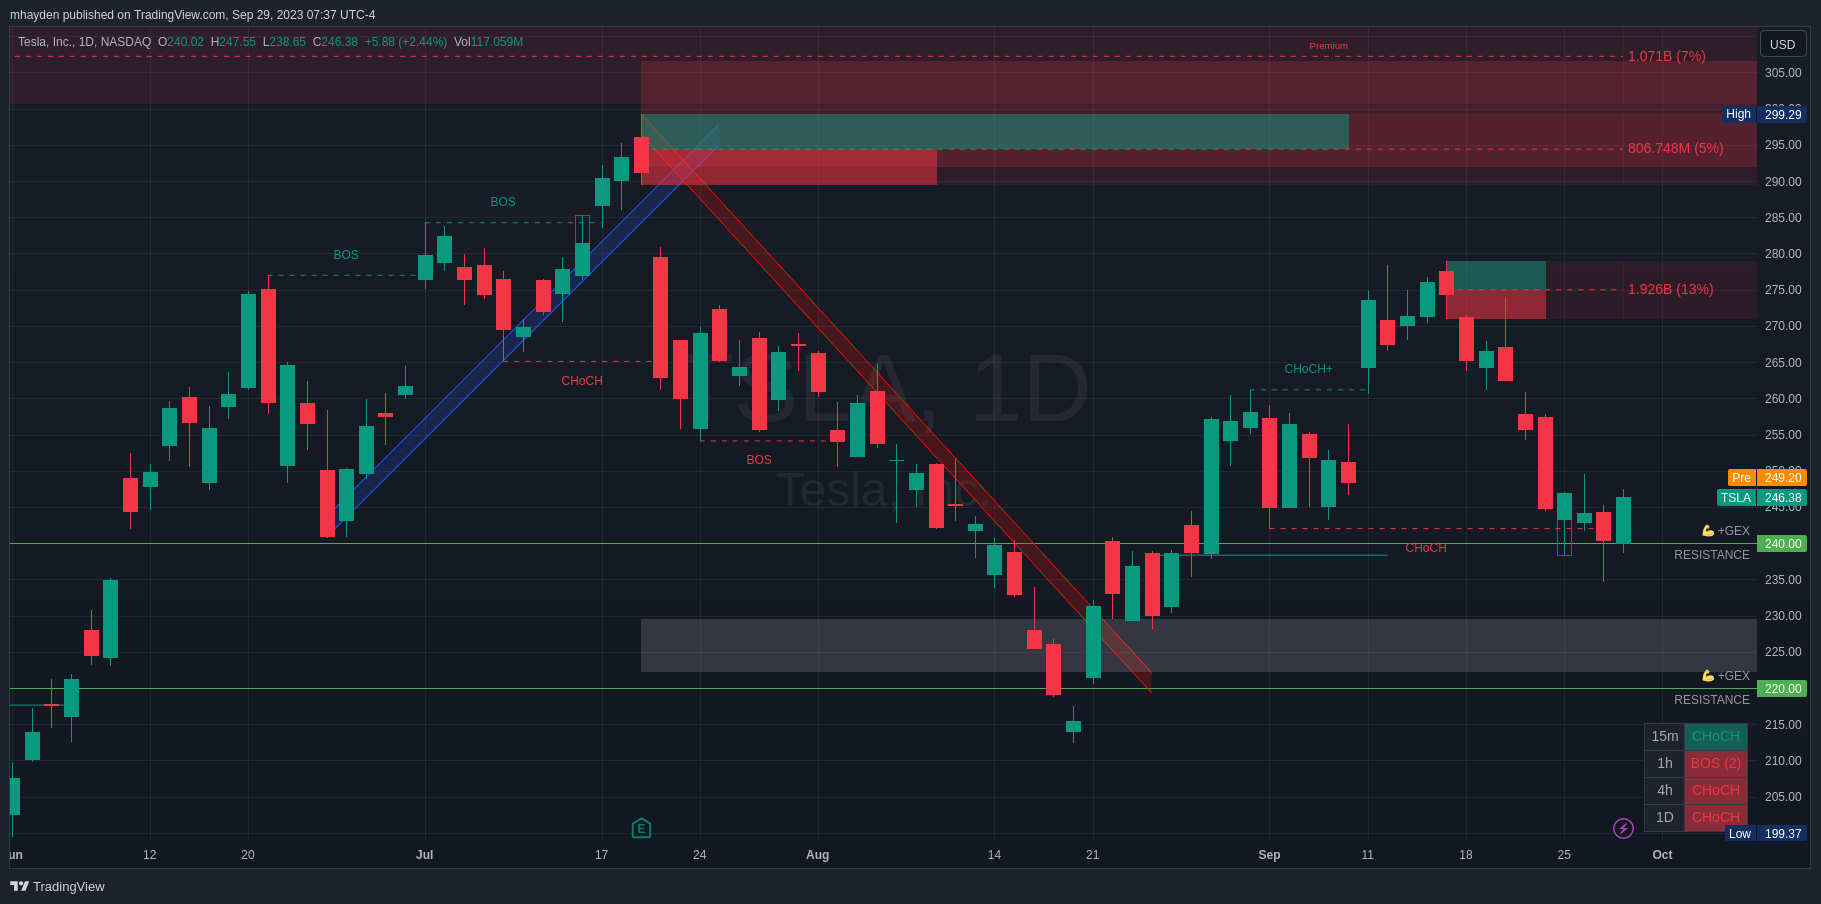
The daily chart has a grey zone in the $220's which is the equilibrium area for price since the most recent high back in July. This is yet another reason why I think we might retest a bit in the $220's before going higher. We're still bearish on all timeframes except the 15 minute timeframe.
If we're done dropping, then our next target is around $270-$280, where we have another order block. This one was fairly balanced among bulls and bears, so we might see some turbulence in that area.
Thesis
I'm glad to see TSLA starting another move up, but I feel like it still has some work to do to build a base. There's no doubt that January 2024 is shaping up to be a bull run so far. What happens in between now and then is a big question.
I had a $260 put sold for this Friday, 9/29, and I bought it back yesterday for a loss. That was a lot of risk on the table in case we moved lower today to do some retests.
Instead, I sold a $220/$265 covered strangle expiring 10/6 for $4 in premium. This is a bet on a retest as well as a bet on TSLA being hemmed in around $265-$270 next week. I also sold a $230 put for 10/6 as a slightly more aggressive bet. The breakeven for that one sits in the equilibrium zone for price down from the recent high.
Good luck to everyone out there! 🍀 Have a great weekend.
Discussion