TSLA pre-earnings check for 10/18

TSLA's earnings call is just hours away. How are traders positioned in options contracts and what can the chart tell us? Let's find out. 🤓

TSLA reports earnings after the market closes today and I haven't taken a good look at TSLA since the weekend. Today's post will dive into TSLA's options data and the chart.
All investments come with significant risks, including the loss of all capital. Please do your own research before investing, and never risk more than you are willing to lose. I hold no certifications or registrations with any financial entity.
I'm charged up. Let's go! 🔋
Options flow
TSLA had a bullish tilt all day yesterday starting shortly after the market opened. It finished the day with a decent bullish gap.
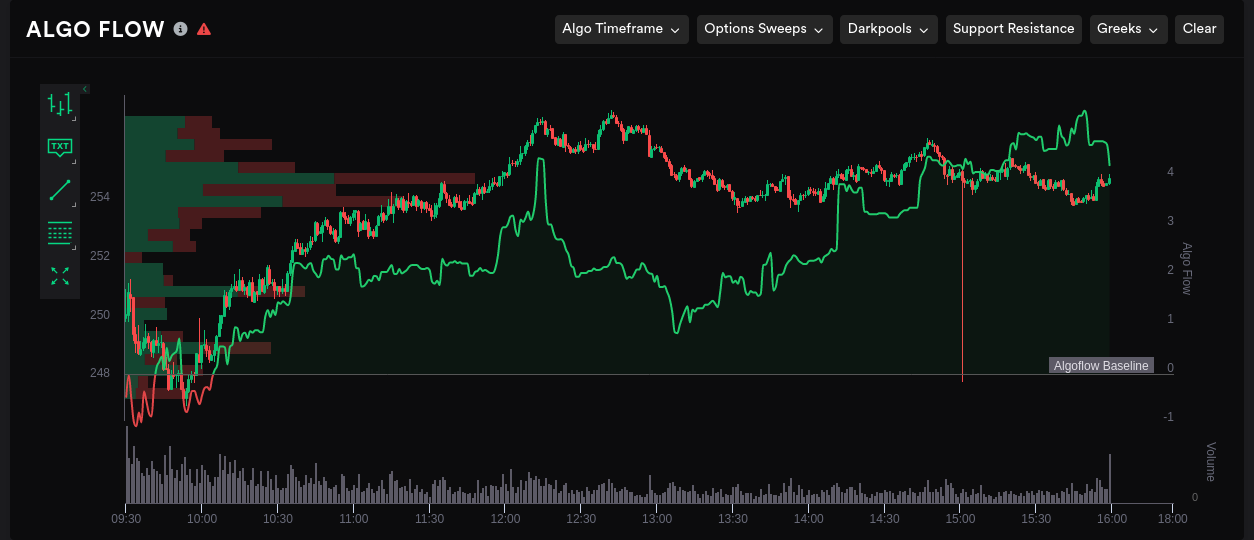
Before we get too excited about that, note that the past two days have seen very little options volume. I assume this is because everyone has their earnings bets and hedges already set and there's not much reason to make adjustments this late in the game.
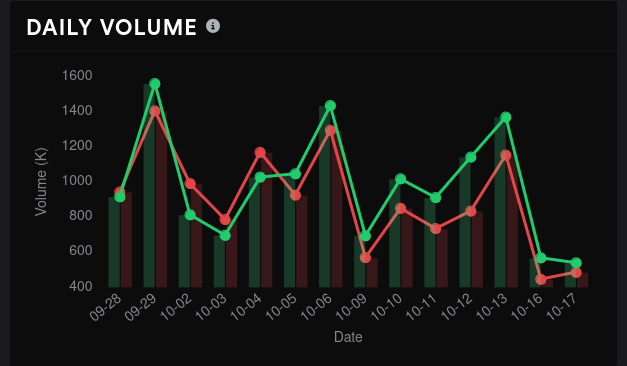
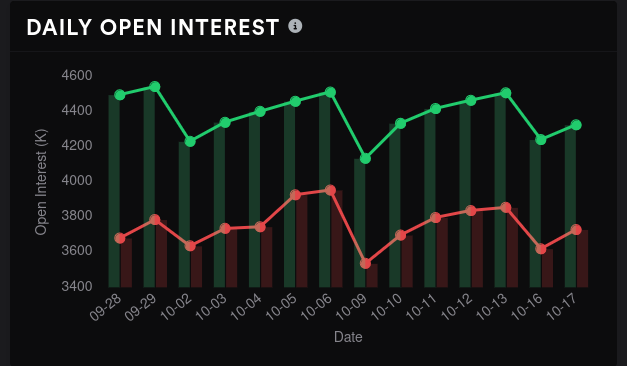
TSLA volume + open interest
Vanna
I've talked a lot about vanna on this blog in the past, but just as a reminder, vanna measures how quickly deltas change when the implied volatility (IV) changes. Bullish traders want to look for situations where IV is contracting and stocks have mostly positive vanna. In these situations, price often gets bullish pressure applied.
For such a volatile stock, TSLA's vanna is incredibly boring. Vanna is positive by about a 3:1 ratio and it tops out around $260. On the lower end, negative vanna stops around $250. This leads me to think that an IV crunch (which often happens after earnings) would take us to someplace around $260. An IV expansion (if earnings numbers are bad, perhaps) might carry us to $250.
Then again, this is TSLA, and the valuation is crazy. Anything can happen.
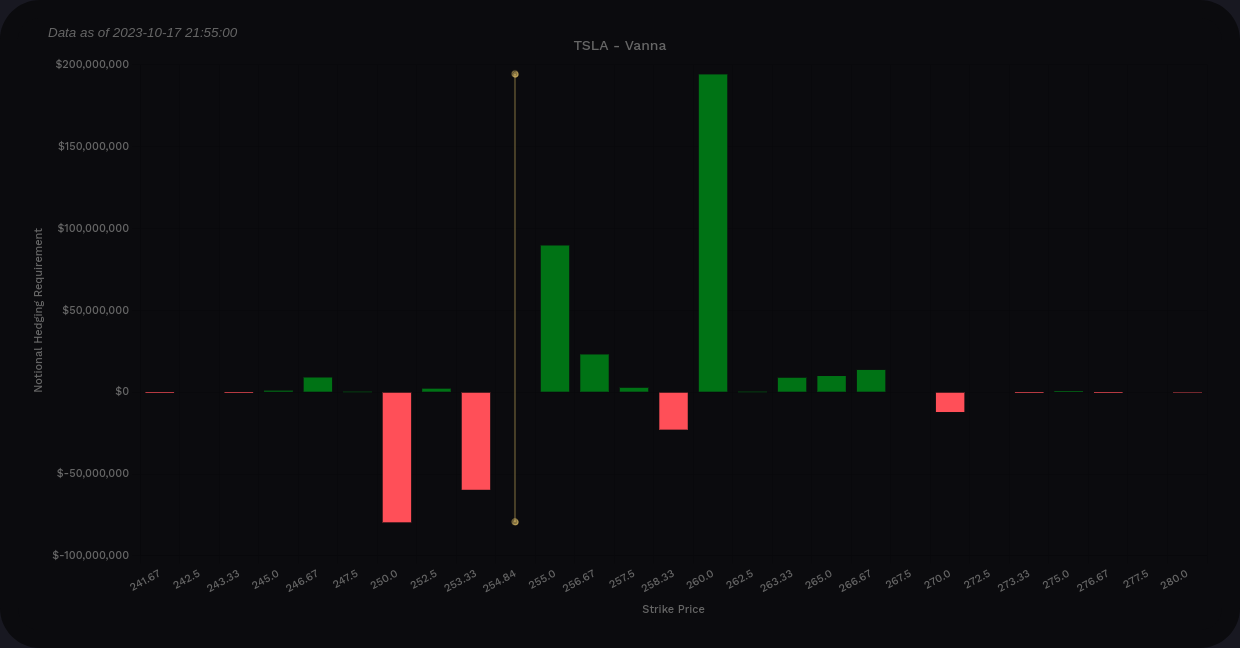
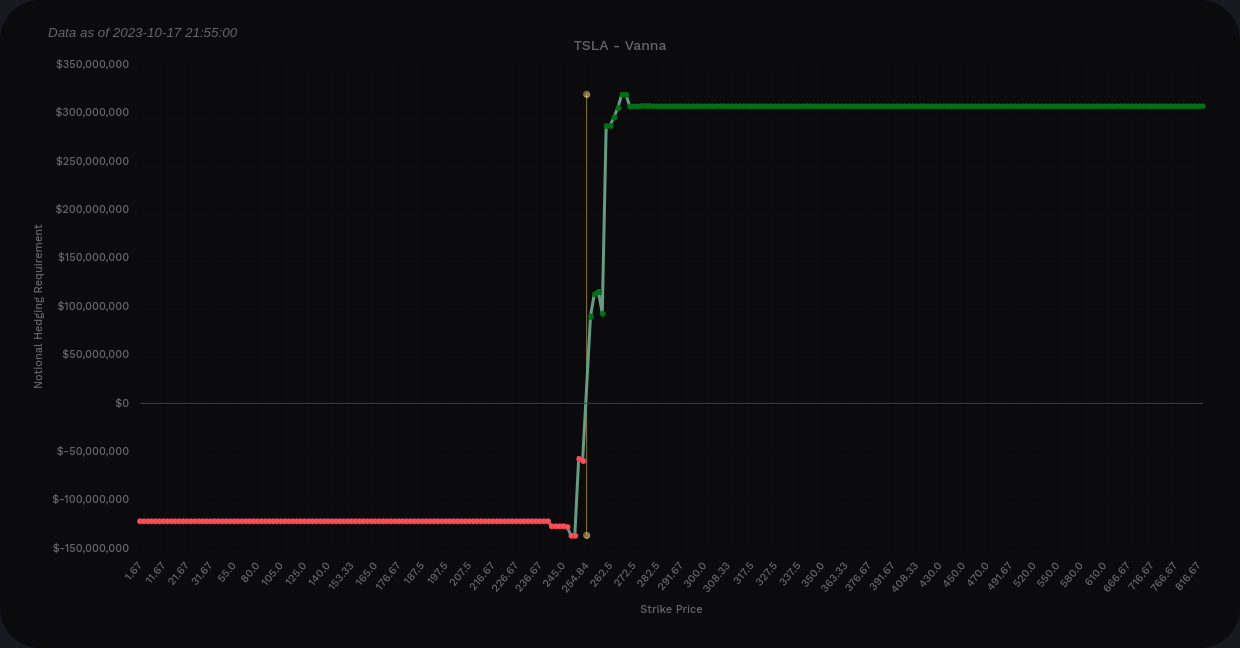
TSLA aggregate vanna from Volland
When I say this vanna chart is boring, I mean it. TSLA is quite volatile with plenty of arguments over its valuation. However, compare TSLA's vanna chart to another very volatile stock: NVDA.

I'm not sure why these two are so different. If you know the answer, let me know.
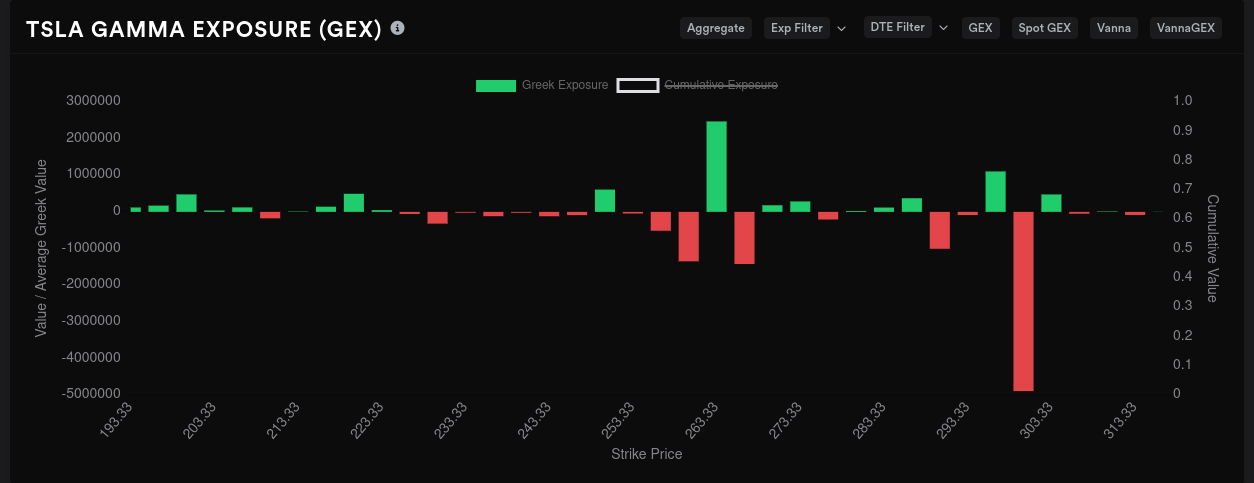
Gamma exposure
So vanna suggests a $250-$260 range. What does GEX suggest?
For these charts, I immediately look for the longest red bar, or a grouping of several relatively long red bars. These negative GEX areas often act like magnets when price moves near them. In this case, our biggest magnet for price is $250, but we have a little range from $250-$265 with fairly negative GEX.
We get some downside resistance in the $240's and upside resistance in the $270's and $280's.

This Friday's expiry, 10/20, shows many of the same patterns. Downside protection at $240 is stronger and we have the same range of movement from $250-$265.

11/17 is TSLA's next largest expiry and the biggest price magnets appear at $250, $275, and $290. Resistance is strongest around $230 and $300. The range certainly opens up here, but I won't trust this fully until I see some kind of movement in vanna.

And then the one everyone is excited about: January 2024. This is where the mysterious $300 strike has been going crazy for a month or two. My only problem with this is that I can't find anything that suggests we will be pulled up to that level by then. Earnings could change things, however.
Dealer positioning
Dealers have been short TSLA for quite a while with only a few interruptions. This suggests that customers have been bullish on aggregate through these last few months. Although this doesn't backtest extremely well for TSLA, generally this suggests an overall bullishness from customers.
Bear in mind that the last earnings call in July showed positive surprises on earnings and revenue but the stock gapped down and kept rolling over. Dealers were very short around that time even as the stock rolled down. There's always the chance we could get a similar response this time.

Whales
Traders that throw large amounts of money into options contracts sometimes leave hints of where price may go. On the aggregate, they all seem to disagree with one another.

10/20 in isolation shows bearishness on $240 and bullishness for $265. Where have we seen these numbers before? 🙃
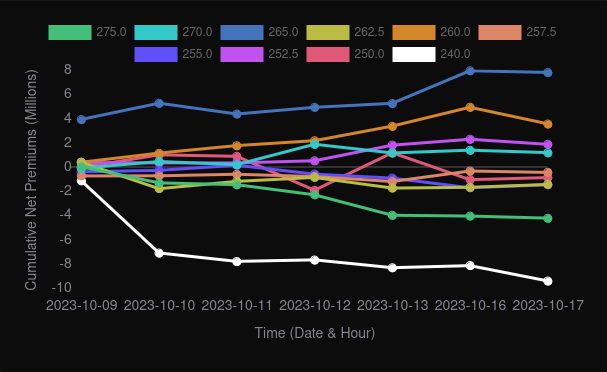
11/17 suggests bullishness on $235 with bearishness on $240 and $250.

Chart
A weekly chart since May shows that we made an order block around $160 and ran through the equilibrium zone to another order block made at the highs back in the summer of 2022. We came down off that block, bounced off the equilibrium again, and got stuck in a consolidation.
We're still above the trend line, but we've definitely been consolidating in a tight range.

A daily chart since August 2023 suggests we're in a bullish trend, but price finished below the trend line over the last couple of days. Upward movement will likely be limited by the order block starting at $272. The grey zone is the equilibrium zone between the premium/discount zones (part of ICT concepts). We might get support again from that $230 equilibrium zone.

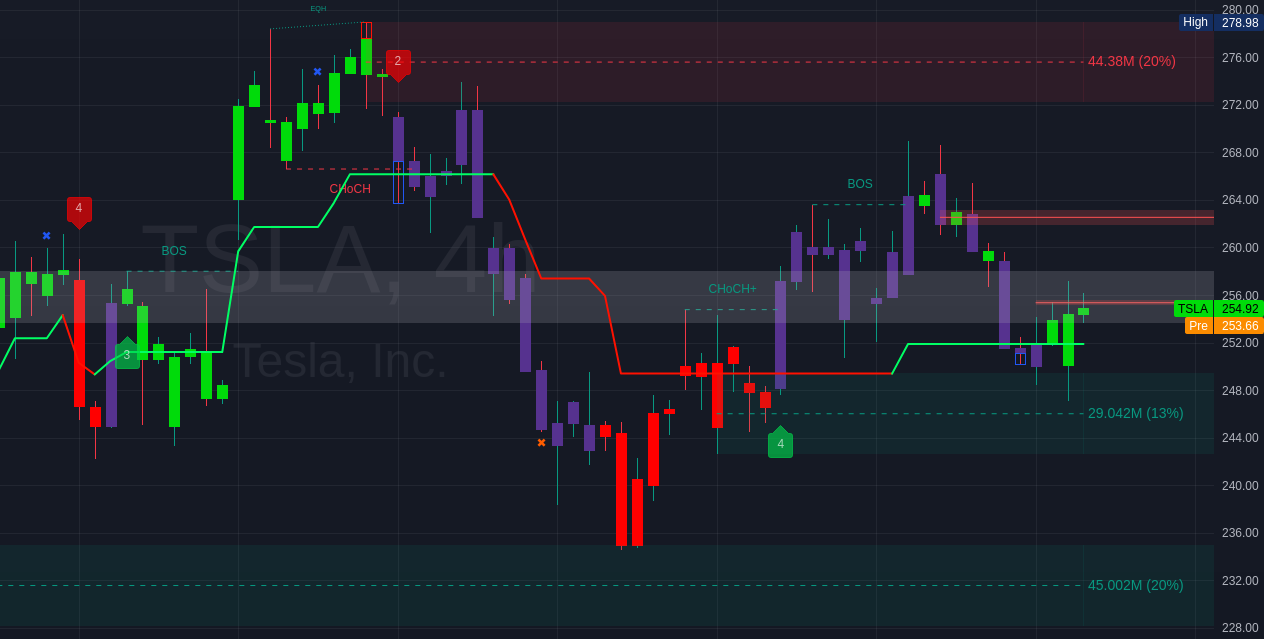
Finally, as we move down to the four hour chart, we begin to see some fair value gaps (unlabeled red lines on the right side of the chart). Sometimes these act as magnets waiting to be filled or they form new support/resistance lines on the chart.
We're in the equilibrium zone on the four hour chart and TSLA made a fair value gap at $255 that still hasn't been filled. We have light support from an order block around $249 and another at $235.
On the upside, we might be limited by the recent fair value gaps at $255 and $262. $272 is the next order block where we might find resistance. Note that this order block shows up on the daily chart, too. That's a strong indicator of resistance.
Thesis
Earnings are binary events and are inherently dangerous. TSLA could have the best earnings call possible and fall like a rock. They could also announce that they didn't sell any cars in the quarter and shoot back to $300. 😉
The lack of widely spread vanna and narrow GEX levels make me think that traders believe this earnings call isn't going to be terribly exciting. TSLA has dropped tons of news items around reducing prices and production challenges in various areas. That could lead traders to think they know the whole story already.
As for me, I have one lot of TSLA shares right now and I'll likely go into the earnings call with those shares uncovered. My cost basis on the shares is around $229, so I've got a buffer zone in case price falls after earnings. I considered joining the circus for January 2024's $300 calls but they're priced over $1,000 each right now and that's a bit much for a lottery ticket. 🎟️
Good luck to everyone today! 🍀 Remember to watch your position sizes around earnings calls and that not trading can be the best trade to make sometimes.
Discussion