TSLA stock and options analysis for 10/11

TSLA earnings are a week away! What does the data suggest that smart money is doing? Let's find out together! 🔎

We're one week away from TSLA's earnings' release on 10/18! It feels like we're in the middle of an earnings run-up, but is that really the case? Let's dig into the data and get the real story.
All investments come with significant risks, including the loss of all capital. Please do your own research before investing, and never risk more than you are willing to lose. I hold no certifications or registrations with any financial entity.
To the data! 🔎
Options flow
Yesterday's flow leaned bullish, but puts began to rise after lunch. The five day flow is still firmly bullish.
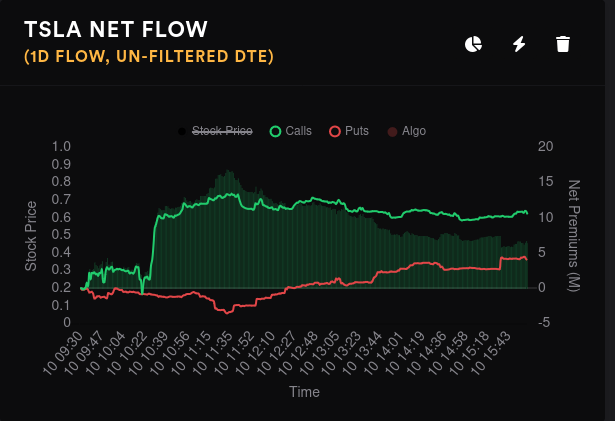
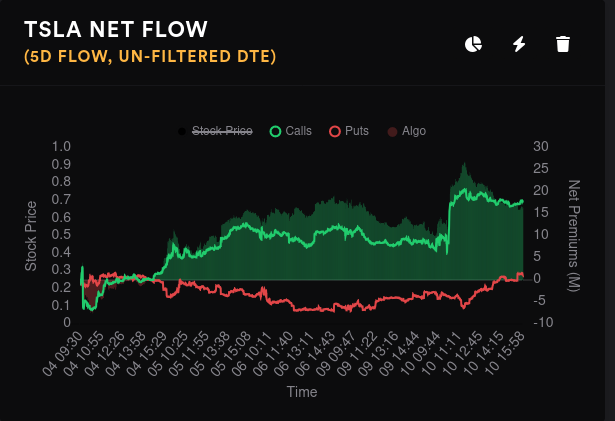
TSLA net options flow
Volume picked up yesterday from Monday's low and open interest also ticked upwards. Open interest for calls are picking up faster than puts.
Vanna
TSLA's vanna on aggregate is positive by almost a 2:1 margin. That suggests that an IV crunch would push the price higher. However, vanna stops being a factor as soon as we approach $265. (Remember that vanna needs some distance to have an effect and usually has the highest effects around 0.15-0.35 delta.)
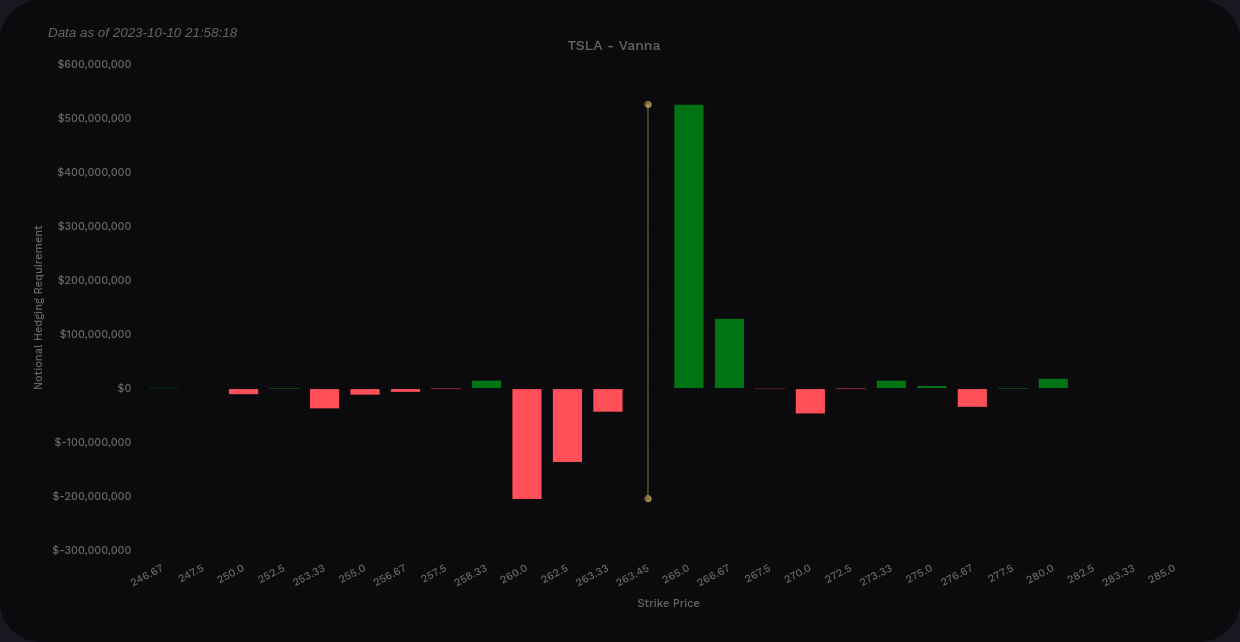
If we combine only 10/13 and 10/20 vanna, it's positive by almost 5:1 margin. It still tops out around $265. This leads me to think that a post earnings vol crunch could push price a little higher by itself. However, earnings are binary events that can completely change traders' thinking about the price.

Gamma exposure
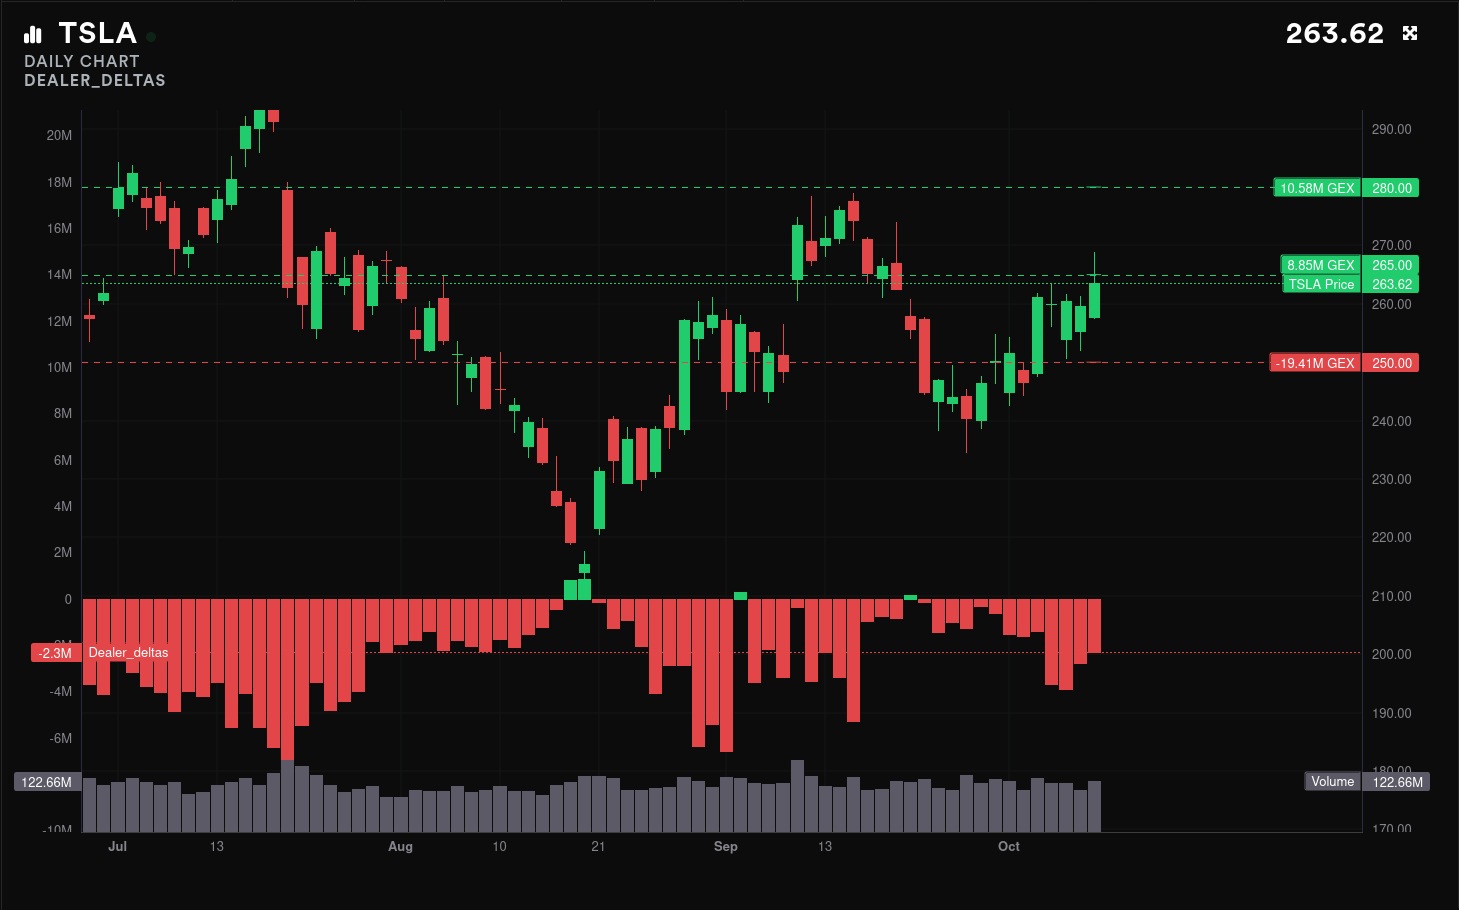
TSLA's biggest negative GEX level on the aggregate chart shows up around $250 and nothing else comes close. We're in a resistance zone now. The second biggest GEX level shows up around $300, but we would have to break through resistance at $265 and $280 to get there.
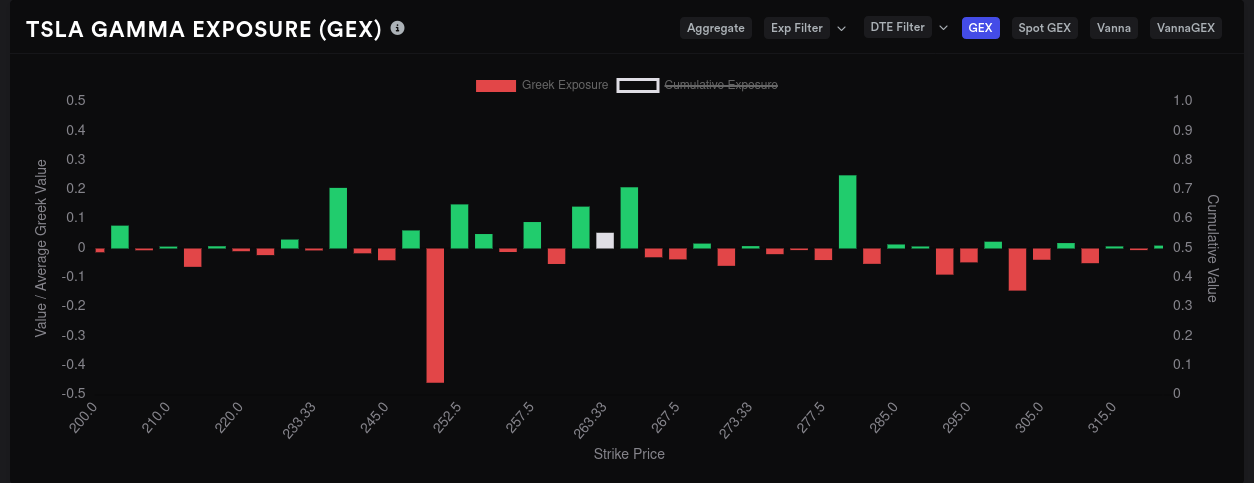
There's a ton of GEX expiring on 10/13, so that's worth a look. $252-$265 shows up as a resistance zone with $250 again as the biggest negative GEX level. $300 isn't on the radar yet (and doesn't show up much until December/January).

Dealer positioning
Dealer deltas are still short for TSLA, but they're gradually moving back towards the middle line. Remember that red bars here show dealers who are short, which suggests customers are long.
Whales
On aggregate, whales are whipsawing between bullish and bearish trades before earnings.
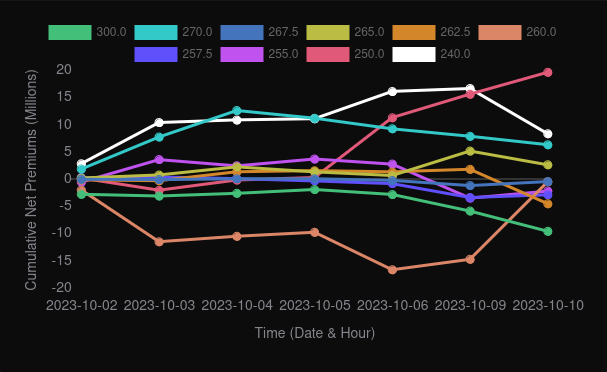
10/13 shows a massive bullish jump on the $260!
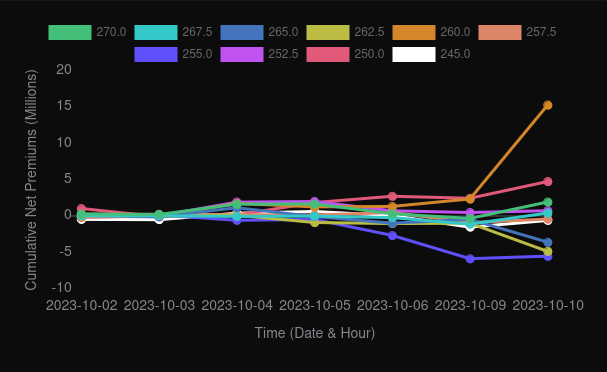
10/20 shows $260 as bearish and holding steady. $240 was looking really bullish, but it seems to be tracing downwards after yesterday's price moves.

Chart
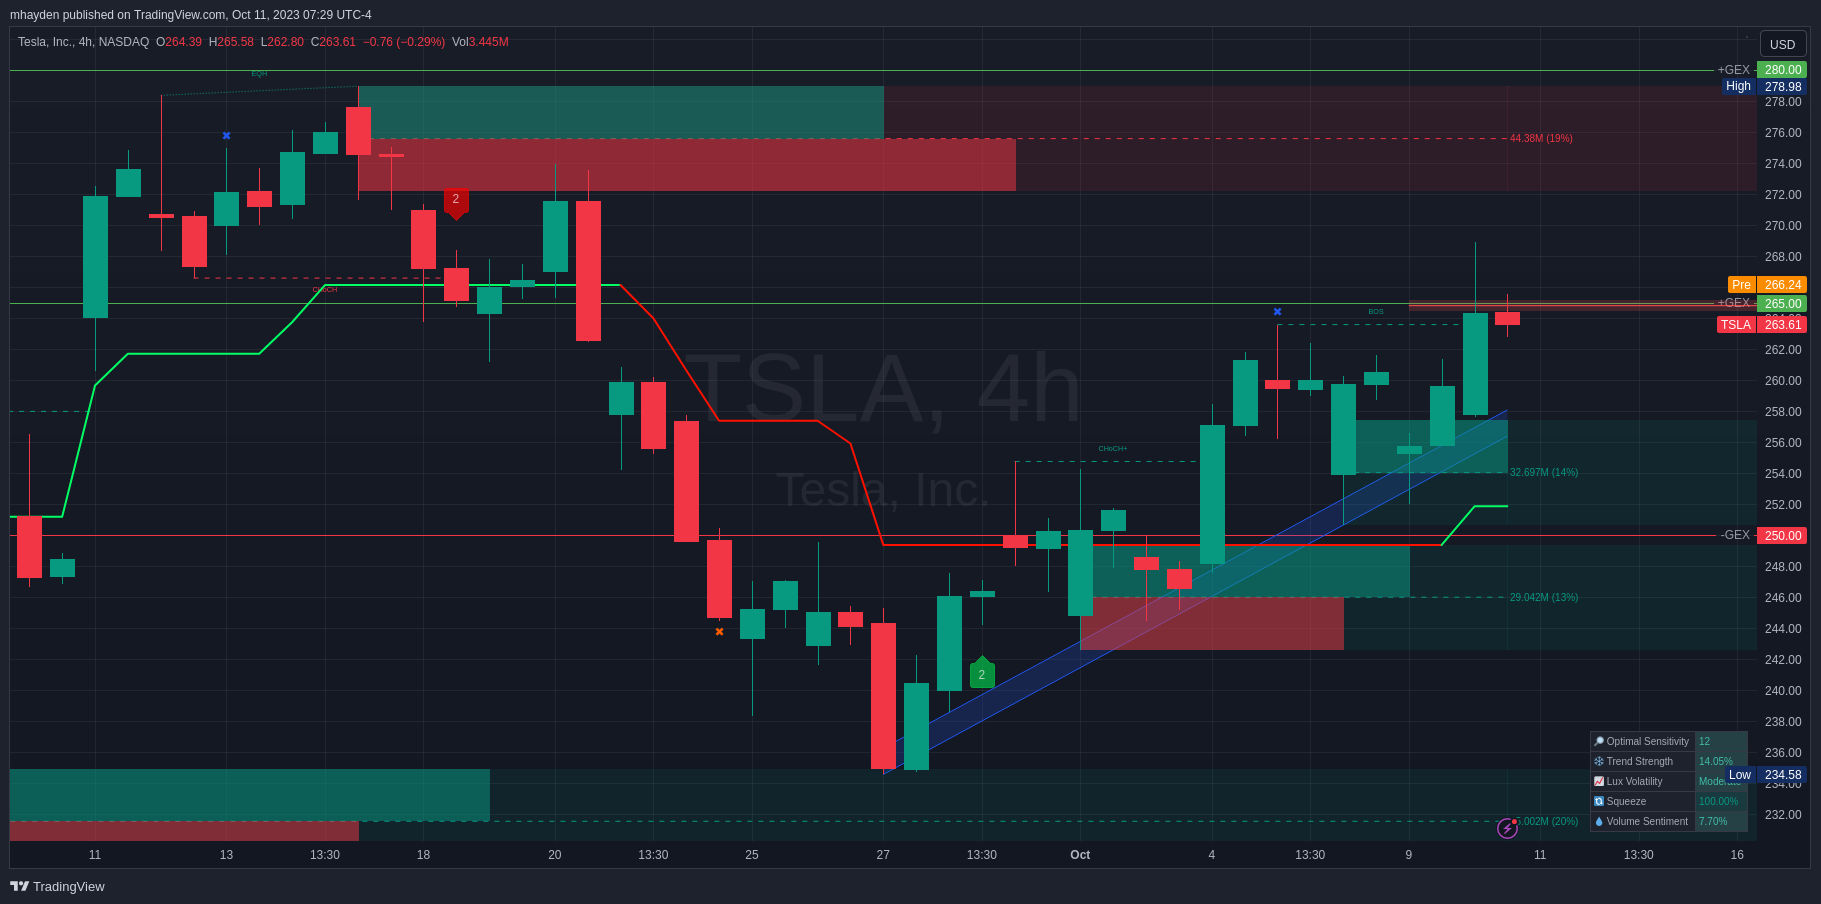
TSLA ran back up to the $265 level where it had some trouble in the past. It ran above that level yesterday and fell back down. As it did, it made a fair volume gap just below $265 that may cause more problems with a move over $265. The positive GEX level at $265 is fairly strong, but it's not the strongest in the group.
If TSLA retraces downwards a bit, we hit two order blocks from $258 down to $242. Both of these are fairly bullish and it will be interesting to see if the bullish traders show up there again. We had a bearish BOS (break of support) yesterday, so I'll be very interested to watch today's price action.
LuxAlgo's signals indicator suggested exiting longs on October 4th, but the trend line keeps moving up.
Thesis
I get the feeling that smart money is betting on an earnings run-up to $265 followed by a move down after earnings. Of course, they could simply be hedging their bets with the whale trades we say earlier. This blog is about using data and not biased news to make trades, but TSLA does have plenty of headwinds to deal with in the economy.
I sold a $260 covered call to cover my lot of TSLA shares and it expires 10/13. My breakeven is $265.25, so the current price action isn't too bad for me. I'm not interested in selling any puts until earnings are over. I could easily see TSLA running back down to the mid $230's before moving back up based on the chart.
Good luck to everyone today! 🍀
Discussion