TSLA update for 10/4

TSLA looks like it has what it takes for a rally, but will the broader market allow it? Let's dig into the data to find out. 🤔

Welcome back and good morning! 🌄 This post covers the latest data for TSLA and where it might be going in the coming weeks.
Lots of people are asking why we're in this bearish pattern. Well, one key point is yields on Treasury bonds are still quite high:
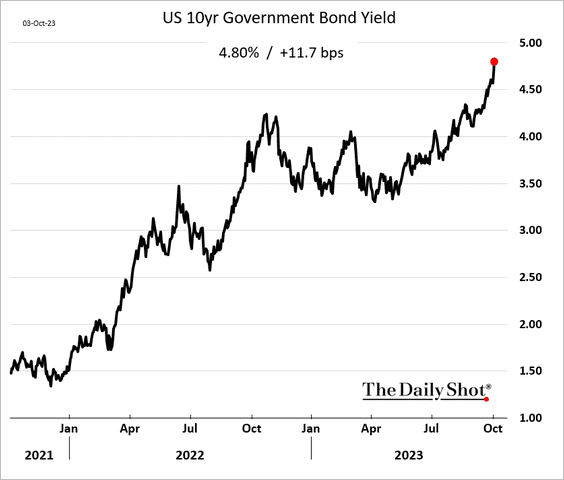
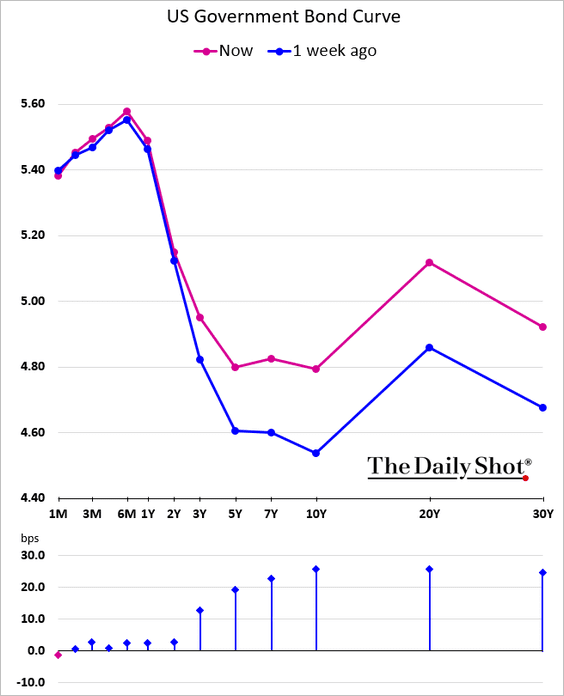
Why would you get into potentially risky equities when you get get 5% or more from an extremely low risk bond instead? Another issue in play is that the bond curve itself is quite inverted and it's becoming more inverted as time goes on.
On the surface, this means you'll get more yield on a shorter term bond than a longer term one. Dig deeper and you'll find that the chances of a recession increase (based on historical data) when this occurs. It doesn't happen every time but it does happen often.
The dollar is getting stronger, too.
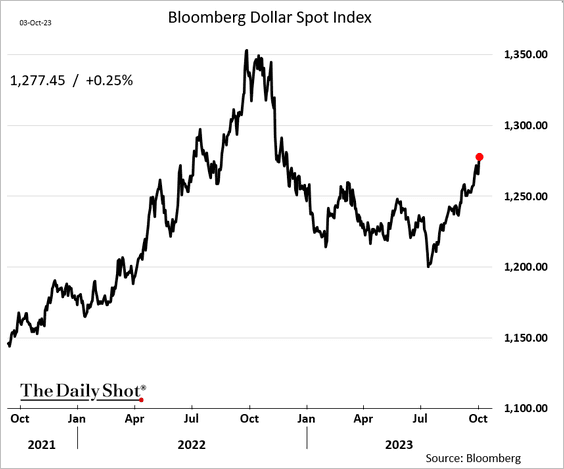
All of these together put pressure on equities and send their prices down. Let's see how this is reflected in TSLA's, data. But first:
All investments come with significant risks, including the loss of all capital. Please do your own research before investing, and never risk more than you are willing to lose. I hold no certifications or registrations with any financial entity.
Let's go!
Options flow
The flow turned bullish yesterday by a decent margin, but the five day chart shows premium piling up on both sides for TSLA without a real clear winner.
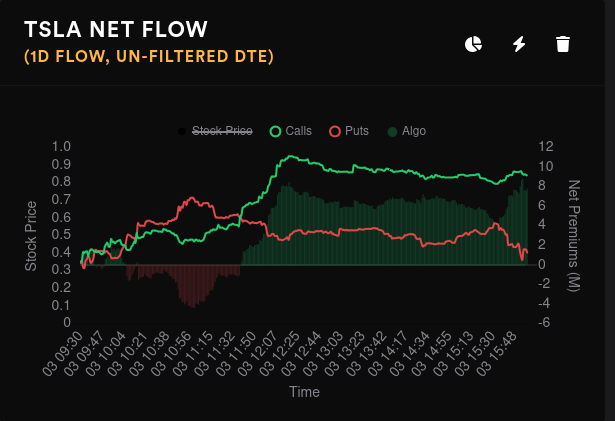
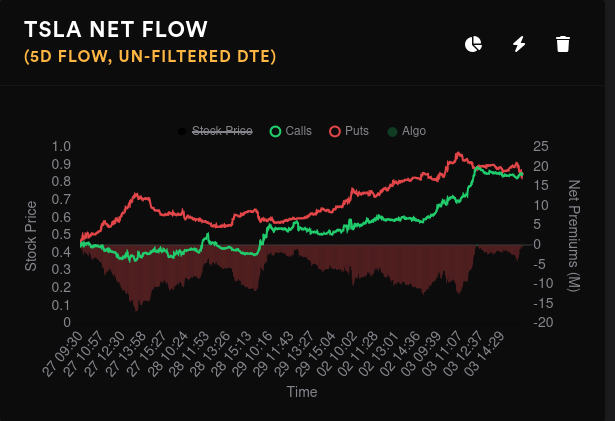
Options flow sank from Friday's peak:

Vanna
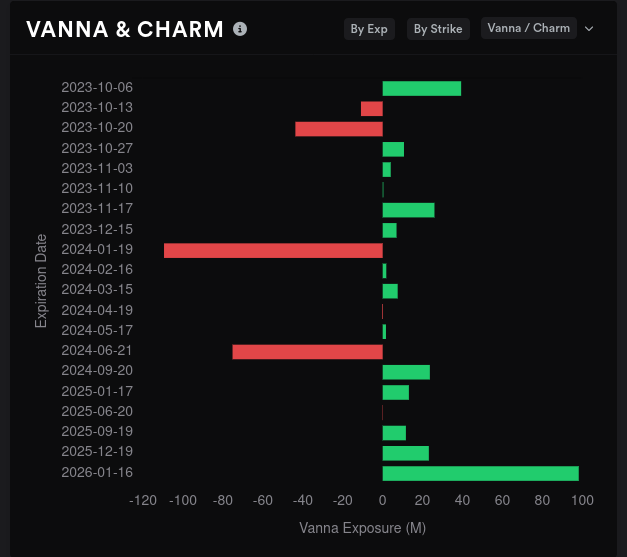
TSLA's aggregate vanna is positive, but there's not much to help price climb past $250.

10/20 vanna tilts slightly positive and suggests a $245-$250 range:

11/17 looks fairly negative:

Dealer positioning
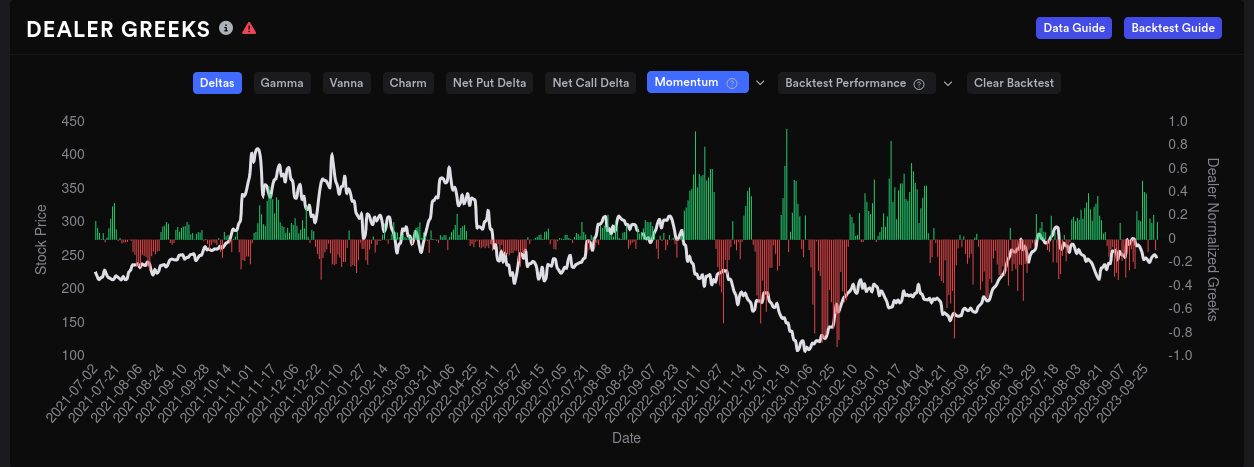
Dealer deltas for TSLA on a 15 day momentum are long, but they're moving closer to the middle line:
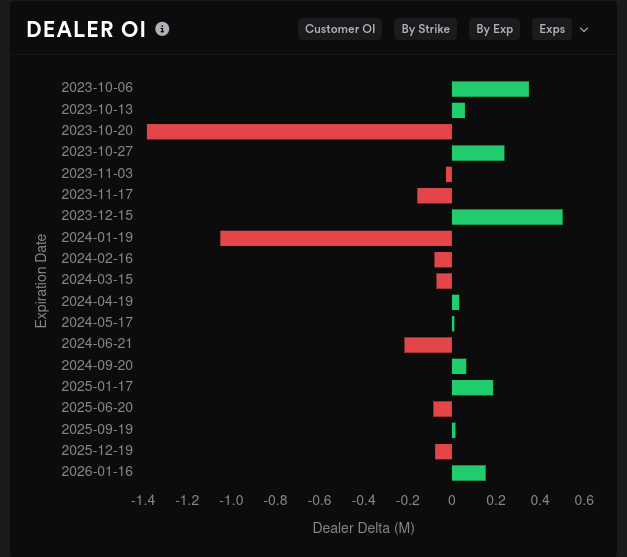
Dealer open interest suggests we're in for a pretty bullish 10/20 expiry with some light bearishness after that. January 2024 comes back with a bang and this is where I keep seeing all of the movement at the $300 strike.
Gamma exposure
Our biggest price magnet zone runs from $250-$255 and that matches up well with the vanna data we saw earlier. $260-$265 shows up as resistance on the top side and we have some light resistance around $245.
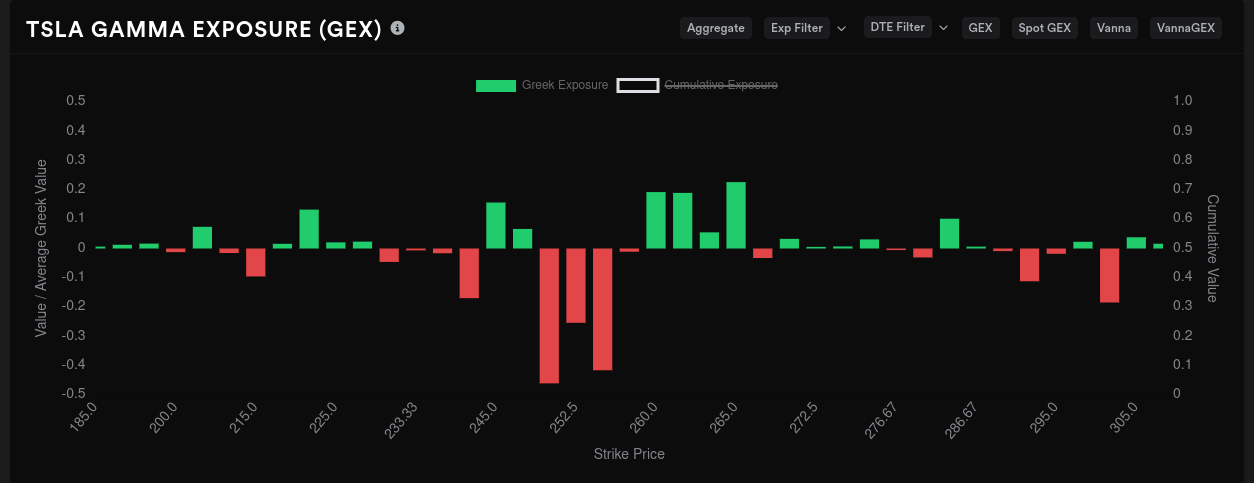
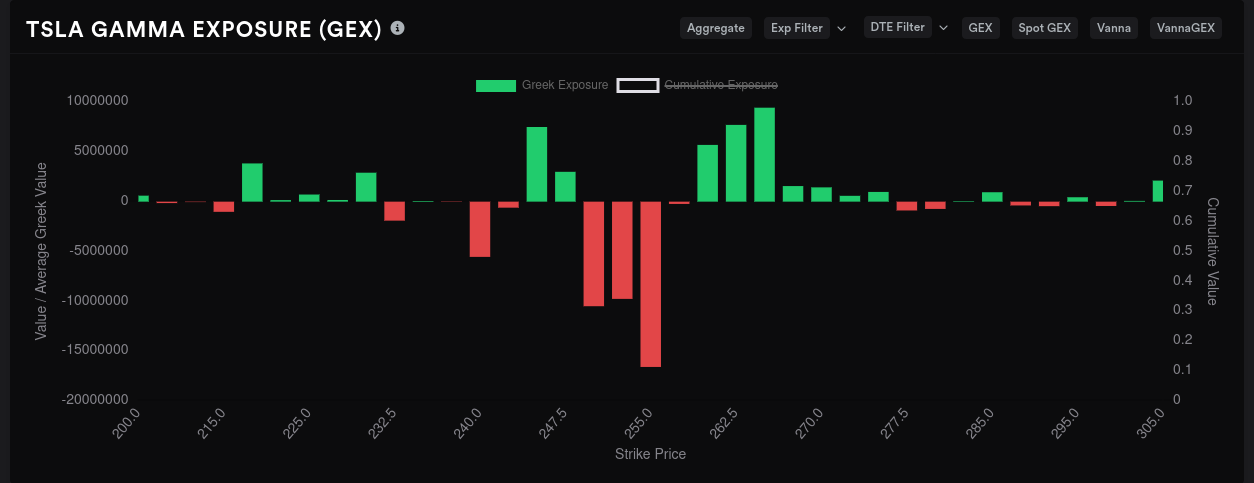
Most of TSLA's GEX is tied up in the 10/13 expiration since TSLA has earnings on 10/18.

10/13 suggests price would hang around $250-$255 and that's not much different from the aggregate chart.
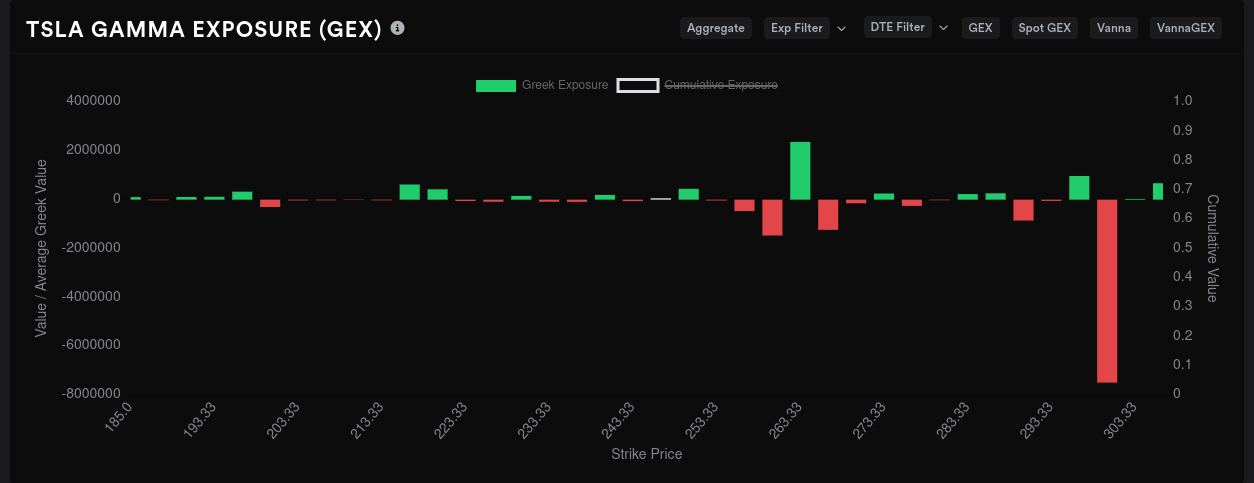
The wild expiry is January 2024 where $300 has just exploded. 🤯
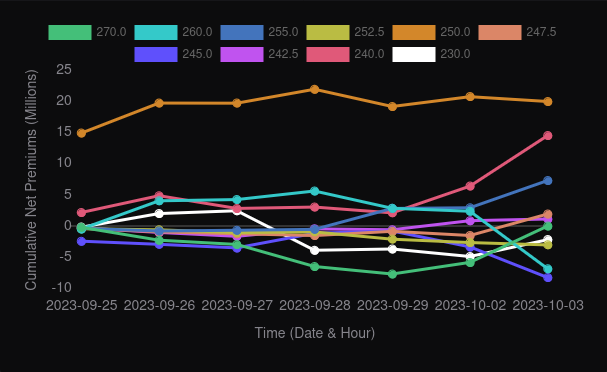
Whales
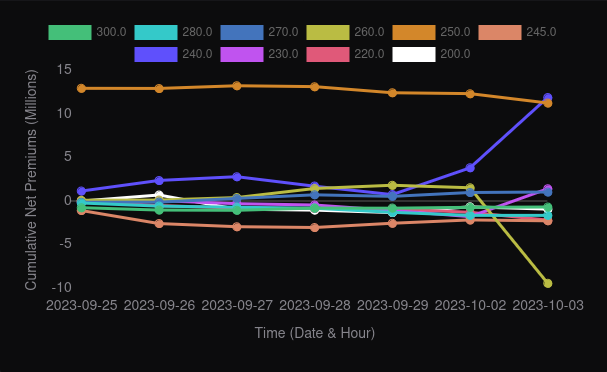
Big money options traders are making some interesting bets. On aggregate (first chart below), $250 has been steadily bullish and $240 is rising to meet it.
The second chart is 10/20 and the same movement is happening there. $260 is taking a bearish dip for 10/20.
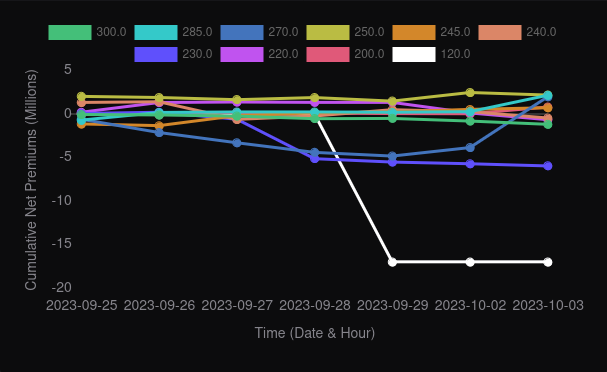
The third chart is 11/17 and someone has taken a bearish position on ... $120? I wonder if this might be a glitch somewhere. 🤔
Dark pool data
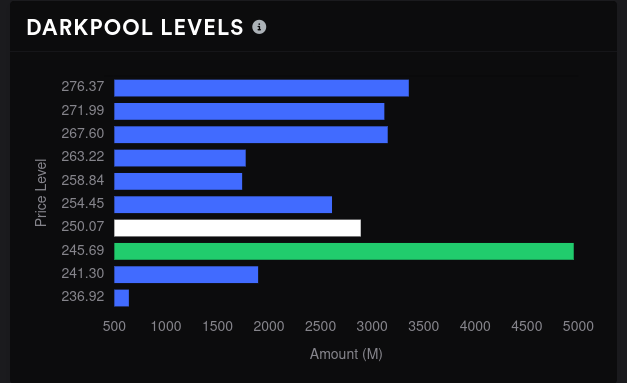
I don't put much faith in dark pool trades since there's a lot of market manipulation happening here, but the highest volume is around $245, which matches up well with recent price action and options positioning.
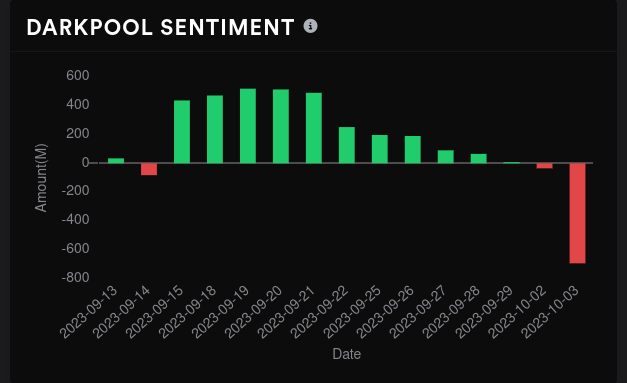
However, sentiment turned very negative yesterday on lower than average volume. I'm not sure if this is a glitch in Tradytics or not, but this seems unusual, especially on a day with lower than average dark pool trading volume. 🤔
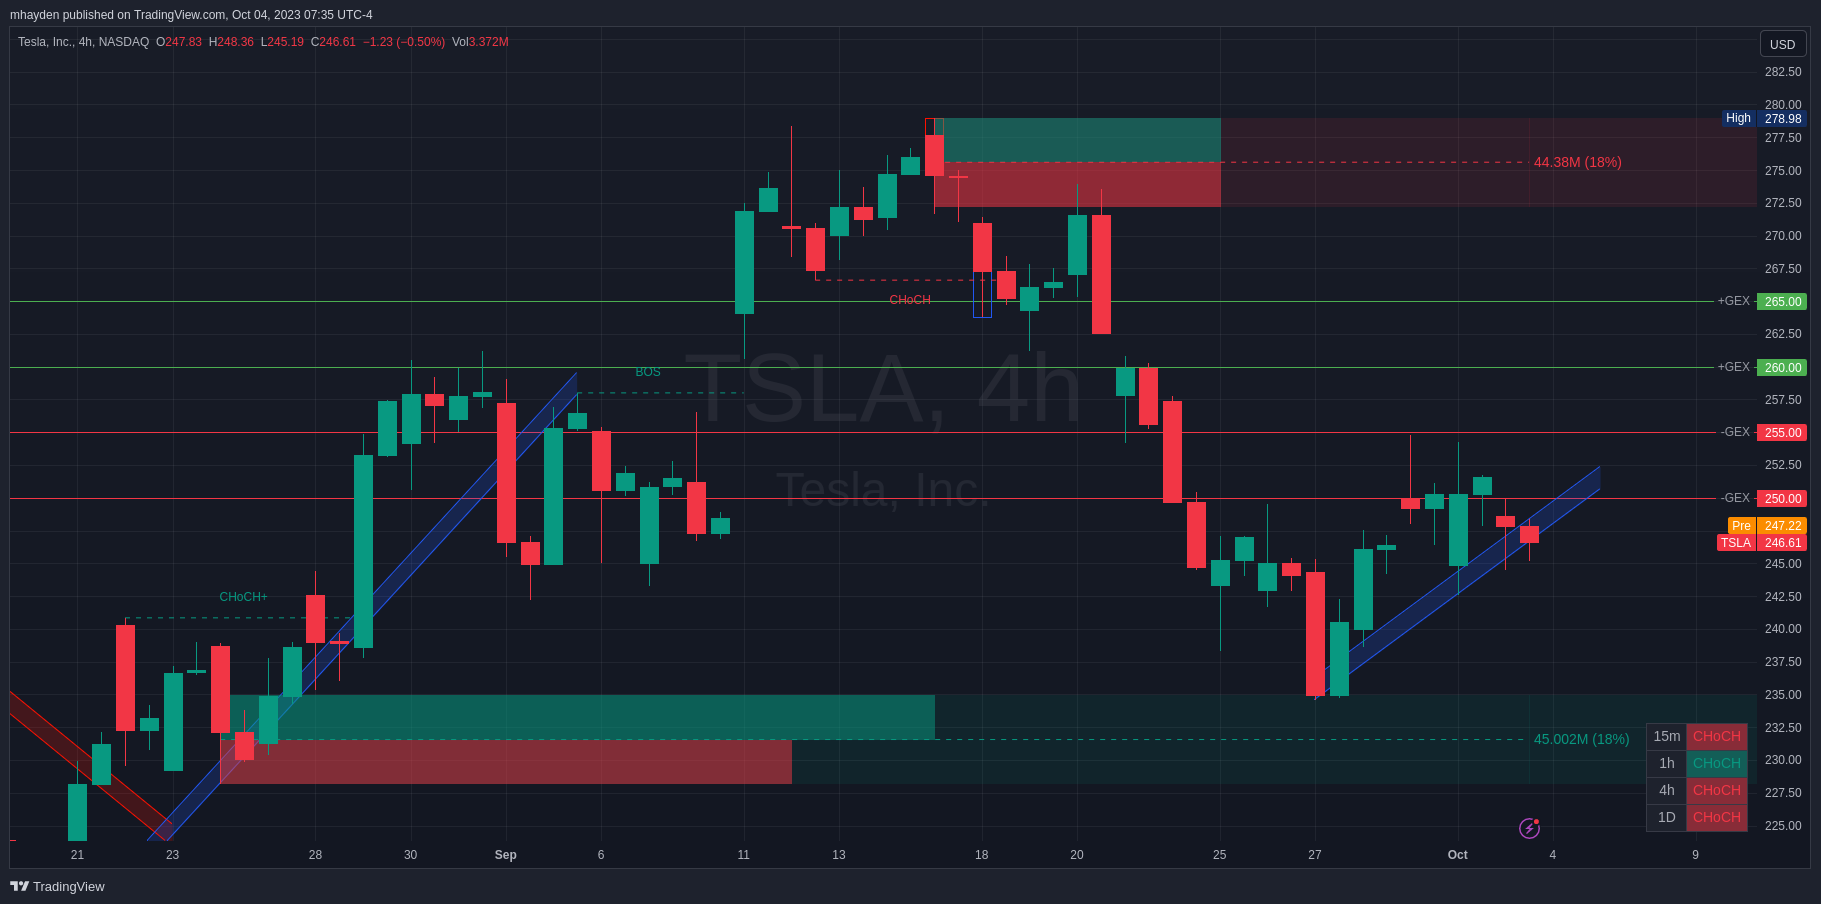
Chart
TSLA's 4h chart shows that we're hanging out just below those two negative GEX levels at $250 and $255. TSLA is also resting on a trend line up from the September 27th low. It looks bullish on the 1 hour timeframe but all other timeframes have bearish tilts.
These bearish tilts are fairly light, though, as there's only one Change of Character (CHoCH) for each. Compare that to something like SPY where the 1 hour timeframe has 4 broken support levels in a row. 👀
If we break that trend line to the downside, there's a bullish order block around $230-$235 which could provide support again. If we follow the trend line up, TSLA is likely going to be limited by the positive GEX at $260 and $265.
Thesis
We're still in that mode where TSLA has the right things in place for a rally. There's decent support below price, we're trending up, and our bearish technicals are at their weakest. However, there's a a general move from the overall market to the downside and that will limit TSLA's upward options.
Discussion