Turtle power 🐢
Let's go over some simplified charts after a discussion about Turtle traders, systems, and trading psychology.

Happy Tuesday! As we await the CPI data tomorrow, I decided to take a break from The New Market Wizards and read another book: Way of the Turtle by Curtis Faith. It's written by one of Richard Dennis' original turtle traders.
Long story short, Richard bet his partner that they could train people to trade right off the street with a good system and they could make money. Curtis was one of his traders but has since fallen on very hard times. His accounts of his time as a turtle trader are contested and his time since has been rough to say the least.
Either way, the book has tons of trading psychology ideas that really make you stop and think about your own trading and systems. I'll cover some of that today along with some charts.
All investments come with significant risks, including the loss of all capital. Please do your own research before investing, and never risk more than you are willing to lose. I hold no certifications or registrations with any financial entity.
Let's move right along. 🚀
Trading systems
One thing I heard constantly throughout Faith's book, as well as in Jack Schwager's Market Wizards series, is that everyone needs an edge to succeed in the market. Most edges come down to exploiting what the masses do within markets to turn it into your advantage. These often turn into a system.
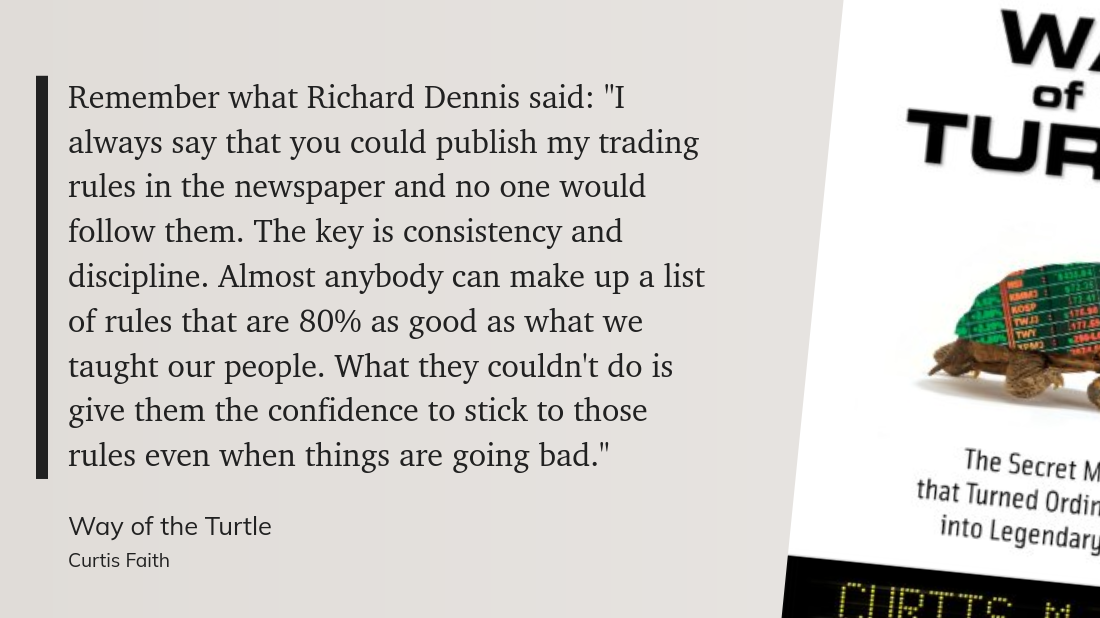
Systems are interesting, though. Richard Dennis had a good comment about his turtle trading idea and their system:

Faith talked a lot about how the difficulty for the traders wasn't the system itself (although it did include some math), but the difficulty was in following the system. We all know that fear, greed, or some combination of both can wreck our best trading plans and send us on wild goose chases into bad trades.
You can search the internet and find tons of details about the strategy itself, but it's essentially a breakout strategy using Donchian channels on two different time frames with exits timed based on a certain number of bars or an average true range (ATR) stop loss. There's plenty more in there around position sizing and how to confirm a breakout, but that's the basic idea.
Following even the best system with the greatest looking backtests has some rough days, though:

Trading a system requires sticking to those rules even when drawdowns occur. After all, if you've found an edge in the market, your wins should outpace your losses. That doesn't mean that you should have more winning trades than losing ones, but the amount of money you make on winners should outpace the money lost on losing trades. Every system has some rough times, including the simplest systems such as watching 200 day moving averages.
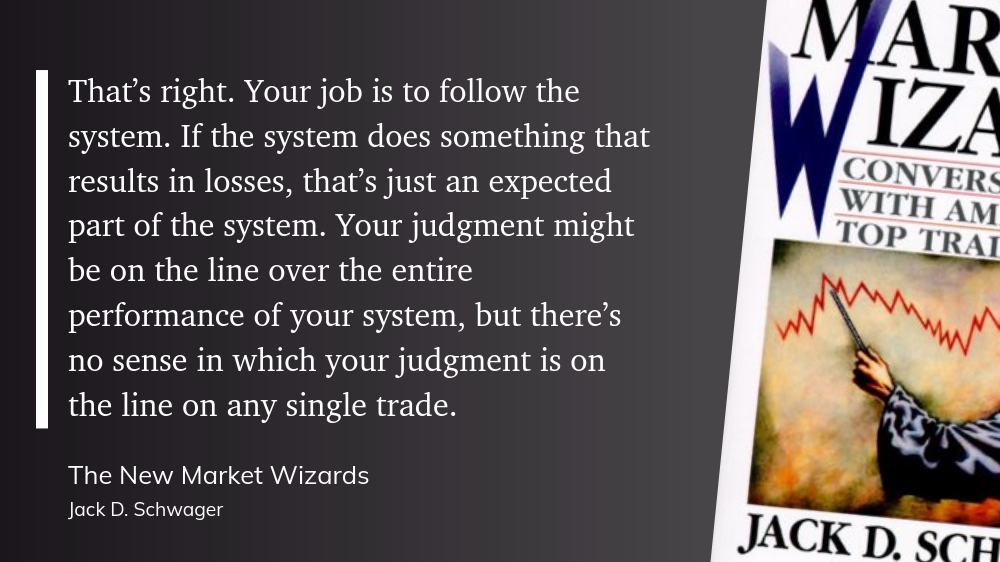
Abandoning a system as soon as a pile of losing trades arrives defeats the purpose of using a system in the first place, according to one of the traders interviewed by Schwager:

And then here's the one that took me the longest to figure out:

This really made me stop and think: All of those YouTube personalities promising a return with their system and all the website trying to offer you "secrets" behind options data should be able to make much more money trading their system rather than selling it to you. After all, if the system is so foolproof, just trade it yourself and don't sell it to anyone else.
As another data point here, the book notes that Dennis had a non-disclosure agreement with the turtle traders for six years after they left the program. Now you can find websites everywhere with the turtle trader methodology and there are automated strategies on TradingView, too.
Do you know why? The system no longer performs well.
If you love this topic, Jack Schwager's Market Wizards series is excellent because he lets the successful traders tell you how they think about trading, how they built their systems, and how they dealt with the best and worst of times. So many of these traders said they worked on trading psychology last, but if they could start over, they'd work on psychology first.
Charts
I've worked hard lately to make my charts as minimal as possible. I'm not sure that I can go totally naked as Tom Hoegaard does, but he has a different trading system than I do. Either way, I am trying a better strategy for drawing trend lines that I found in Jack Schwager's second book:
- Identify the most recent highest high and lowest low to build an uptrend.
- Start the trend line at the lowest low and connect it to the lowest low just before the most recent highest high.
- If that line goes through any bars or wicks, you need to move the start of the line up to the next lowest low. Keep doing that until your line only touches two bars: the lowest low, and the lowest low before the most recent highest high.
- If price crosses that trend line, the trend is changing. If the price runs up to a high close to or equal to the previous one, then crosses the trend line, that's an even higher odds bet that the trend is changing.
- Flip all of this upside down for downtrends.
Here are some examples from recent charts. First up is AMD. AMD has broken the trend line off the most recent high and is breaking down a bit over the 200 day moving average:

IWM looked like it was going to break the trend line, but it's still running higher:

SPY has been making highs recently on gradually lower volume each time and it broke the trend line before last week's big drop:

SMCI looks like it's breaking down a bit from the highs:

Thesis
Everything seems to be on hold through tomorrow's CPI release, so there's not a lot to do right now except looking over position sizes to ensure I'm happy with everything going into tomorrow's print. I'm long delta right now (about 189 SPY beta-weighted deltas), but I've cut some losses on trades where the reward wasn't worth the risk.
My goal now is to determine how I'll react based on tomorrow's data. If we get a counter-trend move down after the data, I might turn some of my short puts into strangles or straddles. If we trade flat or up, I'll likely keep my positions as they are or add a little bit more bullish delta.
The long term trend is definitely strong here, but it's being made on lower volume at the highs. A return to a support level for a retest has pretty good odds, but we'll have to take advantage of the moves that the market gives us.
Good luck to everyone this week! 🍀


Discussion