Update for 7/20

TSLA earnings came and went with the price whipsawing after hours. Let's set TSLA aside temporarily and take a deeper look at AMD. 🎢

We got a look at TSLA's earnings yesterday and received some new numbers around how people are managing their credit. First off, delinquencies on credit cards and auto loans are definitely on the rise:
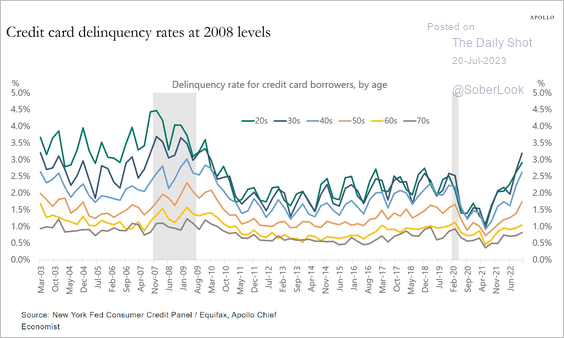
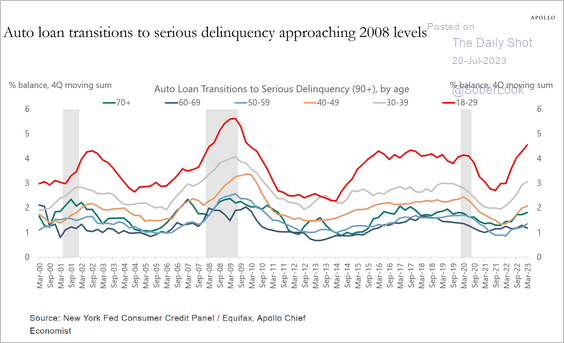
If you want to learn more about the automotive market – new or used – I recommend Lucky Lopez and his Automotive Life videos on YouTube. He takes a look at everything from a dealership angle and covers topics such as car insurance, inventory challenges, and repossessions.
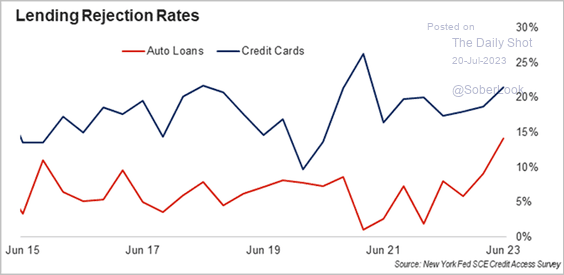
The rates at which new credit cards and other loans are rejected is also increasing:
But another piece of evidence shows that the economy is turning a good curner. Sales of heavy trucks needed for delivering goods and manufacturing components are on the rise:

But before we go any further:
All investments come with significant risks, including the loss of all capital. Please do your own research before investing, and never risk more than you are willing to lose. I hold no certifications or registrations with any financial entity.
Let's take a look at today's data. 🤓
TSLA
TSLA earnings definitely looked mixed. The stock moved around quite a bit in the post-market trading hours as the world digested the data.
There's not much to look at here since most of the data I have in my hands now is pre-earnings and we're in a new paradigm now. I'll try to get a deeper look at TSLA early next week once the data settles down and market participants adjust their holdings.
AMD
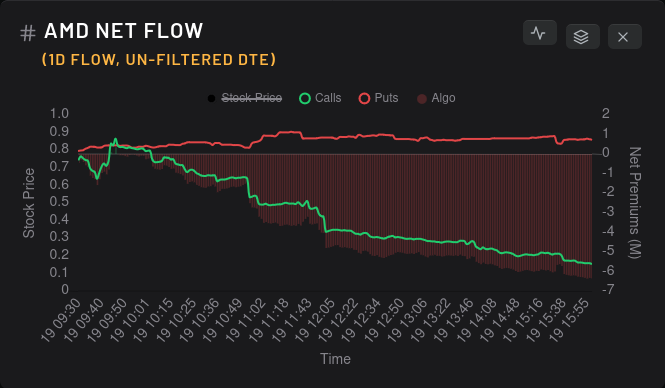
$117 is definitely the area of contention lately. We've seen price rocket above, then fall back down. We've seen price try to fall a ways below it to $114 and $115 only to come back up and test $117 once more. Let's start by seeing what's happening with the options flow. 🔎
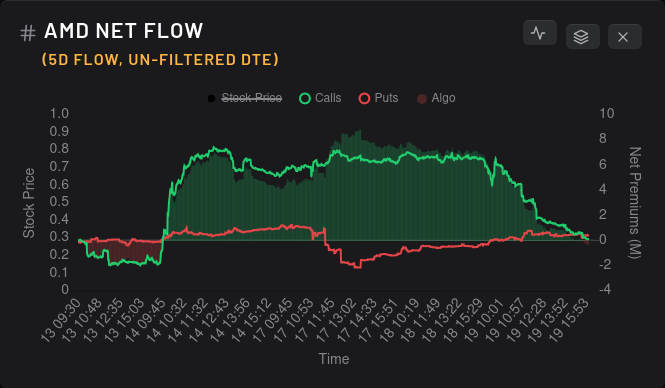
Yesterday saw a gradual selloff in calls that widened as the day went on. Although it looks terrible on the one day chart, the five day chart shows that it was mainly a selloff of the calls made on last Friday's rally (which was an unusual rally for sure):
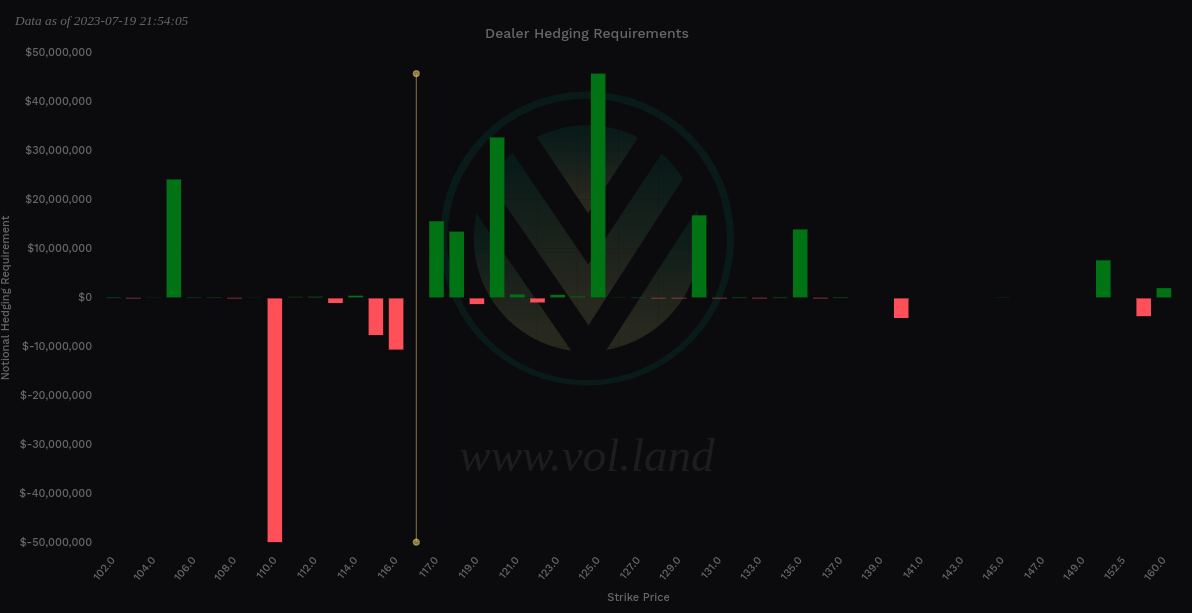
AMD vanna still looks quite good for bullish trades. What I want to see here is positive vanna spread out among multiple strikes above price and very little positive vanna below price. Outside of the $105 bet on the chart, we're looking pretty good for bullish price movement provided that implied volatility doesn't increase dramatically.
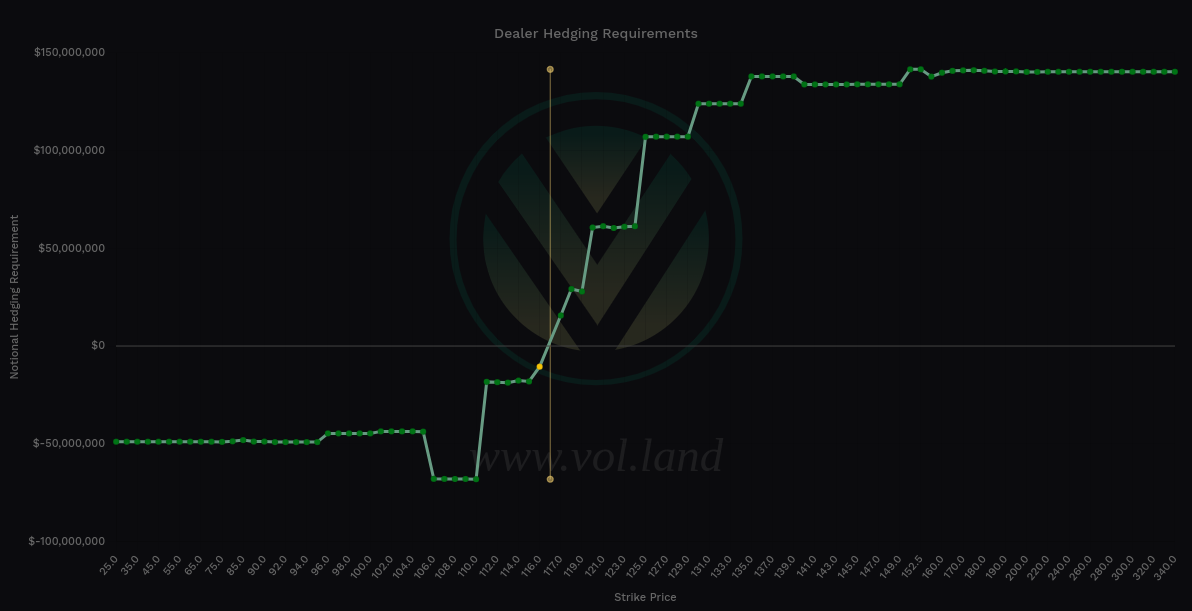
Delta-adjusted gamma still suggests we're pinned in between $115-$117 for a while. Gamma isn't terribly strong on AMD right now, but this could explain why we keep bouncing around in this zone daily.

AMD's dealer greeks also look good for bullish trades. We're seeing a little less momentum on bullish trades from market participants, but dealers are still overall short and this has proven to be a good time for going long on AMD in the past:

8/18 still looks like a bullish bet and it seems to be growing more bullish. 7/21 – this Friday – seems to be the most bearish expiration on the chart:

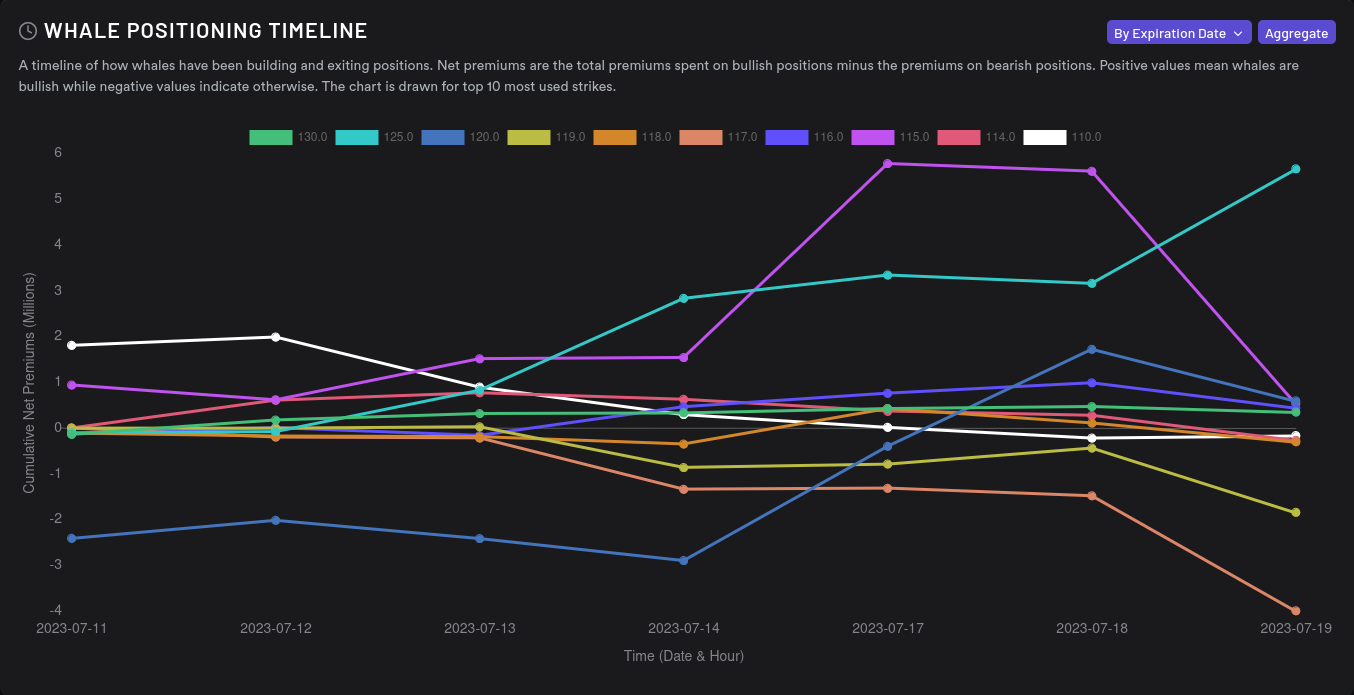
Big money traders help to explain what might be behind the call selloff we saw yesterday. While the $125 strike picked up bullish movement yesterday, nearly everything else went more bearish. The biggest move down was on the $115 strike. Keep in mind that many market participants and dealers will need to move their bets to the next expiration date as we approach OPEX on Friday.
Tradytics also has a fancy chart where they look at the options contracts to determine where market makers expect the price to be for a particular stock. Generally, you want to see the yellow/red/green lines above the white line (the price of the stock). This means that participants are betting on a higher valuation.
You can take it a bit further and examine how the yellow line moves across the red/green lines. When the yellow line is moving up to cross those lines, that's a bullish sign (and it's happening right now). When it's declining through the lines, we might be approaching a correction.

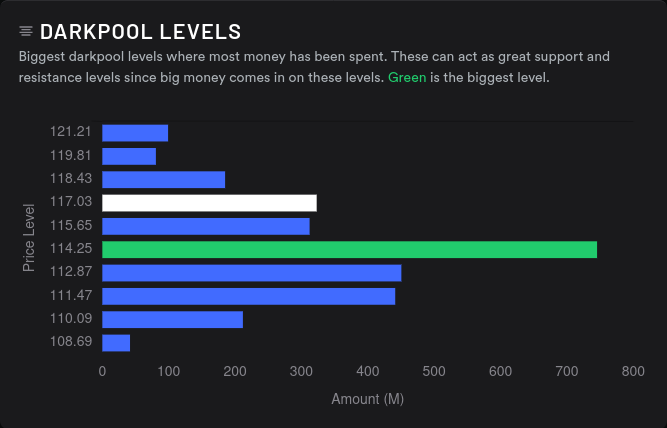
Can we see some correlation with all of this data in the dark pool data? Yes!
There's still great volume around $114, but what I'm really liking here is the growth in volume around $115 and $117. As I've said for a while, it looks a bit like AMD is building a base for future growth slowly but surely.
Thesis
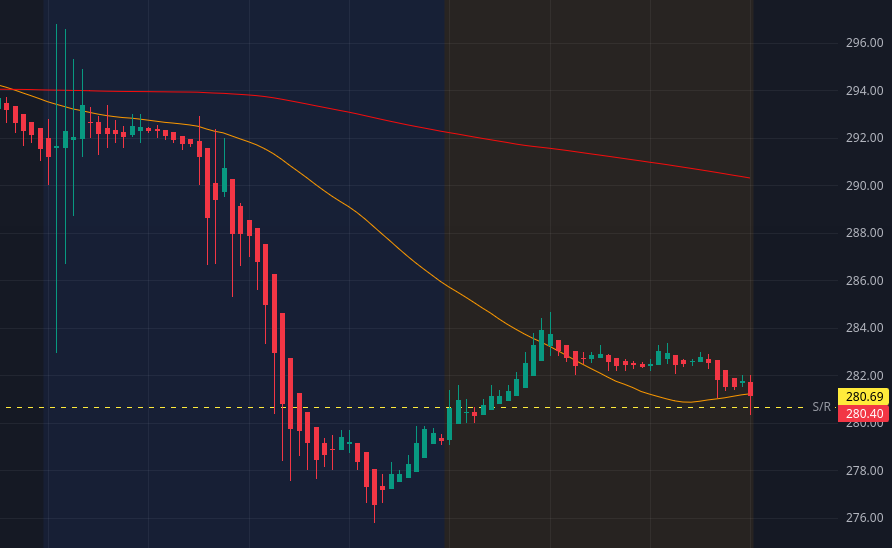
As for TSLA, I sold a $280 put yesterday for 7/21 just before the bell for $5.25. That was a high-risk trade, but I decided to make a bet on my research. $280 looks like a good support level and TSLA is sitting around $279 this morning after quite a bit of after-hours whipsaws. This short put is profitable unless TSLA drops below $275.
My $295 covered call for TSLA on 7/21 remains open. As per my trading rules, I will close this trade (and my short put) at or before the time they reach a 50% gain. (I set a 50% trigger order immediately after writing the contract. I should write a post about this.) 🤔
I managed to escape some of my more aggressive AMD covered calls yesterday and sold a $117 put for 8/4. That's an aggressive trade for sure, but this $117 level seems to be a special one for a while. I also sold two $112 puts for 8/4 and I still have my original $115 short put. I'm really interested in playing this $115-$117 region through earnings.
Someone in a Discord asked me "When is AMD going to the moon?" First off, I wish I knew. 😄 But, what I do like about AMD right now is that it's building a solid base and consolidating around $115-$117. I can see it in the options data, dark pool data, and with technical analysis on the charts. AMD has all of the ingredients for another rally, but we may be stuck waiting to see what it brings on the earnings call.
Good luck to everyone out there. 🍀
Discussion