Update for July 14

PPI data looks promising and the market continues marching up. However, TSLA traders threw us a curveball before earnings. ⚾

Coming off this week's optimistic CPI numbers, we also have PPI (Producer Price Index) data:
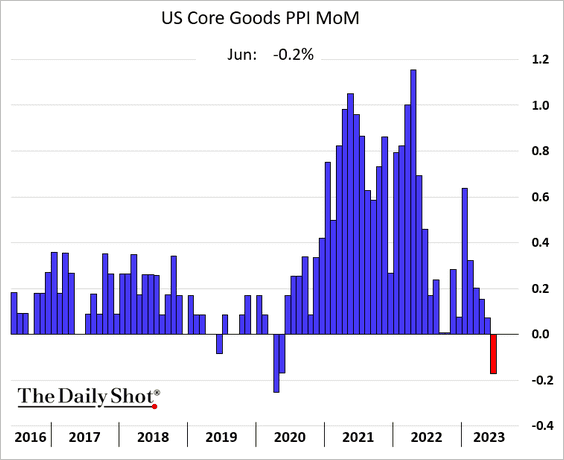
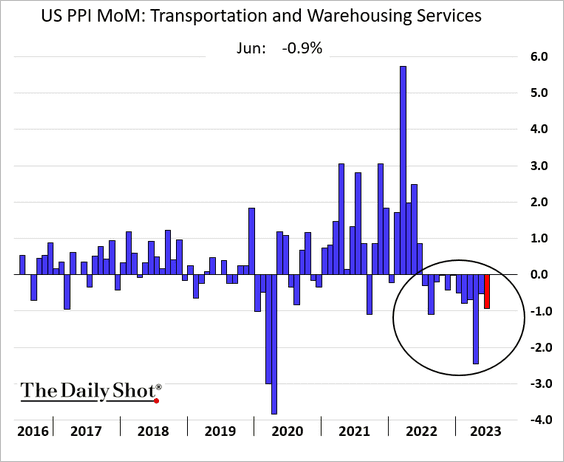
These are small steps, but they look great compared to the steep curve from 2021 and 2022. Prices for materials used in manufacturing have come down as well for two months in a row.
Volland's authentication is working again this morning so we can take a deep dive into how options positioning might affect prices going into TSLA earnings next week.
All investments come with significant risks, including the loss of all capital. Please do your own research before investing, and never risk more than you are willing to lose. I hold no certifications or registrations with any financial entity.
Let's get into it!
Overall market
Vanna effects are reduced this week, but SPX has a vanna curve that makes me just shrug:
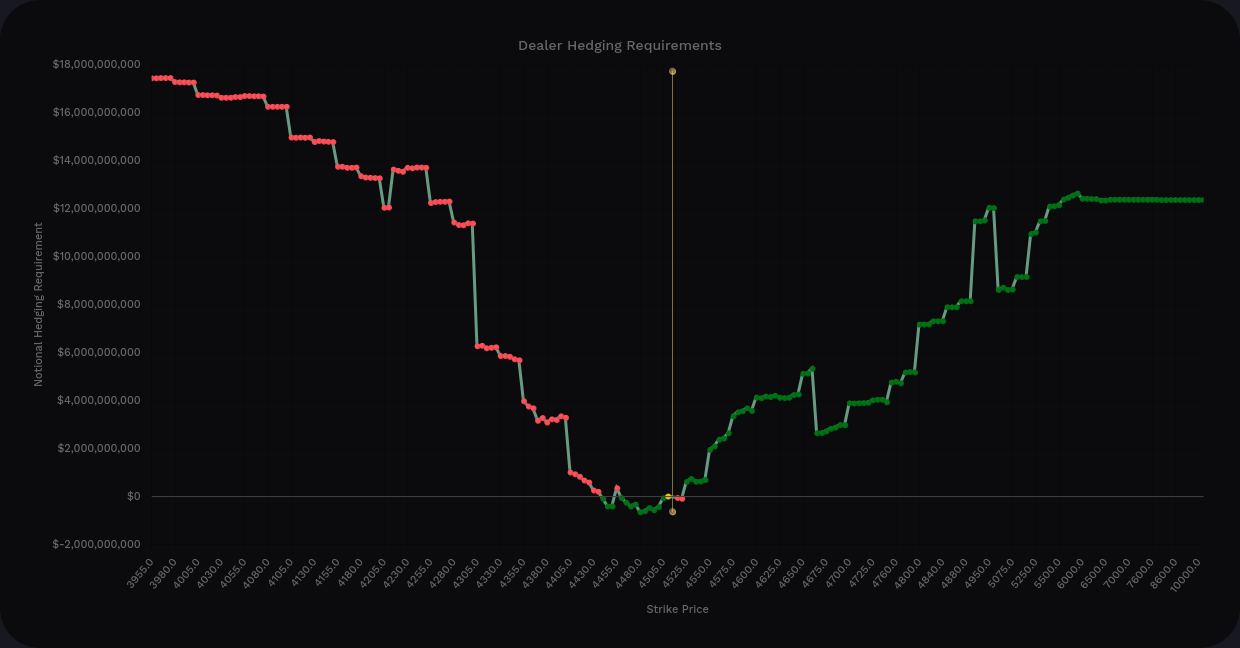
Sure, there are plenty of positive vanna lines above the current price, but we have plenty below the current price, too. There's more aggregate vanna under the current price and that's something I don't like to see as a trader with a bullish bias.
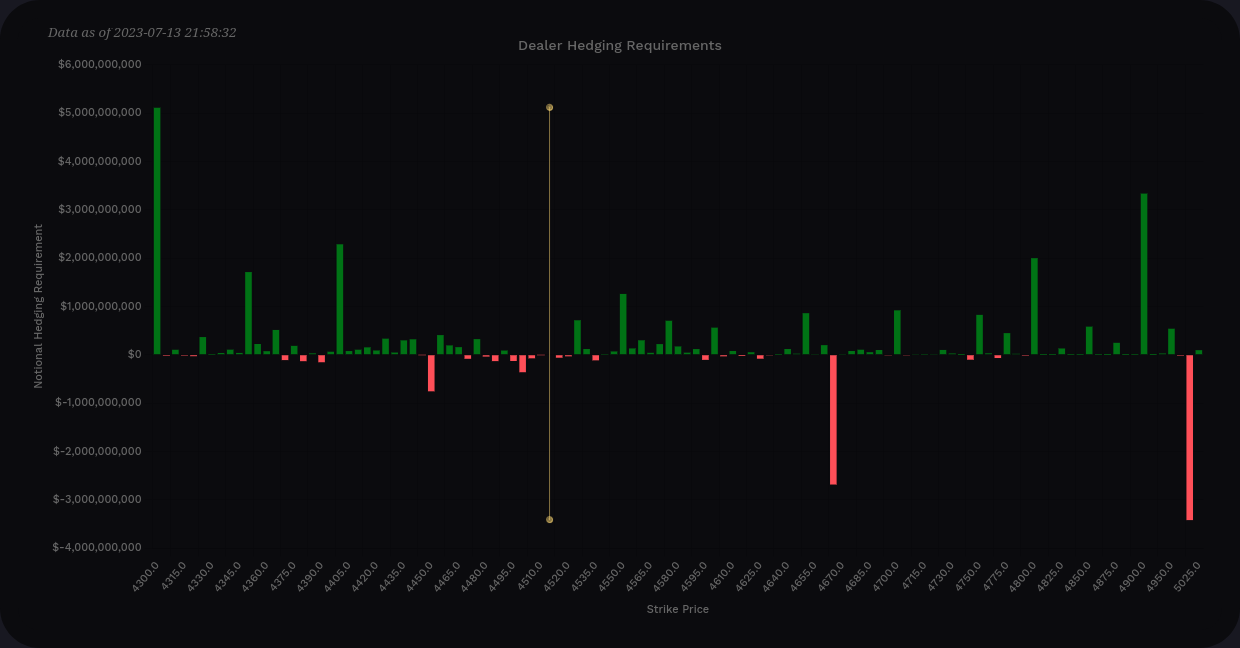
Gamma is even weaker than vanna, but outside of some support at 4500, there's not much to talk about. There are plenty of places where price action might slow down on a move up:
But the options flow across the market is undoubtedly incredibly bullish:
Call premium continues increasing and puts are slowly trailing off. While the flow might look exciting, vanna and gamma are showing me some warning signs here. In addition, SPX crept over the 70% RSI level over 14 days. SPXEW (SPX if each stock was equally weighted) is even higher at just over 71%. Some will argue that shows strength, but that screams danger to me.
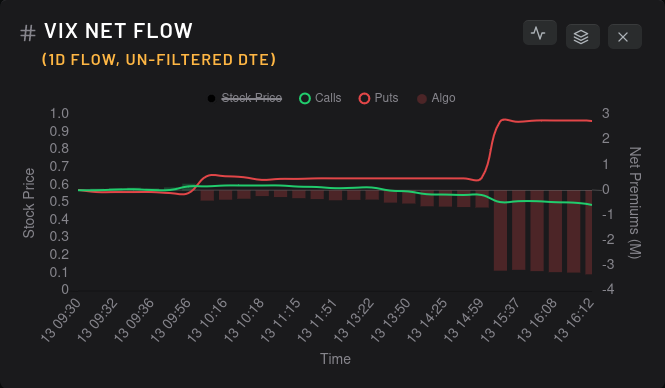
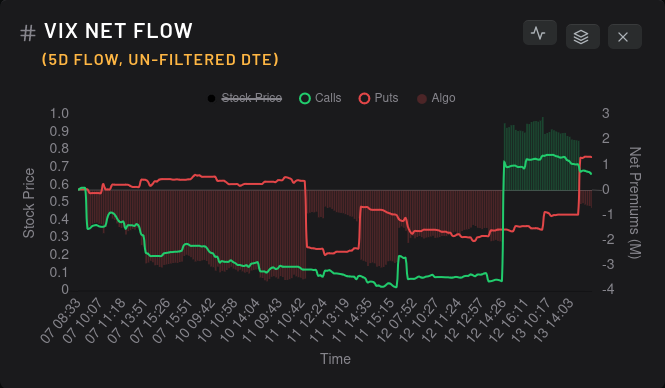
The VIX saw a bearish flip yesterday on the five day chart, but it's not enough to make me think we have a shift in thinking quite yet.
AMD
Let's take a look at AMD first for a change. First up are vanna charts:
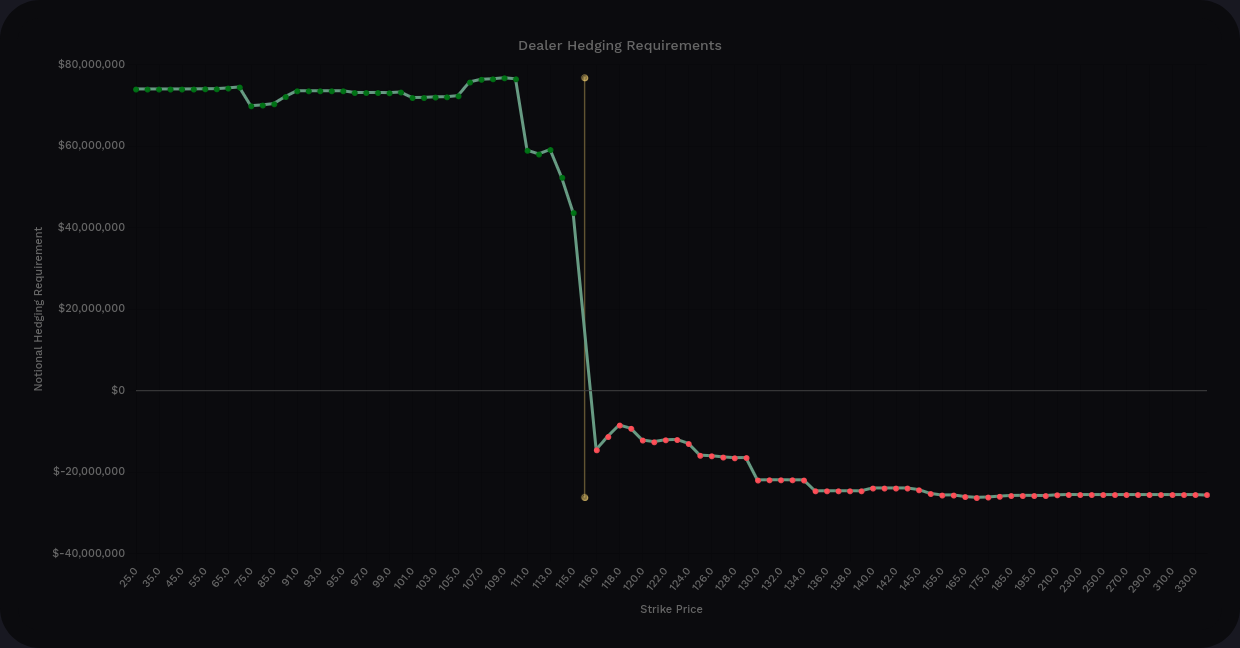
AMD has finally moved into a pattern I really like to see:
- Plenty of positive vanna spread over a wide range above price
- Reduced positive vanna below price
- Vanna above price is 4x the vanna below price at the extremes
- Support from vanna around $110 remains
Bear in mind that vanna is weak on AMD right now and the tallest bar only reaches to about $25M. How about delta-adjusted gamma (DAG)?
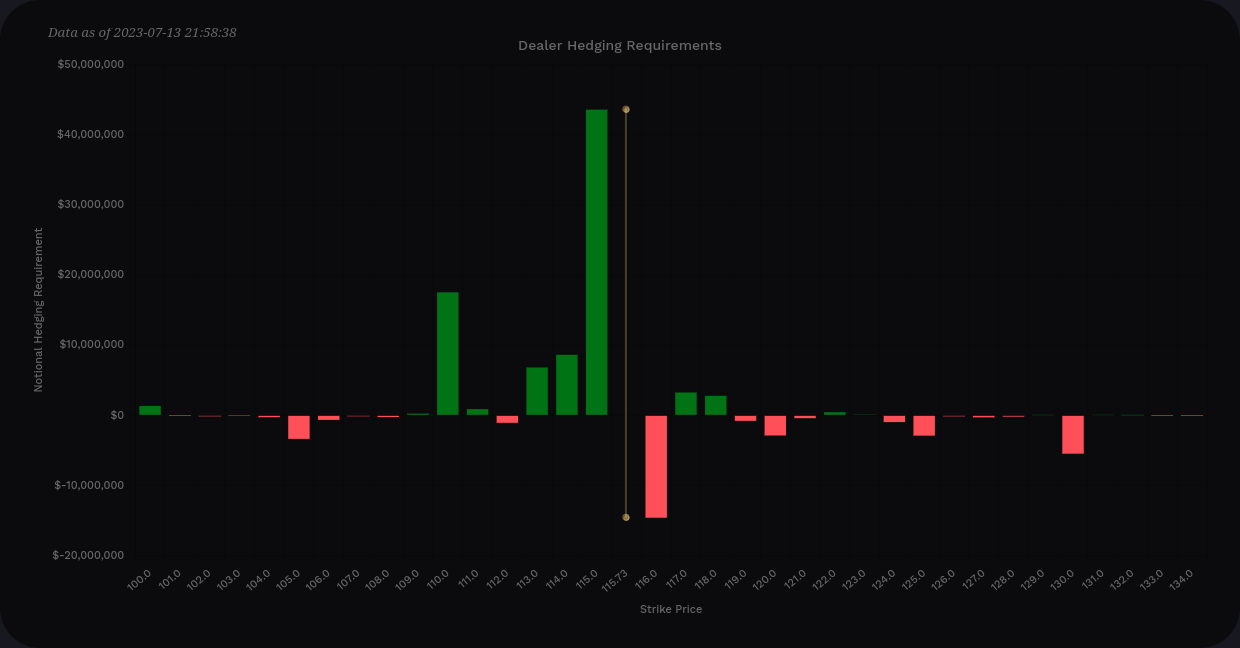
What a shift! We've been stuck in $110-$115 for ages with gamma slowing moves past $116-$120, but most of the selling pressure from gamma has disappeared. There's about $58M worth of gamma sitting underneath the current price that should provide support all the way down to $110.
Before we get too excited, there are some mixed signals here worth examining:
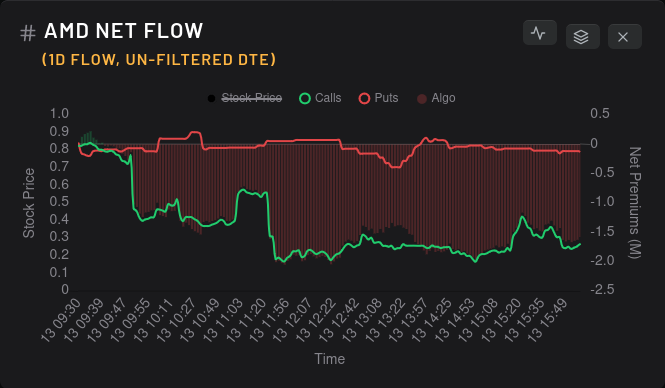
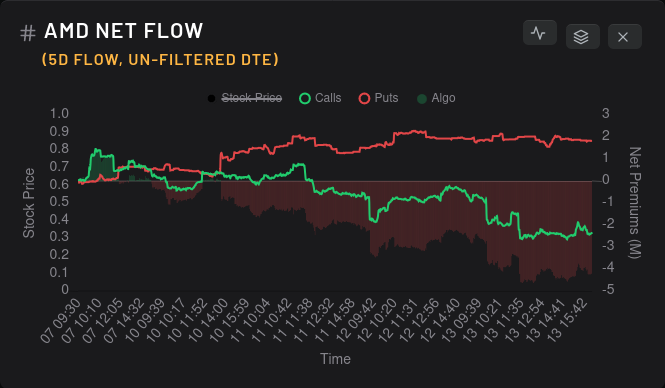
AMD's flow flipped bearish on the 10th and remained there. Calls have sold off and they seem to sell off more aggressively each time AMD touches the $115-$116 zone. This could be profit taking on long calls, but it could also be a sign of bearish bets on AMD above $115.

Dealers are picking up bearish contracts very, very slowly which suggests that market participants are moving slightly more bullish each day, but not by large amounts. Seeing momentum shift like this for three days in a row is a good sign but I'd really like to see some taller red bars here.
What are the big options traders doing?
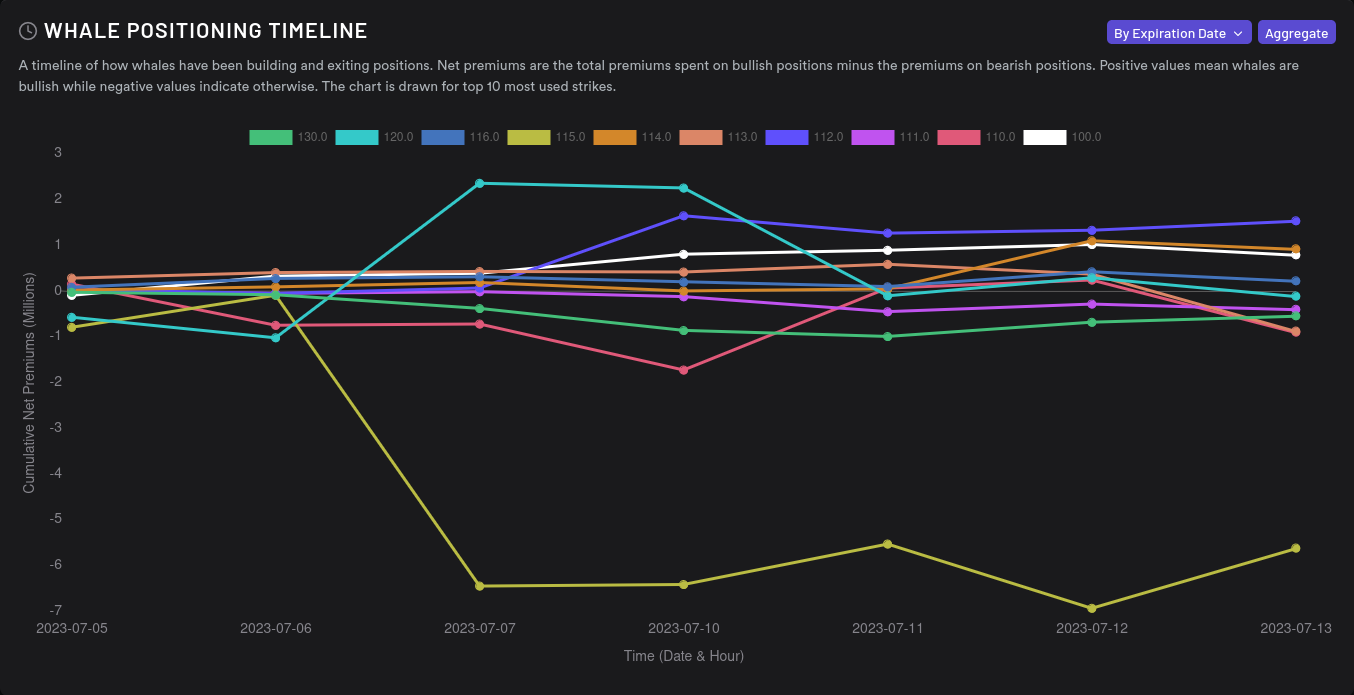
The $115 strike turned bearish on the 6th and it's a huge outlier on the chart. In addition, options are priced for a downward move of 2.4% or less.
TSLA
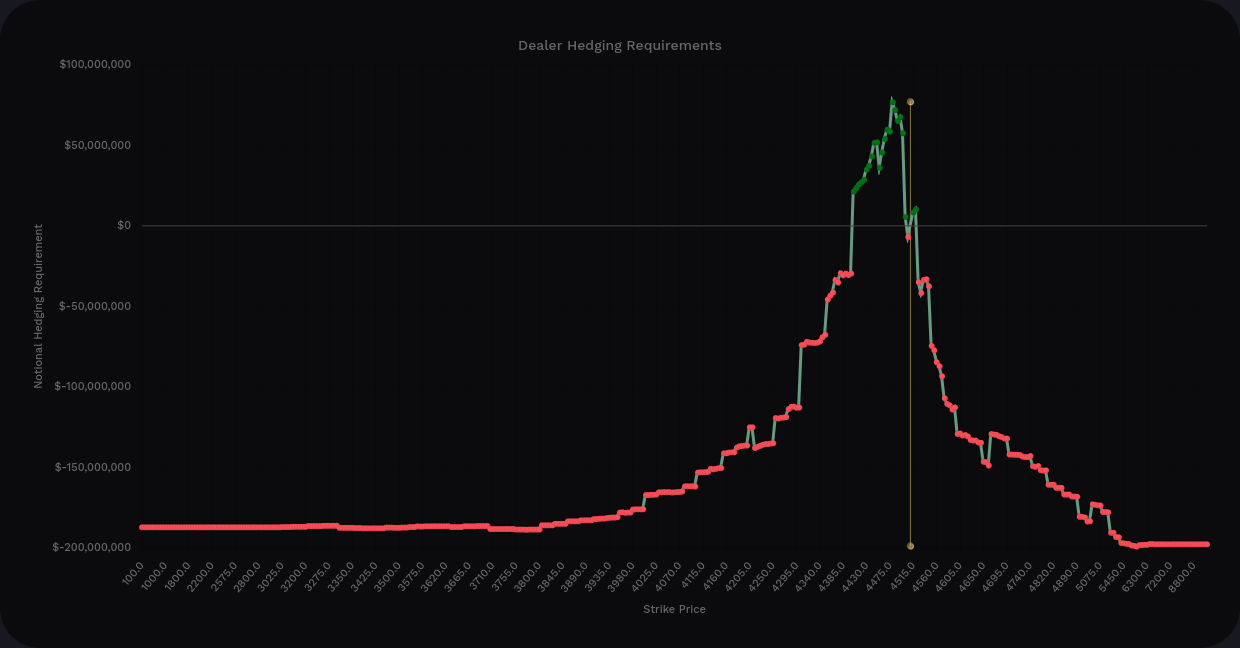
TSLA earnings are coming up next week on July 19th, so be cautious here! Let's take a look at vanna:
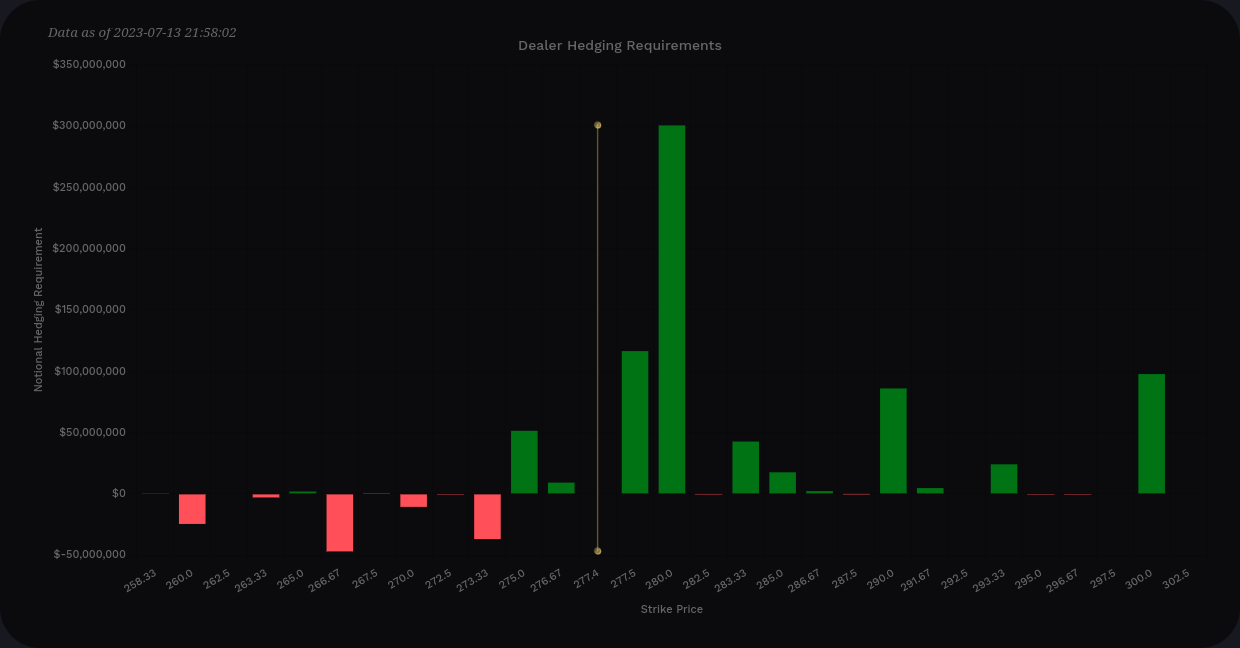
The vanna curve is still very bullish, although I'd like to see more negative vanna below price. $280 is the largest level at $300M, but $290 and $300 are still fairly large. Bear in mind that as we approach $280, the vanna effect on price for the $280 strike falls off to zero. We will need something else to keep us going past that point.
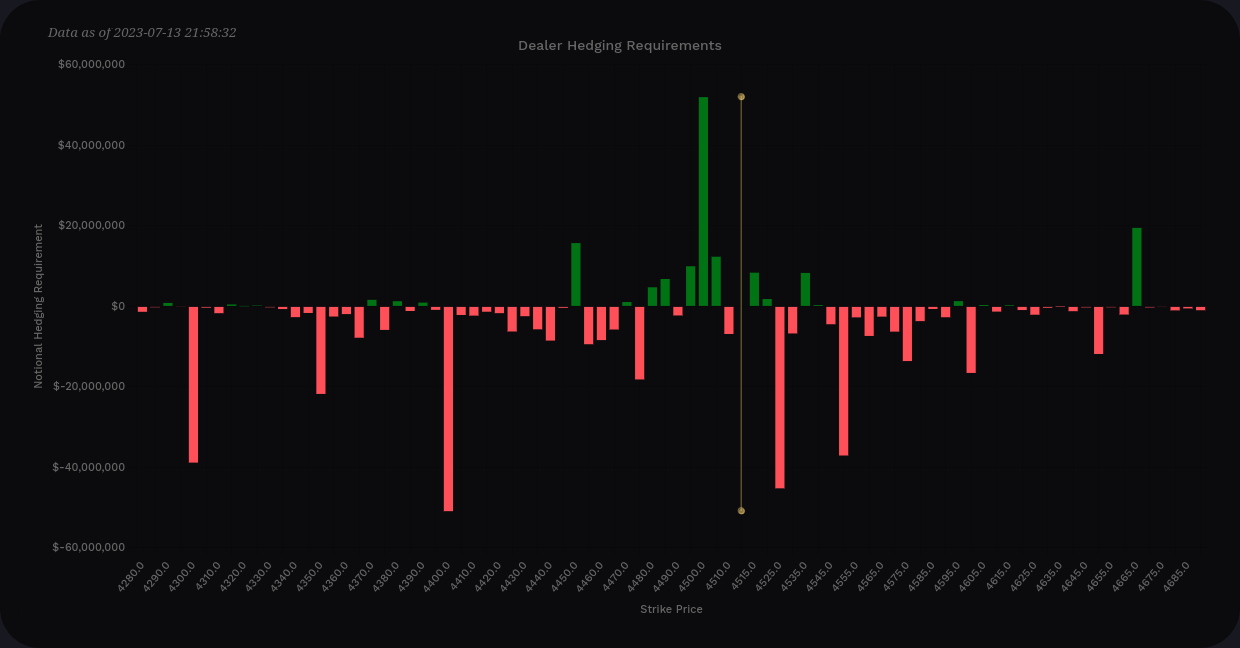
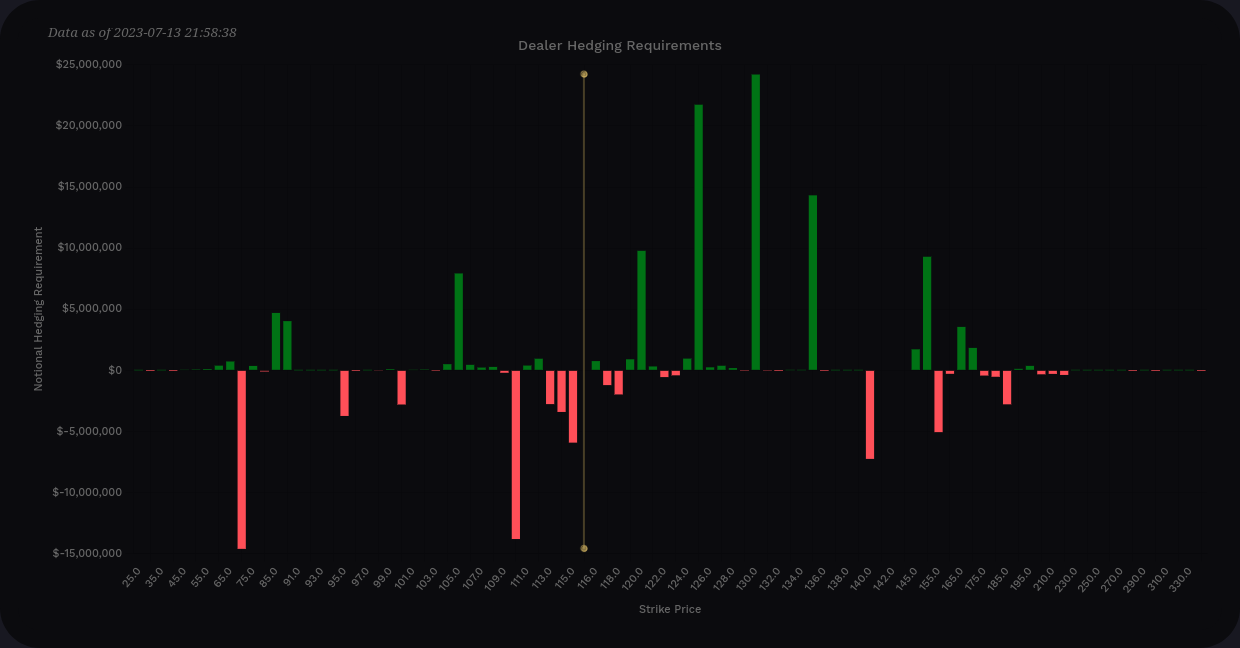
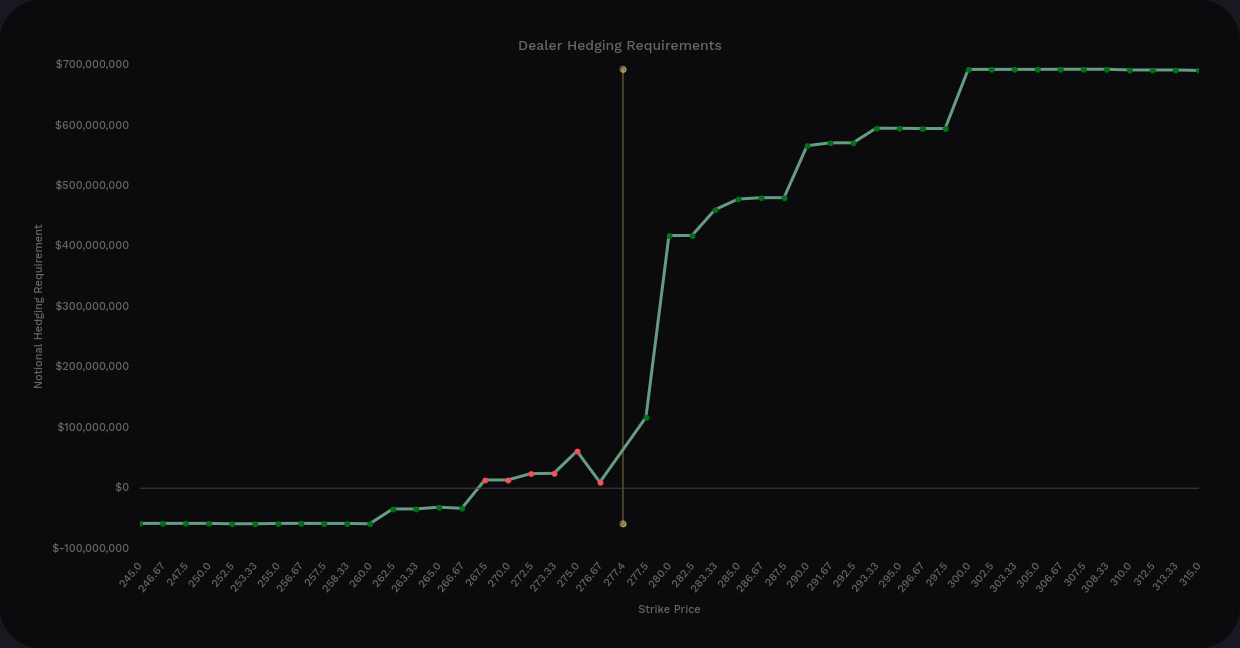
With that in mind, let's look at delta-adjusted gamma:
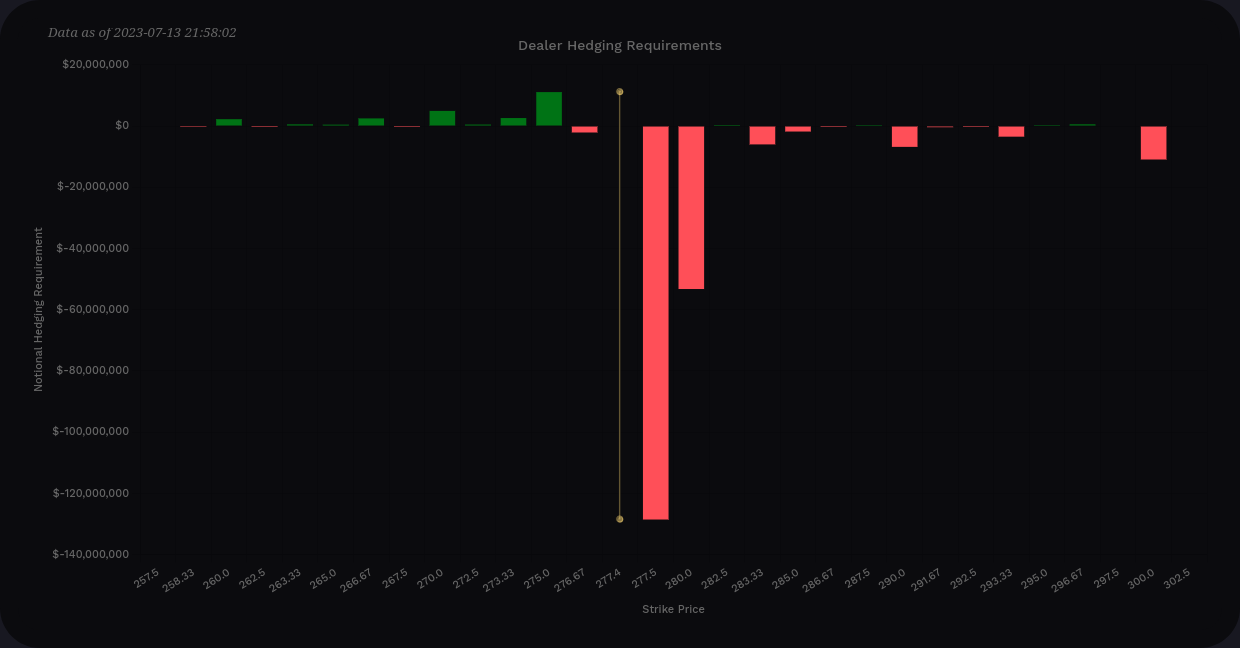
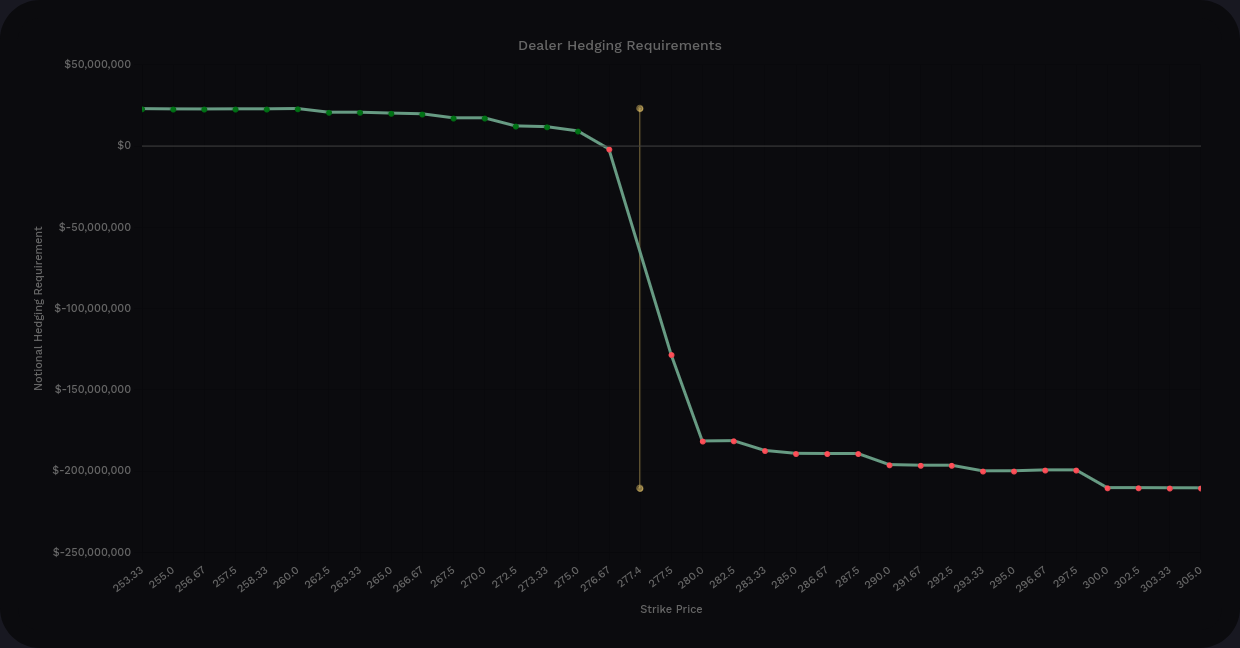
Well, okay then, There's over $180M of selling pressure from gamma at $277.50 and $280. That's going to apply some heavy selling pressure at these levels that will be very localized. Remember that vanna has distant effects on price while gamma has more localized effects.
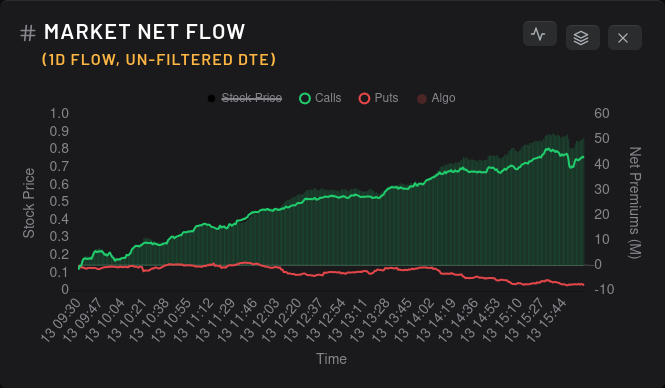
So far, we're looking at bullish vanna and a wall of bearish gamma just above the current price. How are options traders trading it?
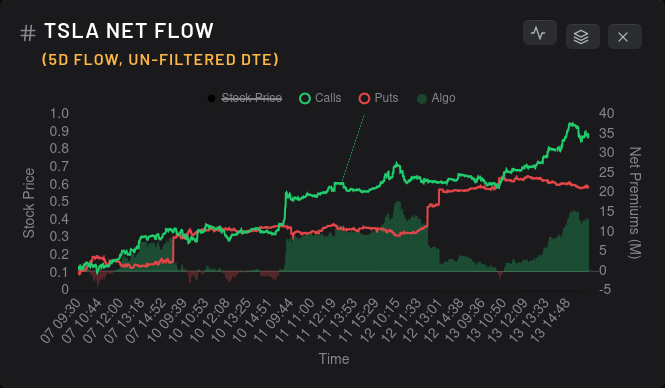
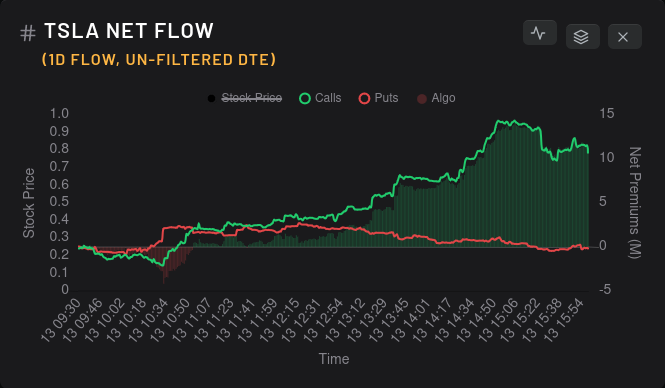
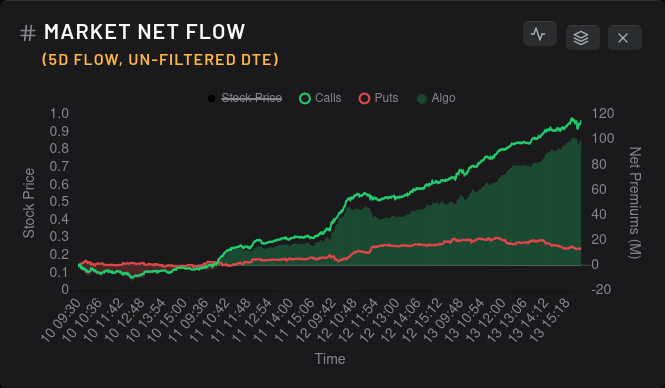
Traders had some doubts on the 12th, but the flow is incredibly bullish over a five day period. What are dealers doing?

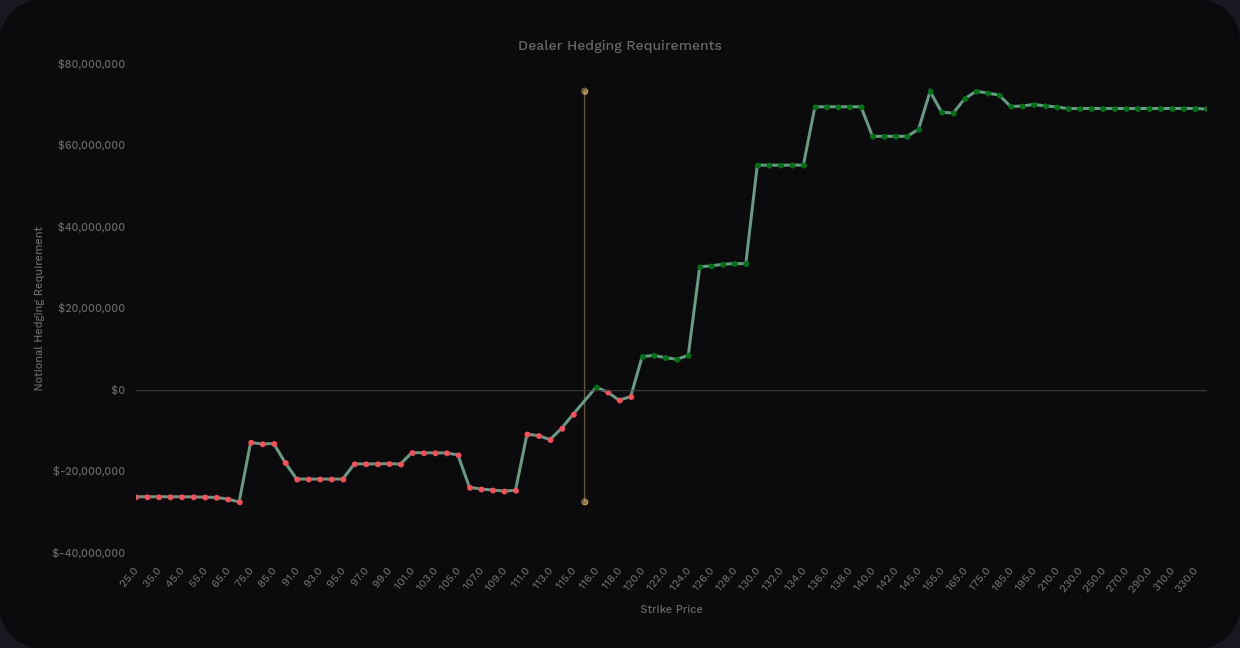
Oh no! What happened here? 😱
We had a couple of days of dealers going short (customers bullish) just like AMD but then dealers suddenly went very, very long on TSLA yesterday. When I see this paired with a gamma wall at $280, I start to think we're hitting a top. TSLA is difficult to predict, but as a trader with a bullish bias, I don't like to see this.
Short interest is coming down on TSLA:

It looks like bets for TSLA on 8/18 have turned more bearish than before:

Thesis
AMD has some improving data, but I'm still doubtful that it has a strong run above $115 in its short term future. Earnings run-ups can be wild, but I'm betting against that. I've covered all my shares from $115-$120 with short calls and pulled my short puts off the board. My cost basis is in the $90's, so an assignment in the upper $110's would be just fine with me. 😉
TSLA looks like it's approaching a top around $280, at least temporarily. I sold a $295 call for 7/21 and I'm leaving it on the board. I'd like to roll it down to $290 or $285, but I might just leave it where it is and take it off before earnings.
As always, I track all my trades on Theta Gang shortly after they fill and you can follow along with my trade notes there.
Good luck today! 🍀
Discussion