Vanna options analysis for August 31

It's all vanna all day on the blog today. I'll give a little backstory and dive into AMD, TSLA, and SPX vanna charts. 📈

It's the end of August and some of the feedback I receive often is: "What is this vanna you talk about?" You're in for a treat because it's all vanna all day on the blog today. 🎉
But first:
All investments come with significant risks, including the loss of all capital. Please do your own research before investing, and never risk more than you are willing to lose. I hold no certifications or registrations with any financial entity.
Let's go! 🤓
Vanna recap
Vanna is a second order options derivative that examines how deltas change when volatility moves around. It's one of the "options greeks". Here's a simpler way to think about it:
- You have a long call out of the money at 0.30 delta
- Implied volatility on the underlying stock increases (incoming earnings, general market anxiety, etc)
- Deltas expand for all options due to increased volatility and your option is now at 0.35 delta (closer to the money)
- The price of your option will now move faster relative to the price of the underlying
For individual retail investors, a move like this is exciting because the value of your option contract went up! However, for dealers and market makers, changes in implied volatility can cause them to have a bullish or bearish bias in the market. Dealers always want to remain neutral, and in some situations, are legally obligated to do so.
Trading with vanna
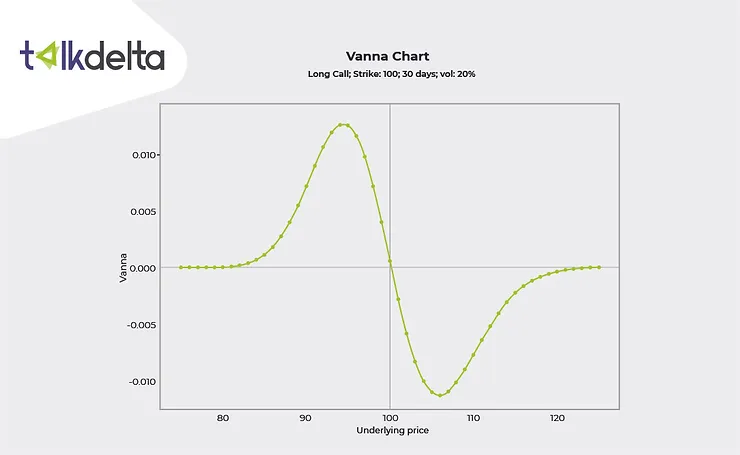
Vanna at certain strikes can highlight areas where dealers might need to take certain actions to dynamically hedge their positions. There's something unique to vanna in that it has almost no effect when price is right on the vanna level. The greatest effect is on options sitting at 0.15-0.35 delta, as shown below:
Trading with vanna requires knowing two things:
- Where big vanna levels are for a certain stock on a certain set of expiration dates
- A best guess on where implied volatility might be headed soon
Expanding implied volatility (increasing IV) or contracting implied volatility (decreasing IV) has an impact on dealers and they are often pushed to buy or sell shares in underlying stocks depending on the vanna exposure at certain levels.
Let's start with an example:
AMD's vanna
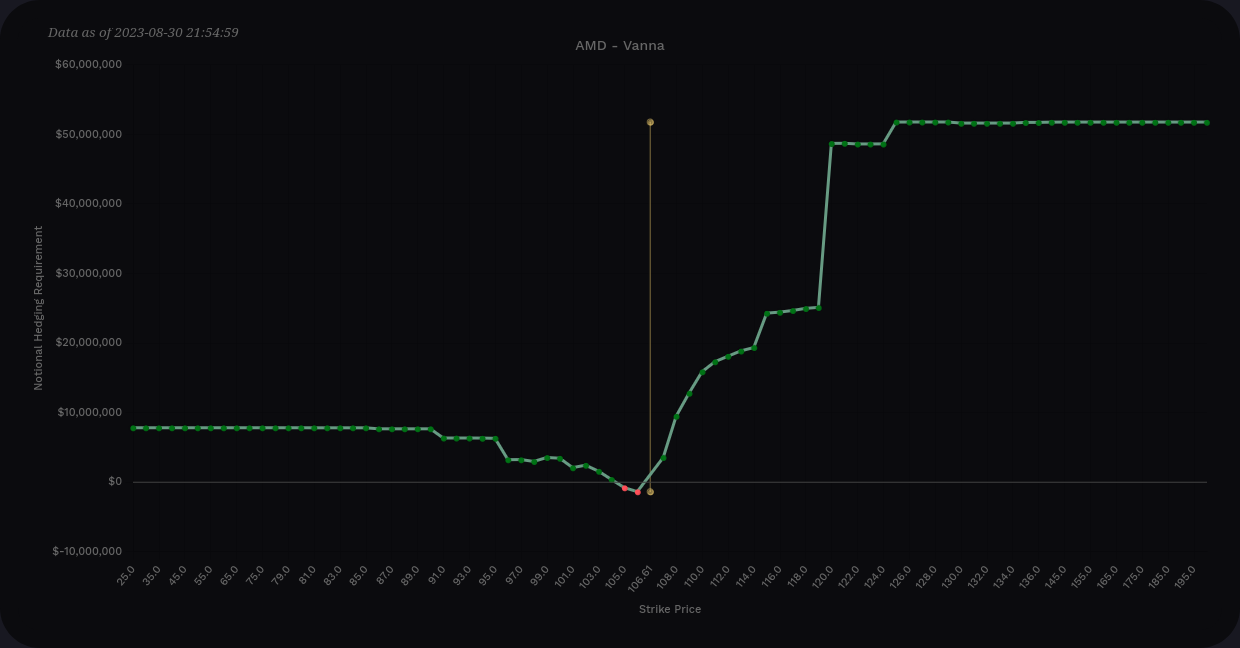
You can look at vanna specifically on certain strikes and on aggregate. Here's AMD's vanna across all expirations from Volland:
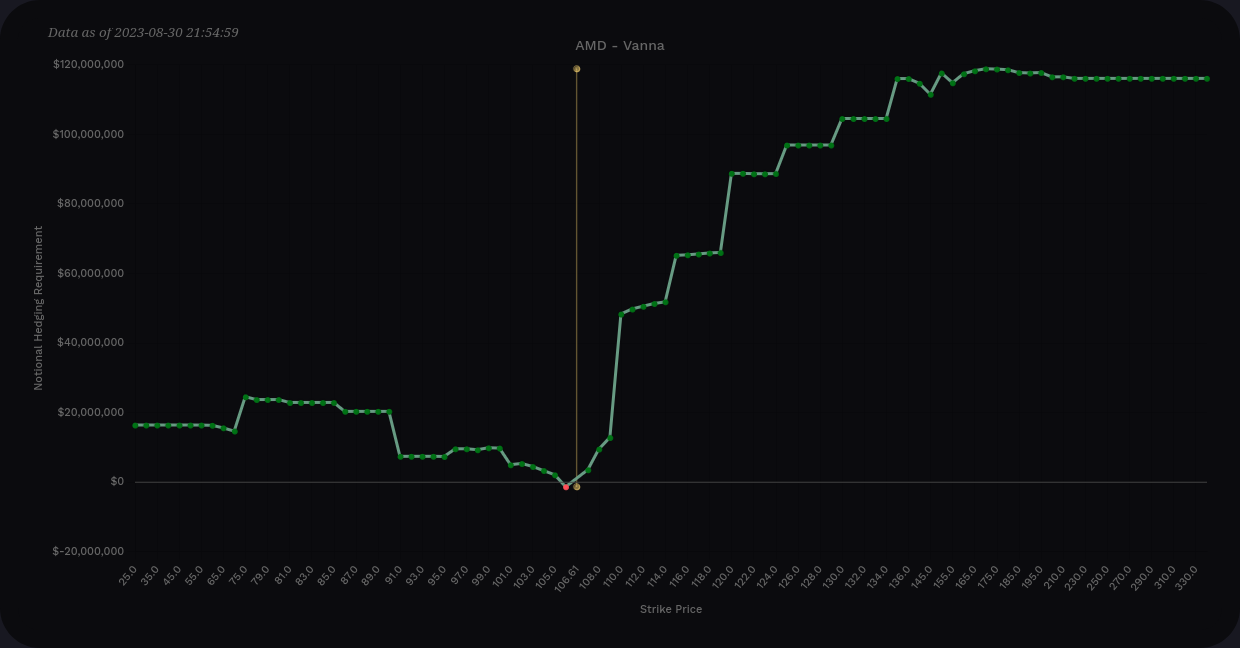
Start with the aggregate chart on the right. Both extremes on the chart are very positive and there's almost no negative vanna on the chart. This is an example of very positive vanna, but don't rush to call this bullish!
In an environment with contracting IV, this is definitely bullish. However, if you think IV might increase soon, this chart is quite bearish. Positive vanna is bullish only in environments with steady or decreasing IV.
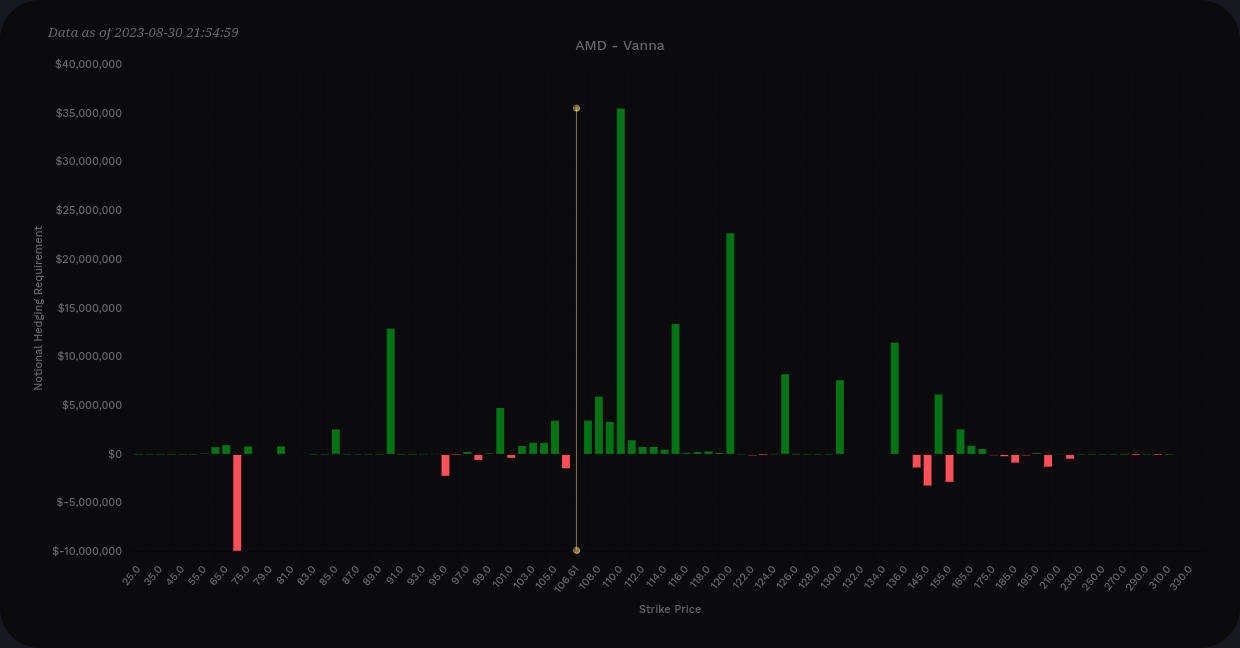
Let's examine the chart on the left with details for each strike. This detailed chart shows that positive vanna is strongest around $110 and also relatively strong around $120. There's a generally positive range from the current price up to about $135. All of these will exert a pull on AMD's price if IV is contracting.
Based on technical analysis and recent price moves, I know that $120 is a difficult level to cross, but AMD has approached it several times. This detailed vanna chart suggests that a move approaching $110 is highly likely and there's a decent chance of an approach to $120 as well.
I say approach here because vanna has no effect once the price reaches the strike with large vanna levels. The effects are greatest in that 0.15-0.35 range.
You can also examine one expiration at a time or combined several expirations to get a more short-term picture. Here's AMD's vanna from this Friday, 9/1, through October's OPEX on 10/20:
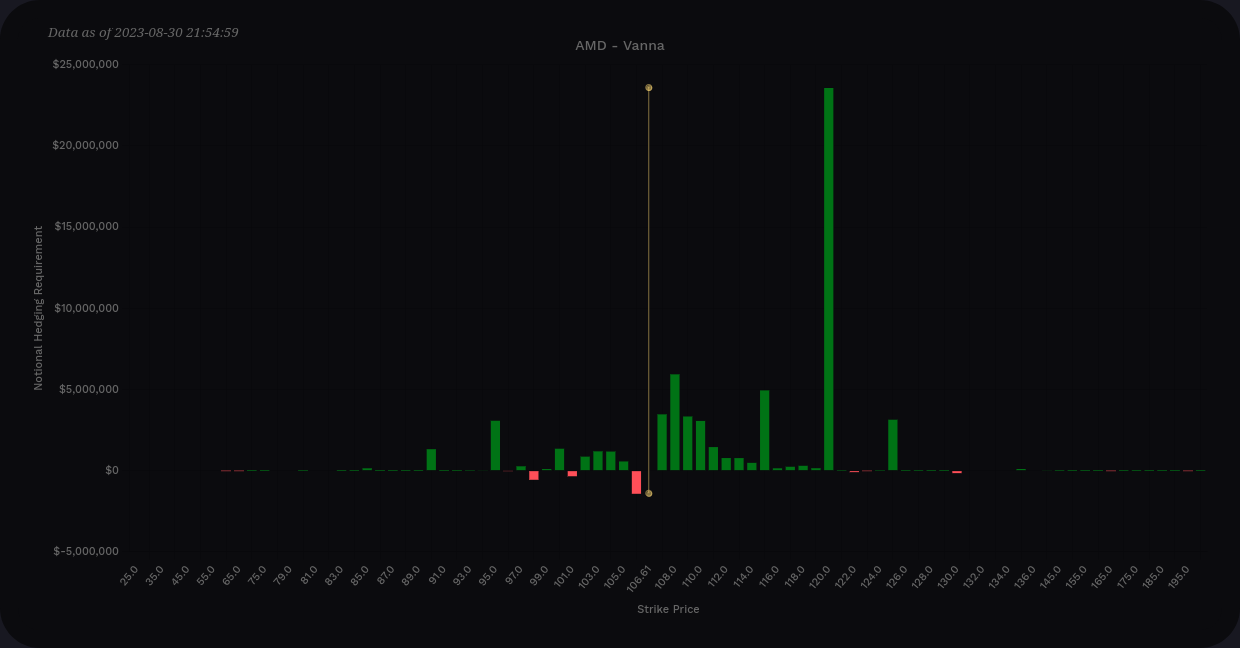
Again, this is incredibly positive which suggests bullish moves in an environment where IV is contracting. Also, the largest positive vanna level by far is the $120. Nothing else is close. There's a good chance that if IV remains steady or contracts, we will approach $120.
You might be thinking: "Okay, so where are vanna effects highest right now? How far away from $120 do we stop?"
That's tricky. It depends on the IV of the stock, which expiration you're trading, and the overall IV of the market. If AMD made a run in the short term that went into the $115-$120 range, I'd likely look at taking profits. Vanna effects will drop in that range.
However, it's important to keep an eye on the charts, because if we approach $120 and suddenly the $130 strike starts showing up on the vanna charts, we may continue to get pulled higher to that strike.
TSLA
First off, understand that TSLA is absolutely bananas. 🍌 The stock moves in huge swings at a moment's notice, often when there is no real news or economic data in play. This is a risky stock to trade and that's evident by the sky-high options premiums for most expirations.
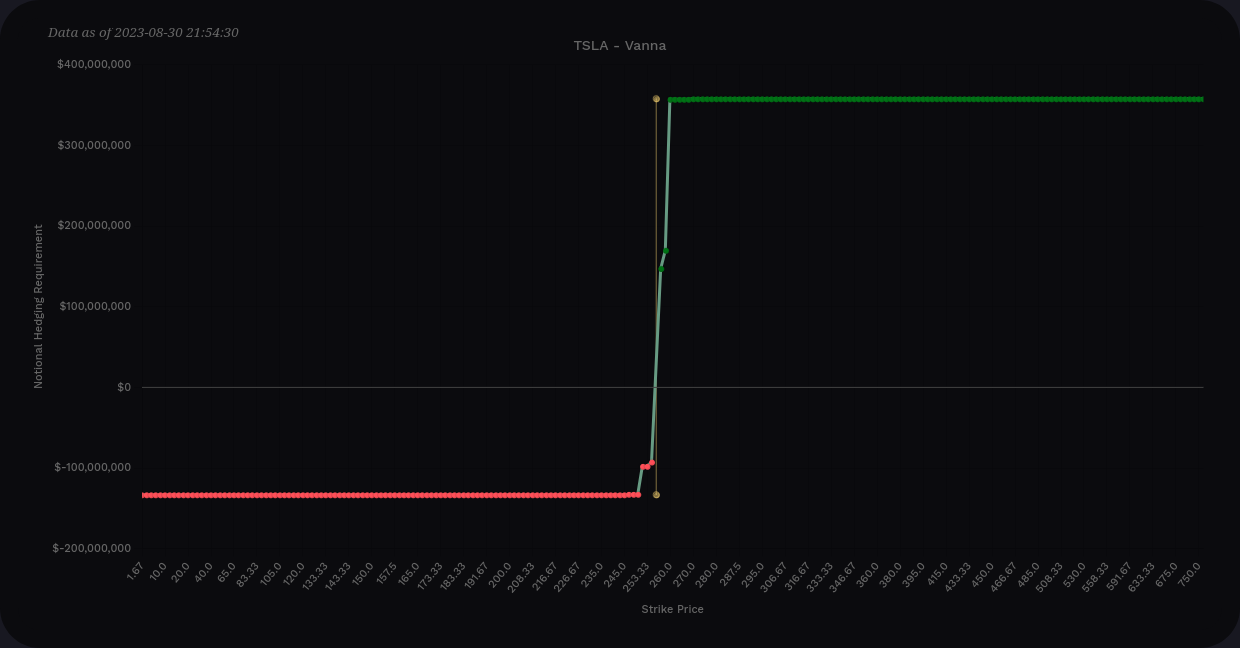
But hey, we're here to get nerdy, so let's check TSLA's vanna charts. Let's start with the aggregate:
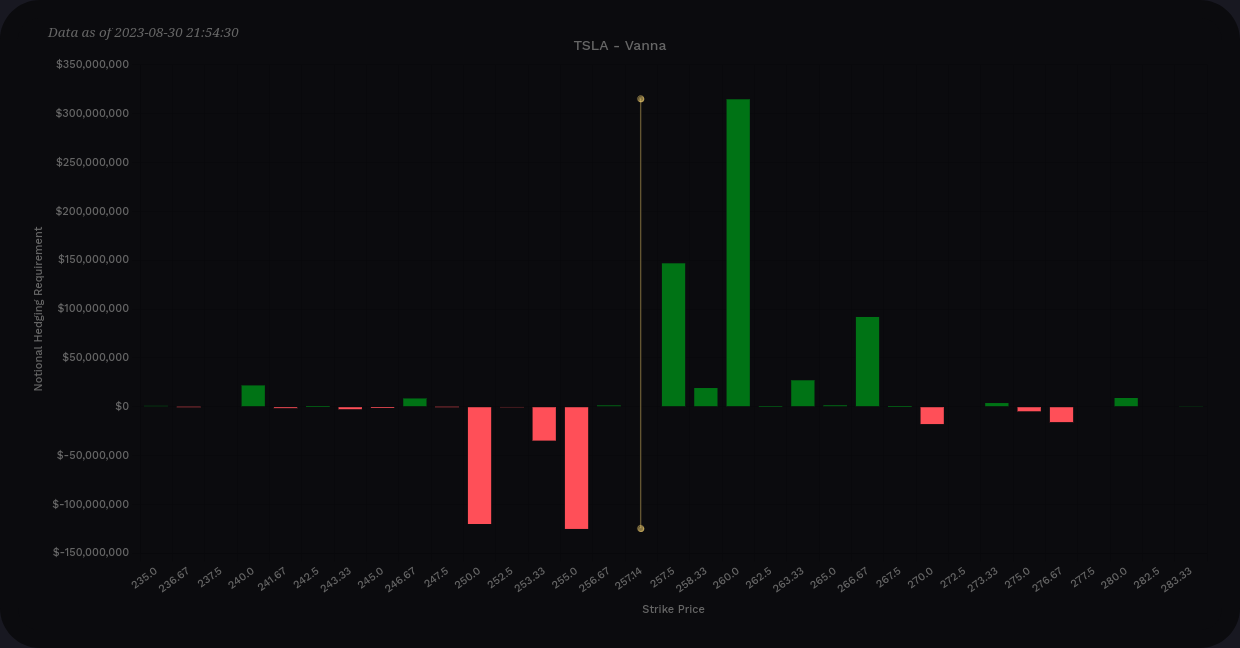
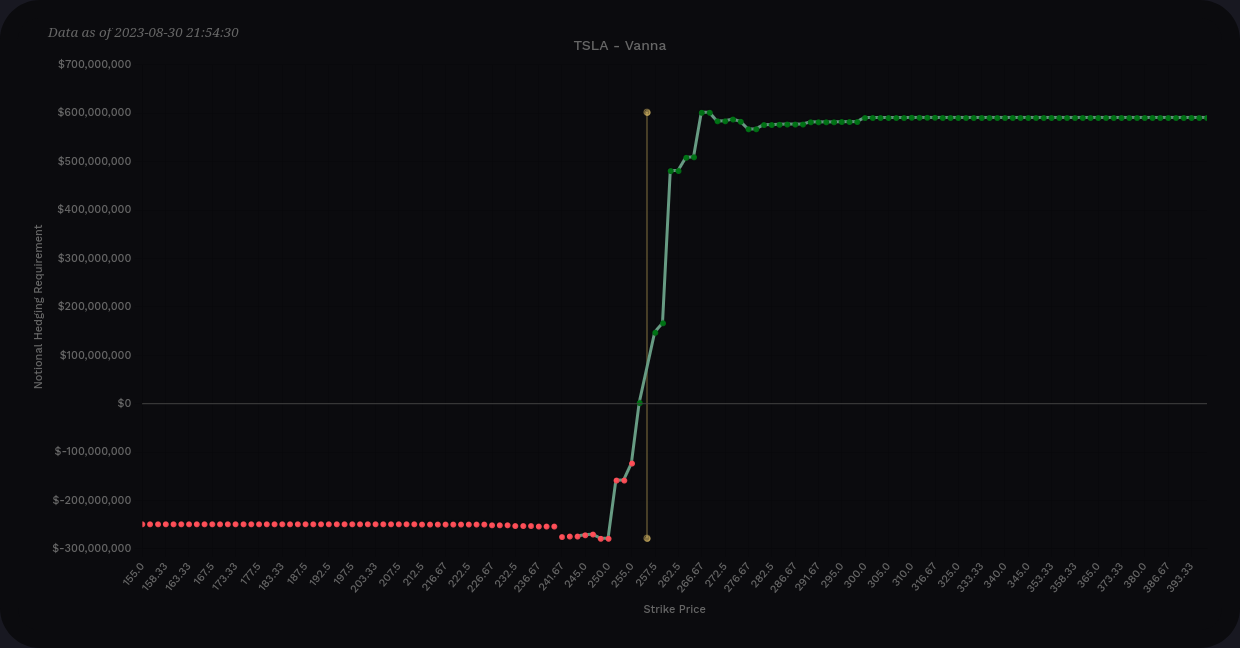
On the aggregate curve (right, or second chart), the positive side fits around $600M and the negative side on the left sits around $250M. My first takeaway is that the positive side is about 2x the negative side, which is quite positive. (This would be bullish in a contracting IV environment.)
The detailed chart shows a sharp positive level at $260 with generally positive vanna from $250 to $267. If IV contracted for TSLA, I'd expect a pull towards $260, but I wouldn't think it's likely we could cross that level.
On the negative side, we have some vanna down at $250 and $255 that is worth examining. In the event of expanding IV (maybe TSLA news appears that isn't good, or something happens in the broader market), I would expect TSLA to move to these areas.
Just as with positive vanna magnets, these negative vanna lines would pull until the 0.15-0.35 delta range and then their effects would shrink to zero. If TSLA fell into the $250-$255 range, I'd consider that vanna effects are done there and I'd look for other data in the chart to suggest a support level.
Let's check TSLA's vanna levels for this Friday through October's OPEX (9/1-10/10):
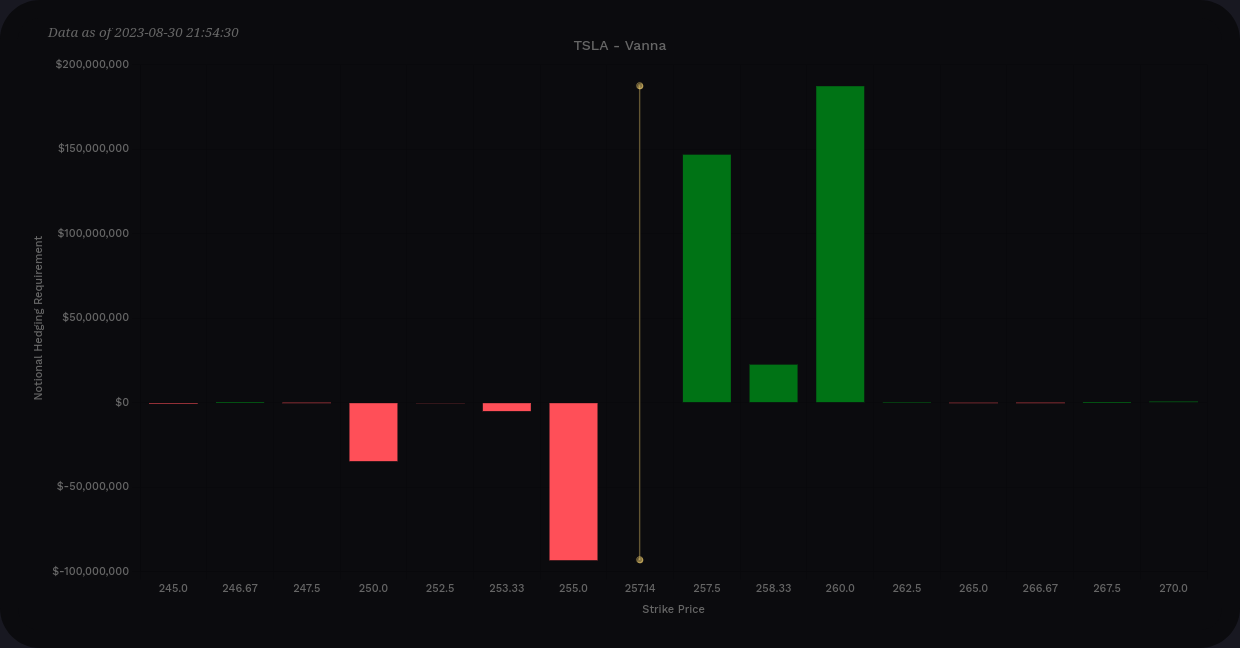
This is a much more concentrated chart. Contracting IV would likely pull us towards $260, but not any further. Expanding IV would drag us to $255, but price is sitting around $257 this morning. The effects of vanna from $255 are dwindling.
I'd argue this is a pretty bullish situation for TSLA here, but anything over $260 feels off limits. Likewise, anything under $250 also seems unlikely.
SPX
Examining SPX vanna is tough. There are lots of strikes to consider and tons of hedging involved. Let's check the aggregate charts:
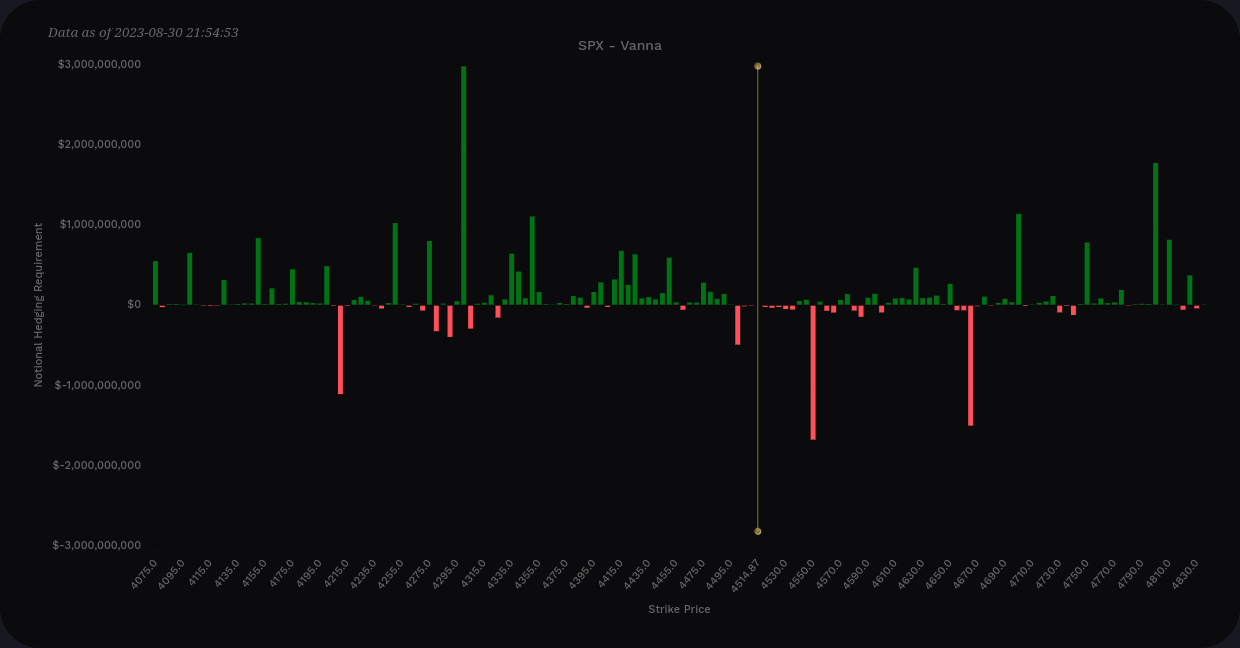
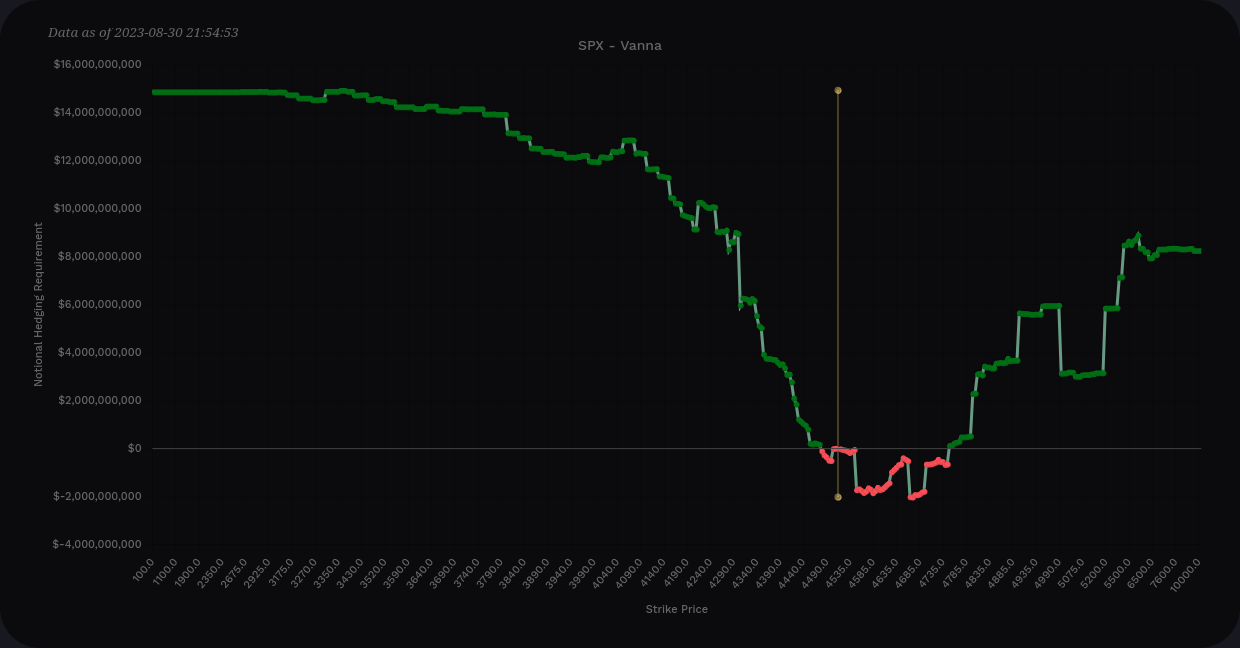
It's fairly common to see this setup for SPX where it's positive on both sides. However, we have some negative vanna above the current price. If IV contracts, these strikes could fight against an upside move.
On the detailed chart, 4550 is the closest strike to us now. It's quite negative, so an increase in IV could pull us up closer to that level. 4665 is next to the right and it's negative as well. Generally, increasing IV will drive prices lower, but that's not true in all cases.
On the positive vanna side, we have 4300 as the largest bar. As I said earlier, generally price goes up when IV goes down, so I'm not really thinking we sink to there.
There are some positive vanna bars above the current price, but they're quite far out at 4700, 4800, and 4900. Those are tough targets to reach with two significant negative vanna levels between them and our current price.
This leads me to think our current SPX level is a little dicey. I'd like to see positive vanna above price, hopefully somewhat nearby, before I'd go bullish here. Then again, we may be looking at some hedges from traders here and there are plenty of other forces in the market besides vanna.
Recap
There are a few critical things to remember:
- Bullish traders want to see positive vanna + contracting IV or negative vanna + expanding IV
- Bearish traders want to see the opposite
- Vanna effects are strongest at 0.15-0.35 delta from the vanna level
- Vanna has no effect when price is on the vanna level (that's gamma territory)
- Check aggregate vanna first to get a high level idea of vanna across all strikes, then look at detailed charts for potential strikes to target
Here's what I'm thinking on my favorite tickers to trade:
- AMD looks bullish to $120, especially going into 10/20.
- TSLA looks range bound from $250-$260 at least through 10/20. Also, TSLA is bananas. 🍌
- SPX has a peculiar setup happening and expanding IV might actually pull us upwards a little bit rather than down
My trades and trade notes are always up to date on Theta Gang. Good luck to everyone today! 🍀
Discussion