Vanna roundup for SPY, AMD, TSLA, and OXY on 10/13

It's all vanna all day today! Earnings season is here and sometimes it helps to pull back and take a higher level view of where dealers are positioned. ✈️

Happy Friday! Earnings season is just getting started and we're in the midst of a ton of market chop. These types of markets push me to begin looking at things on a broader view to avoid the distraction of wild intraday moves. 🎢
All investments come with significant risks, including the loss of all capital. Please do your own research before investing, and never risk more than you are willing to lose. I hold no certifications or registrations with any financial entity.
Today will be a focus on vanna. Don't know vanna? Don't fret.
Quick vanna overview
Vanna can get really complicated, but in short, vanna measures how much deltas move with a change in volatility. Said another way, when volatility across the market or volatility on a single stock goes up, it changes the deltas of a particular options contract.
If you're holding a .30 delta call on a stock and volatility increases, your deltas will increase because the stock price is likely to move by a larger amount. Your .30 delta call might become 0.35 delta.
For a retail trader looking for a profit, this is great! You're making money! 🎉
For a big market maker (dealer), this is a situation where they must adjust their hedges. Remember that dealers never want to have a bias in the market. In most situations, they're not allowed to have bias. We can look for these pile-ups of potential hedging areas and use the knowledge of what dealers must do at those spots to make better trades. 🤓
Just like other options greeks, there's positive vanna, negative vanna, and it acts a little differently above and below the current price. Positive vanna above price often becomes a magnet for price as implied volatility decreases. When IV increases, positive vanna has a repellent effect and dealers sell shares to hedge against increasing IV.
What to remember:
- Positive vanna with decreasing volatility: bullish price pressure
- Negative vanna with decreasing volatility: bearish price pressure
- Positive vanna with increasing volatility: bearish price pressure
- Negative vanna with increasing volatility: bullish price pressure
Keep in mind that dealers are only part of what moves the market! Sure, dealers might make up to 40% of options trades according to recent data, but the market also includes retail investors, hedge funds, and institutional investors (like Vanguard or Blackrock).
If you want to read this in much, much more detail, I suggest reading Sheldon Naternberg's Option Volatility and Pricing. You can also read Jason's Wizard of Ops blog post and FAQ's to learn more (he runs Volland and I'm a subscriber).
SPY & SPX
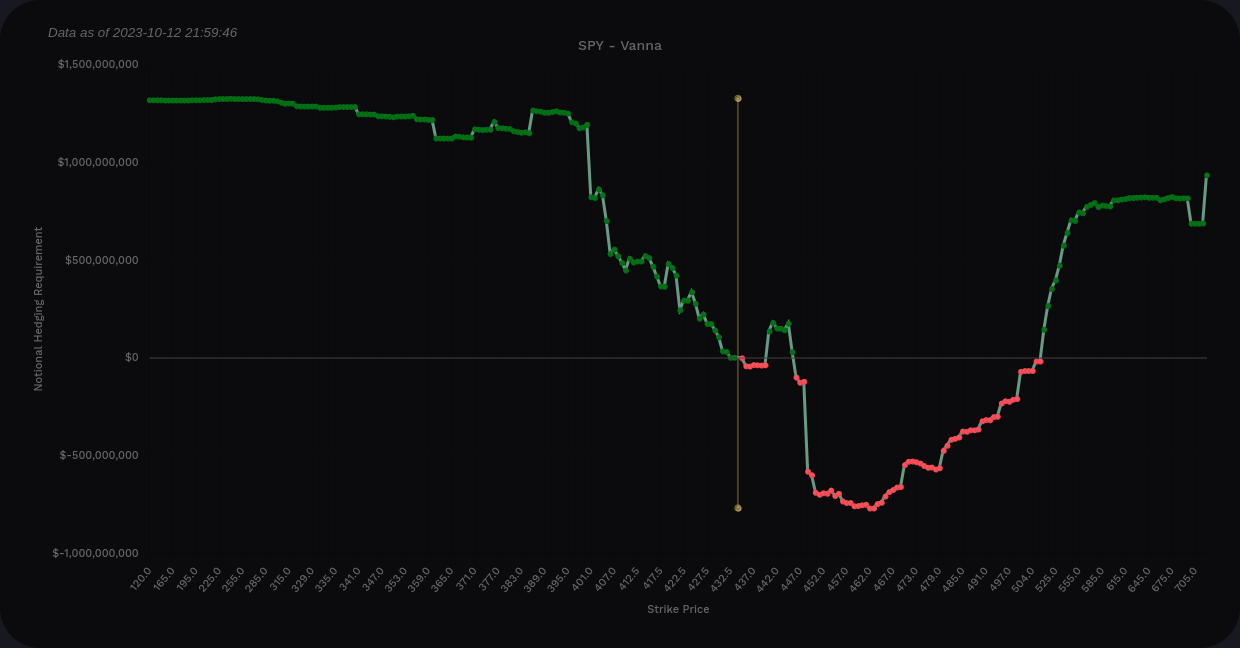
Let's go over how to read these charts. The curve chart (the one with a line graph) shows that vanna is positive at the left and right extremes. This means that across the board, increasing IV will add buying pressure here and decreasing IV will add selling pressure.
Note that there's a dip just ahead of the current price. That's where we look to the bar chart to localize the vanna levels.
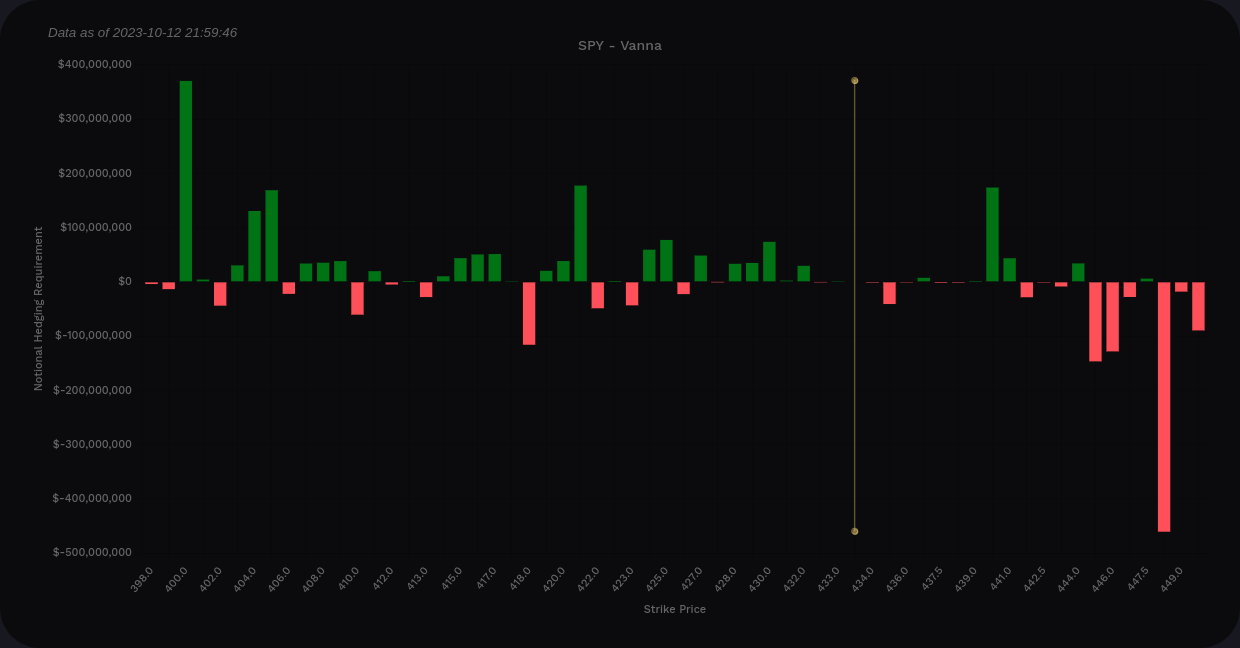
SPY aggregate vanna from Volland
The bar chart gives us some hints that $440 and $441 might be the end of the line if we get an IV crunch. Negative vanna starts showing up around $445 and gets very strong at $448. Those will limit an upwards move.
On the downside, we pick up small pockets of increasing vanna with the first big line at $421. This is very close to where SPY made a stand earlier in October and rallied from it. It fell to $420.19 at its lowest and there was a battle between bears and bulls in that area.
Let's see if SPX has similar data.
Bear in mind that SPY/SPX have different hedging characteristics because they are traded very differently. You can't really own shares of SPX because it's an index. SPY has a dividend whereas SPX does not. There are tons of additional differences that I won't go into here.
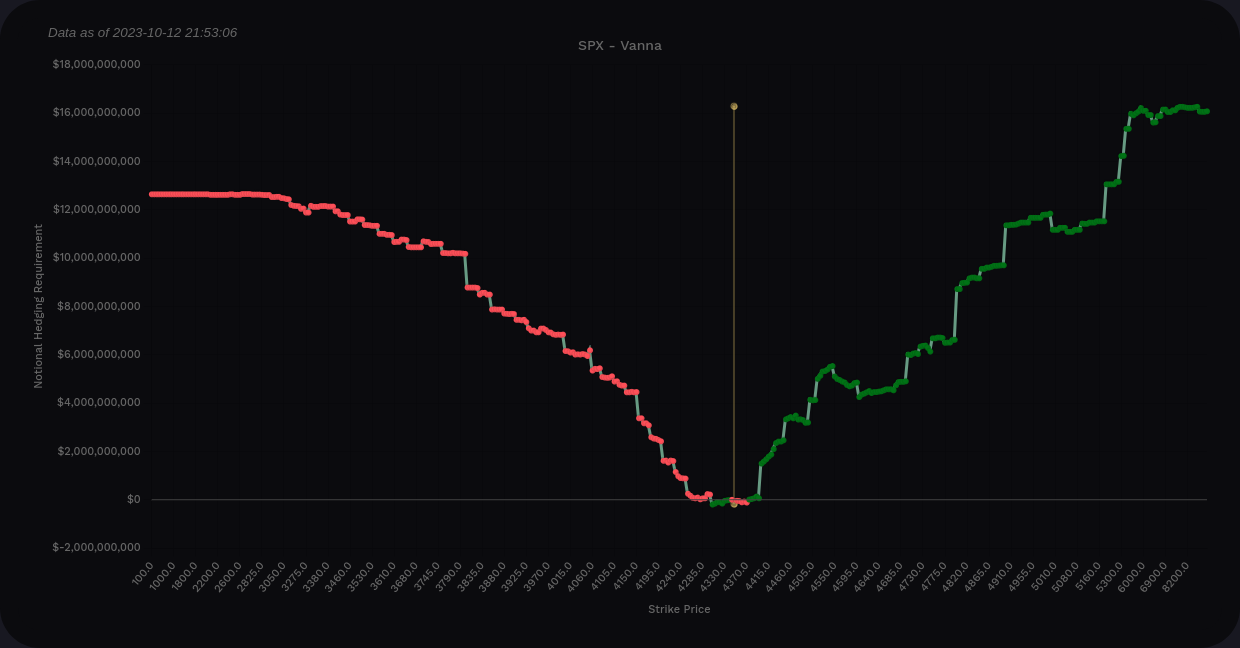
The curve chart shows vanna as positive at the extremes and almost entirely positive across the whole chart. Increasing IV would very likely lead to bearish price pressure on SPX.
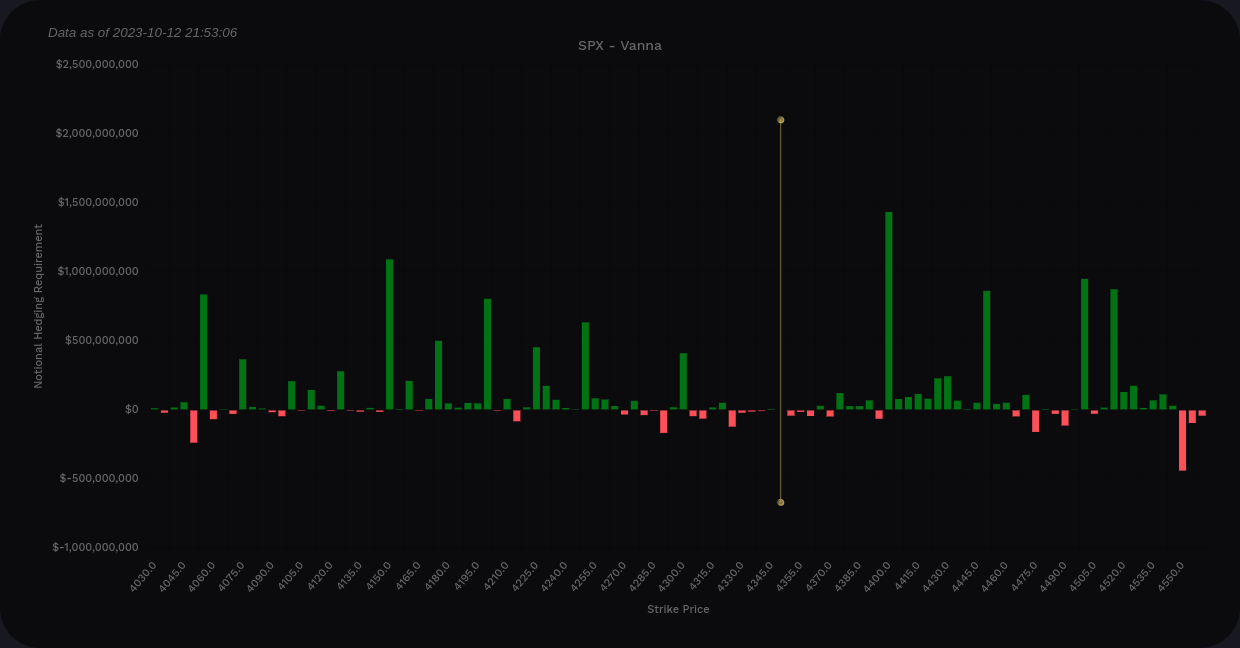
SPX aggregate vanna from Volland
If we look at the bar chart, the largest positive bar above the current price sits at 4400. That's likely our target for a IV crunch-induced rally.
On the downside, we have several interesting levels here. 4300 shows up first, followed by 4250. These keep increasing on 50 point increments until we reach the largest at 4150. It's not shown on this zoomed in chart, but the most massive bar below price appears at 3800. That's an area where lots of VWAP lines from the COVID lows come together.
Losing 3800 would certainly put us in a bad spot.
AMD
With earnings approaching on 10/31, AMD seems to be stuck in a tight zone. 🎃
First up, the curve shows positive vanna at the extremes. In fact, there's very little negative vanna on the whole curve. This suggests that an IV crunch will add lots of buying pressure. IV expansion would push price down.
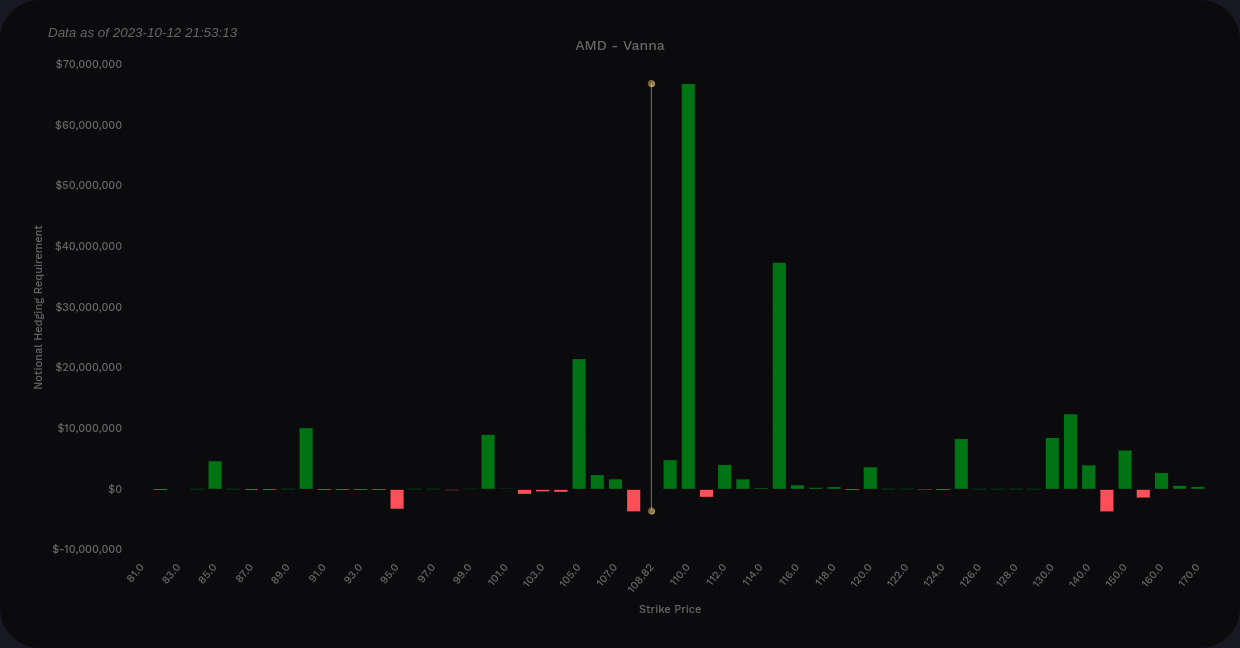
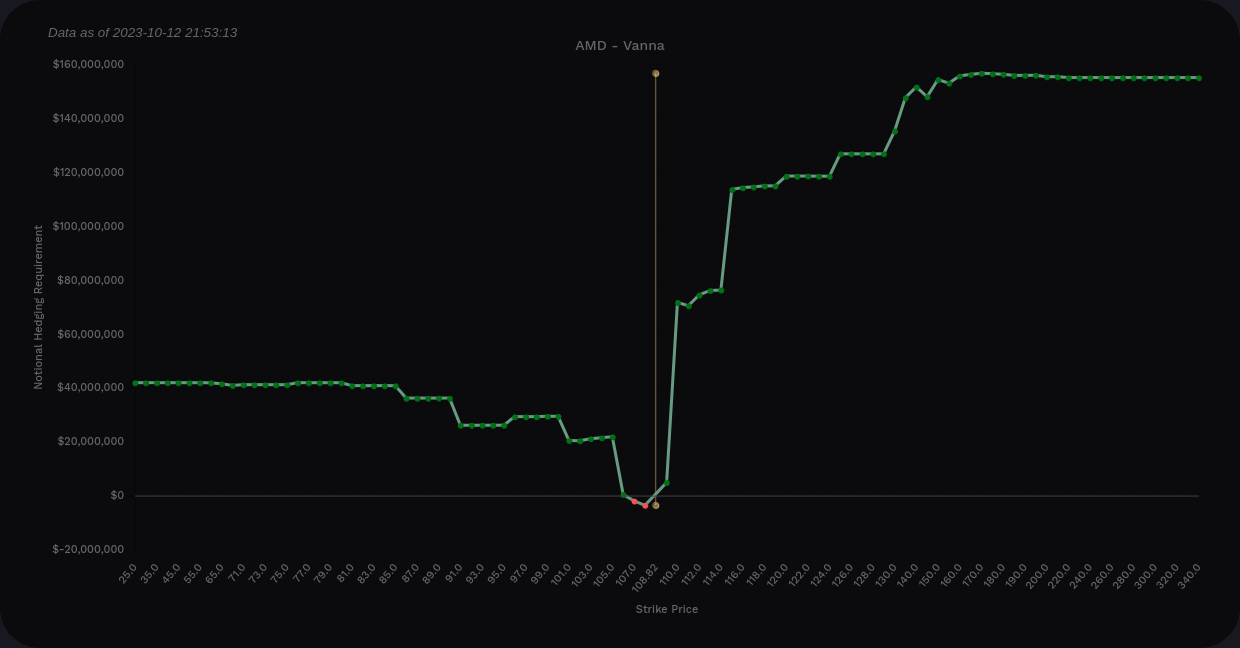
AMD aggregate vanna from Volland
Looking at the line chart, our biggest line is $110, followed by $115. After $115, there are some small lines, but none seem big enough to have much effect.
Will we have a price run-up before earnings? Well, the last expiration before earnings is 10/27 and we can examine data from now until then.

Where did the $115 go? 🤏
An earnings run-up doesn't look terribly likely here. $110 is the biggest level on the chart and we're very close to that level now. That reminds me about one more thing:
Vanna effects run down to zero as price moves up to the strike on these charts.
TSLA
Earnings are coming up on 10/18 for TSLA, so these charts might be a bit skewed.
Our line chart looks a bit different from the others! What happened here? Our positive extreme is around $500M and the negative side is around $132M. This is still a very positive vanna profile here on aggregate.
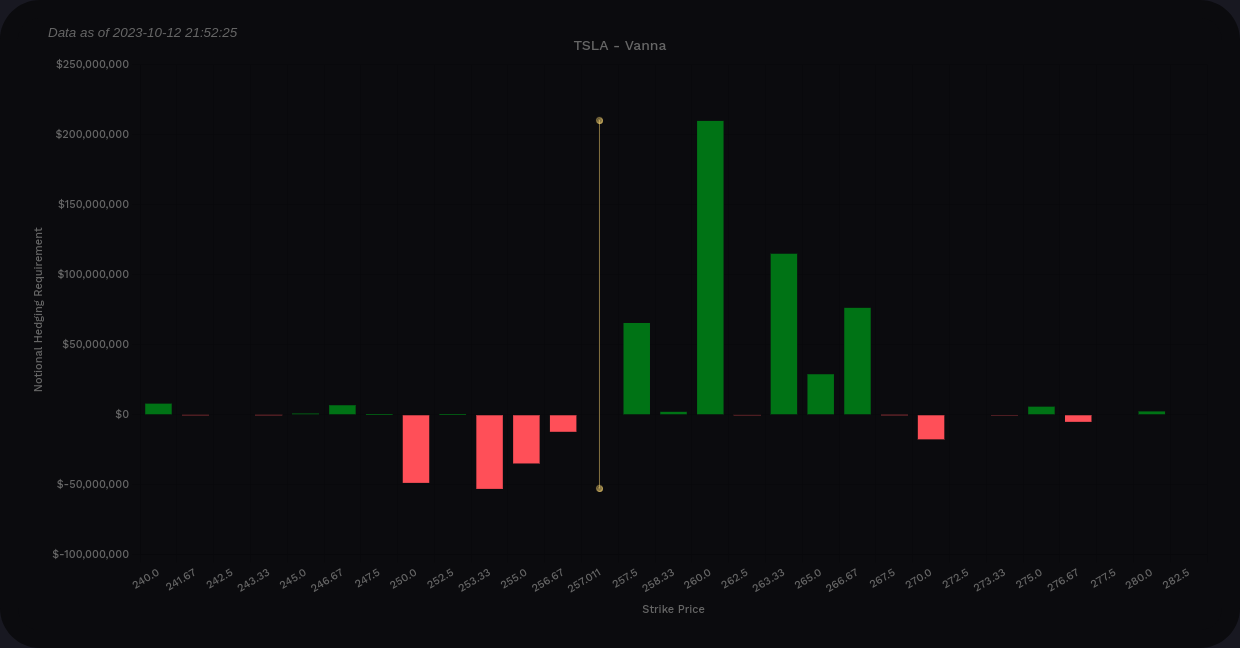
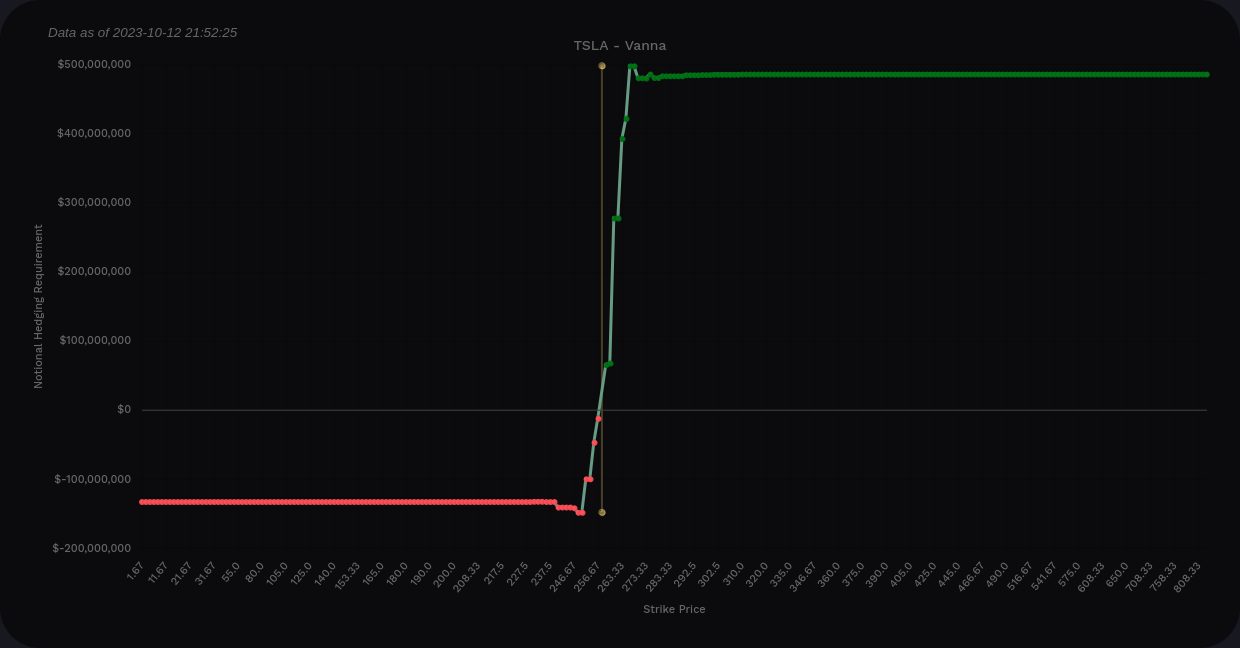
TSLA aggregate vanna from Volland
The bar chart suggests that $260 is likely a bullish target in the event of an IV crunch. There are some additional lines in the $260's that could be secondary targets, too.
There's not much to help toward the downside here. If IV increase significantly, price could move a lot. Bear in mind that as price passes these vanna levels, the sign flips, so these negative vanna levels would become positive and TSLA's already positive vanna profile would become more positive.
These charts suggest to me that traders aren't looking for big moves in TSLA, at least in the short term. Then again, TSLA's volatility is so wild that it often disobeys plenty of analysis. 🙃
OXY
I'm still a bit new to OXY and I'm learning its patterns. The vanna curve here is almost entirely positive with most of the positive levels above the current price.
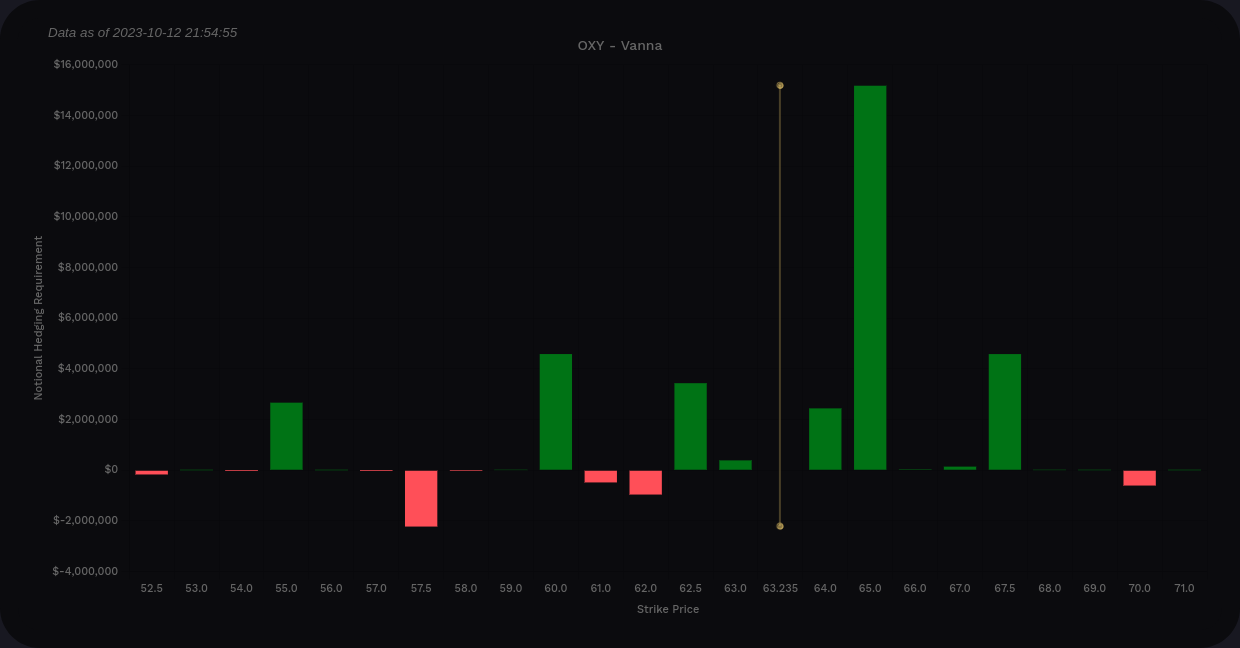
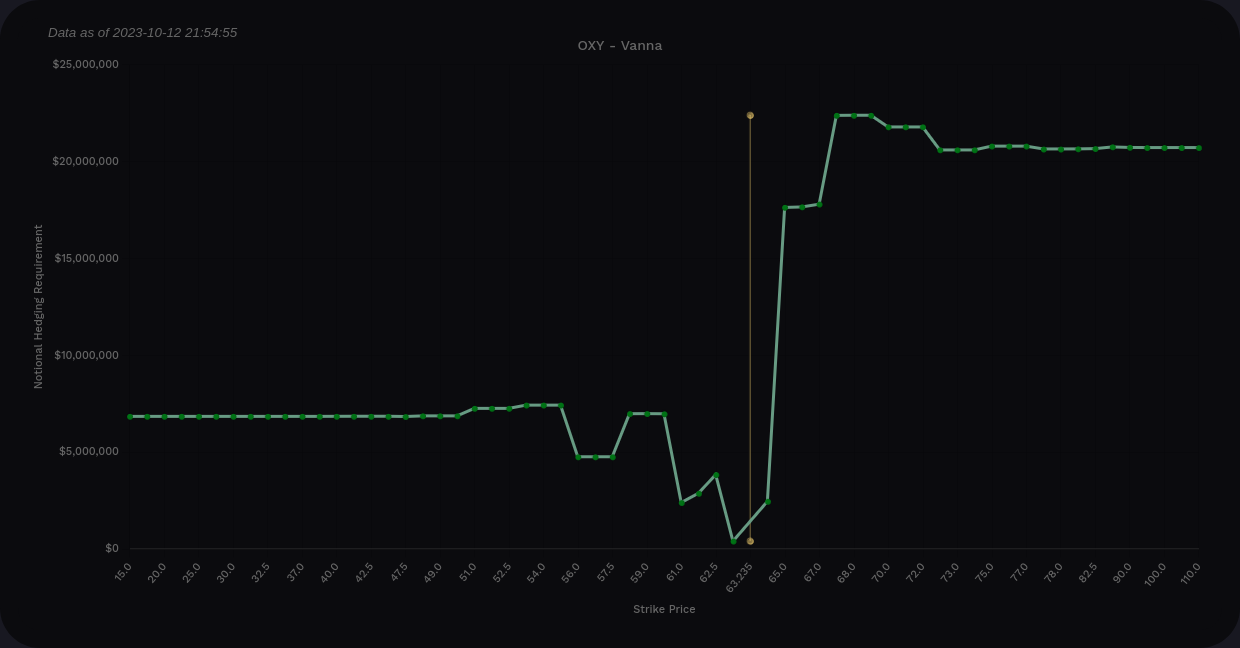
OXY aggregate vanna from Volland
The bar chart suggests $65 as the likely target and it's sitting just over $63 this morning. The vanna effects from $65 are likely waning with price being this close. Further IV crunch could get us to $67.50.
IV expansion could get us down to $60. That's where OXY made its stand earlier this month and there's a significant volumetric order block there from $59-$60.
Thesis
With all of this market chop, there are two schools of thought I've seen so far:
Give yourself more time for trades. Pick solid levels and choose expiration dates that are a little further out to give yourself more time to be right. This reduces the effects of gamma on your trade and allows for more price movement before expiration.
Scalp short term moves. This can be fairly stressful, but with stocks being held to such tight levels, you can trade intraday moves between those levels for quick in-and-out scalps. These trades make me a little more nervous since they require some attention throughout the day.
I'm choosing to do a little mix of both lately but I'm leaning towards the "more time for trades" approach after 10/20. I'm very interested to see how this earnings season goes.
Thanks for reading this far and good luck! Have a great weekend. 🍀
Discussion