Vanna's impending return

With vanna and charm on their way back, how are AMD and TSLA set up for next week?

Options vanna gives me more confidence in trading and the vanna lull after the June OPEX date is coming to an end. At a high level, vanna measures how much deltas move when implied volatility (IV) moves. Increasing IV means that deltas begin increasing even if price stands still
The effects of vanna ebb and flow, but this chart has proven to be quite accurate for me for a while:

I'll take a look today at two of my favorites, AMD and TSLA, and see how vanna positioning might affect them. But first:
All investments come with significant risks, including the loss of all capital. Please do your own research before investing, and never risk more than you are willing to lose. I hold no certifications or registrations with any financial entity.
Let's go! 🚀
AMD
First, let's examine the aggregate vanna curve:

We have positive vanna overall (both extremes are above zero), but I'm concerned about the positive vanna below the current price. Sure, all that positive vanna above price looks great for bullish trades, but I like to see more negative vanna underneath price.
Why? Because as price crosses vanna levels, they flip. If price comes down, those positive gamma lines flip negative above the price. That indicates selling pressure being applied by dealers. I have a bullish bias on my trades and I want to see more buying pressure applied.
How do the strikes look in detail?

That $70 bearish bet still remains on that long term LEAPS contract. Outside of that, the tallest bars shows up at $120, $130, and $145. These are all in the $100M range. The positive vanna below price seems relatively small and spread over ranges rather than individual strikes. That makes me feel little more comfortable with our correction nearing an end or consolidating.
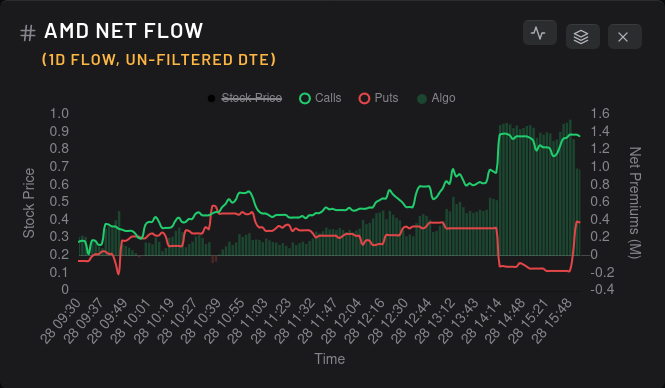
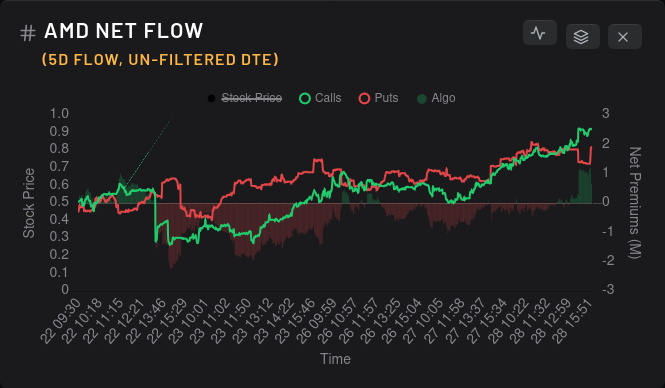
AMD's options flow was noticeably bullish especially during the last two hours of trading. On a 5 day scale, it doesn't look too exciting, but I'll take what I can get. 😉 AMD is up almost 2% pre-market today, so someone had a good plan.
TSLA
I love the look of this TSLA vanna curve and I'll tell you why:

First off, we have incredibly positive vanna at the extremes (nearly $3B versus $0.5B) and the vanna below price (with the exception of the $260 strike) is mostly negative. However, remember that vanna has effects over a distance, but almost no effect when the price is sitting on a big vanna strike. We're at $261 pre-market today and the big vanna bar at $260 isn't going to impact price much at all.
Speaking of strikes, let's take a look in detail:

The $260 and $300 strikes are the biggest positive ones with about $1B in value. $250 still looms as a large negative vanna strike, so that's one to watch as well. If IV stays steady or decreases, TSLA might be on the move upwards again.
Can options flow give us more hints?
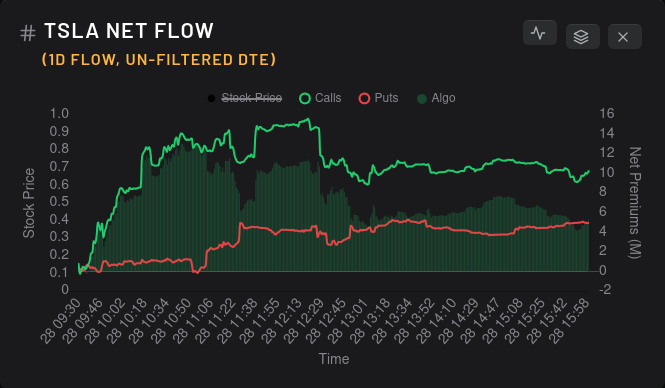
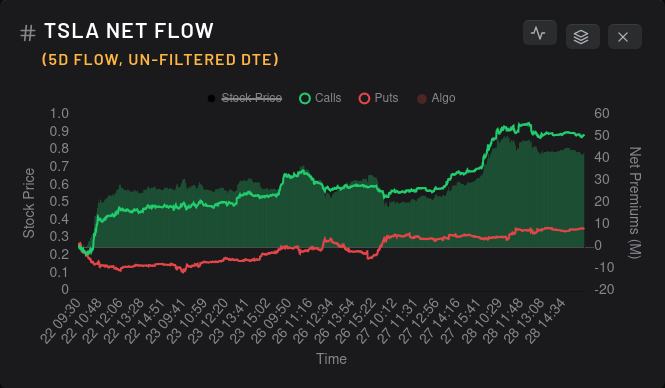
Both the 1 and 5 day timeframes show bullish flow across the board with puts ramping slowly over the past two days. On the 5D chart, the gap between call and put net premiums is over $40M. I get excited about $20M gaps, so $40M is not bad at all.
Dealer positioning
One word of caution – both AMD and TSLA have dealer greek buildups that are a bit concerning. Dealers are sitting on a lot of bullish contracts for both (a bit more long on AMD), which means that participants in the market are still holding more bearish contracts.
Could this just be a lagging indicator as market participants haven't changed their thesis on their trades? Possibly. It's something worth monitoring.
TSLA's dealer OI looks bullish through 7/14. TSLA reports earnings on July 19th. This may be a play on the run-up before earnings:

On the other hand, AMD still looks bearish until we reach 8/18. AMD reports earnings on August 1st. The same earnings run-up play doesn't appear here:

Thesis
Although I'm looking to carefully play TSLA's earnings run-up, I'm still looking at AMD with a wait-and-see approach.
AMD's options are priced for a downward moves, dealers are long, and bearish flow has dominated since 6/20. It does appear that AMD's correction might be slowing as it approaches the 50MA:

I want to see more evidence of a change in AMD before I make more trades there. I sold a couple of covered calls yesterday but then AMD decided to climb after hours. If you're holding AMD shares, you can thank me later for selling those calls. 😜
Good luck out there! 🍀
All investments come with significant risks, including the loss of all capital. Please do your own research before investing, and never risk more than you are willing to lose. I hold no certifications or registrations with any financial entity.
Discussion