Weekend charting for July 21 OPEX

It's been a while since I sat down to focus on charts, so come with me on a technical analysis journey with AMD and TSLA. 📈

Sometimes I get so deep in the world of options data and dealer positioning that I forget about sitting down with the single thing that will not lie to you in the stock market: charts.
Price and volume always tell the truth, but they don't always make it easy to hear the message. In this post, I'll dive into AMD and TSLA charts to see what happened last week and what could happen this week.
All investments come with significant risks, including the loss of all capital. Please do your own research before investing, and never risk more than you are willing to lose. I hold no certifications or registrations with any financial entity.
Let's roll!
AMD
Fair warning here – I enjoy using Heikin Ashi candlesticks on my charts. I really enjoy using them because they smooth out the lines on the chart and clue me into trends a bit better than traditional candlesticks. It might make my support and resistanc levels a little bit different than yours, but it's the trends that I really want to find. 😉
Here's an AMD daily chart since the May 5 rally:
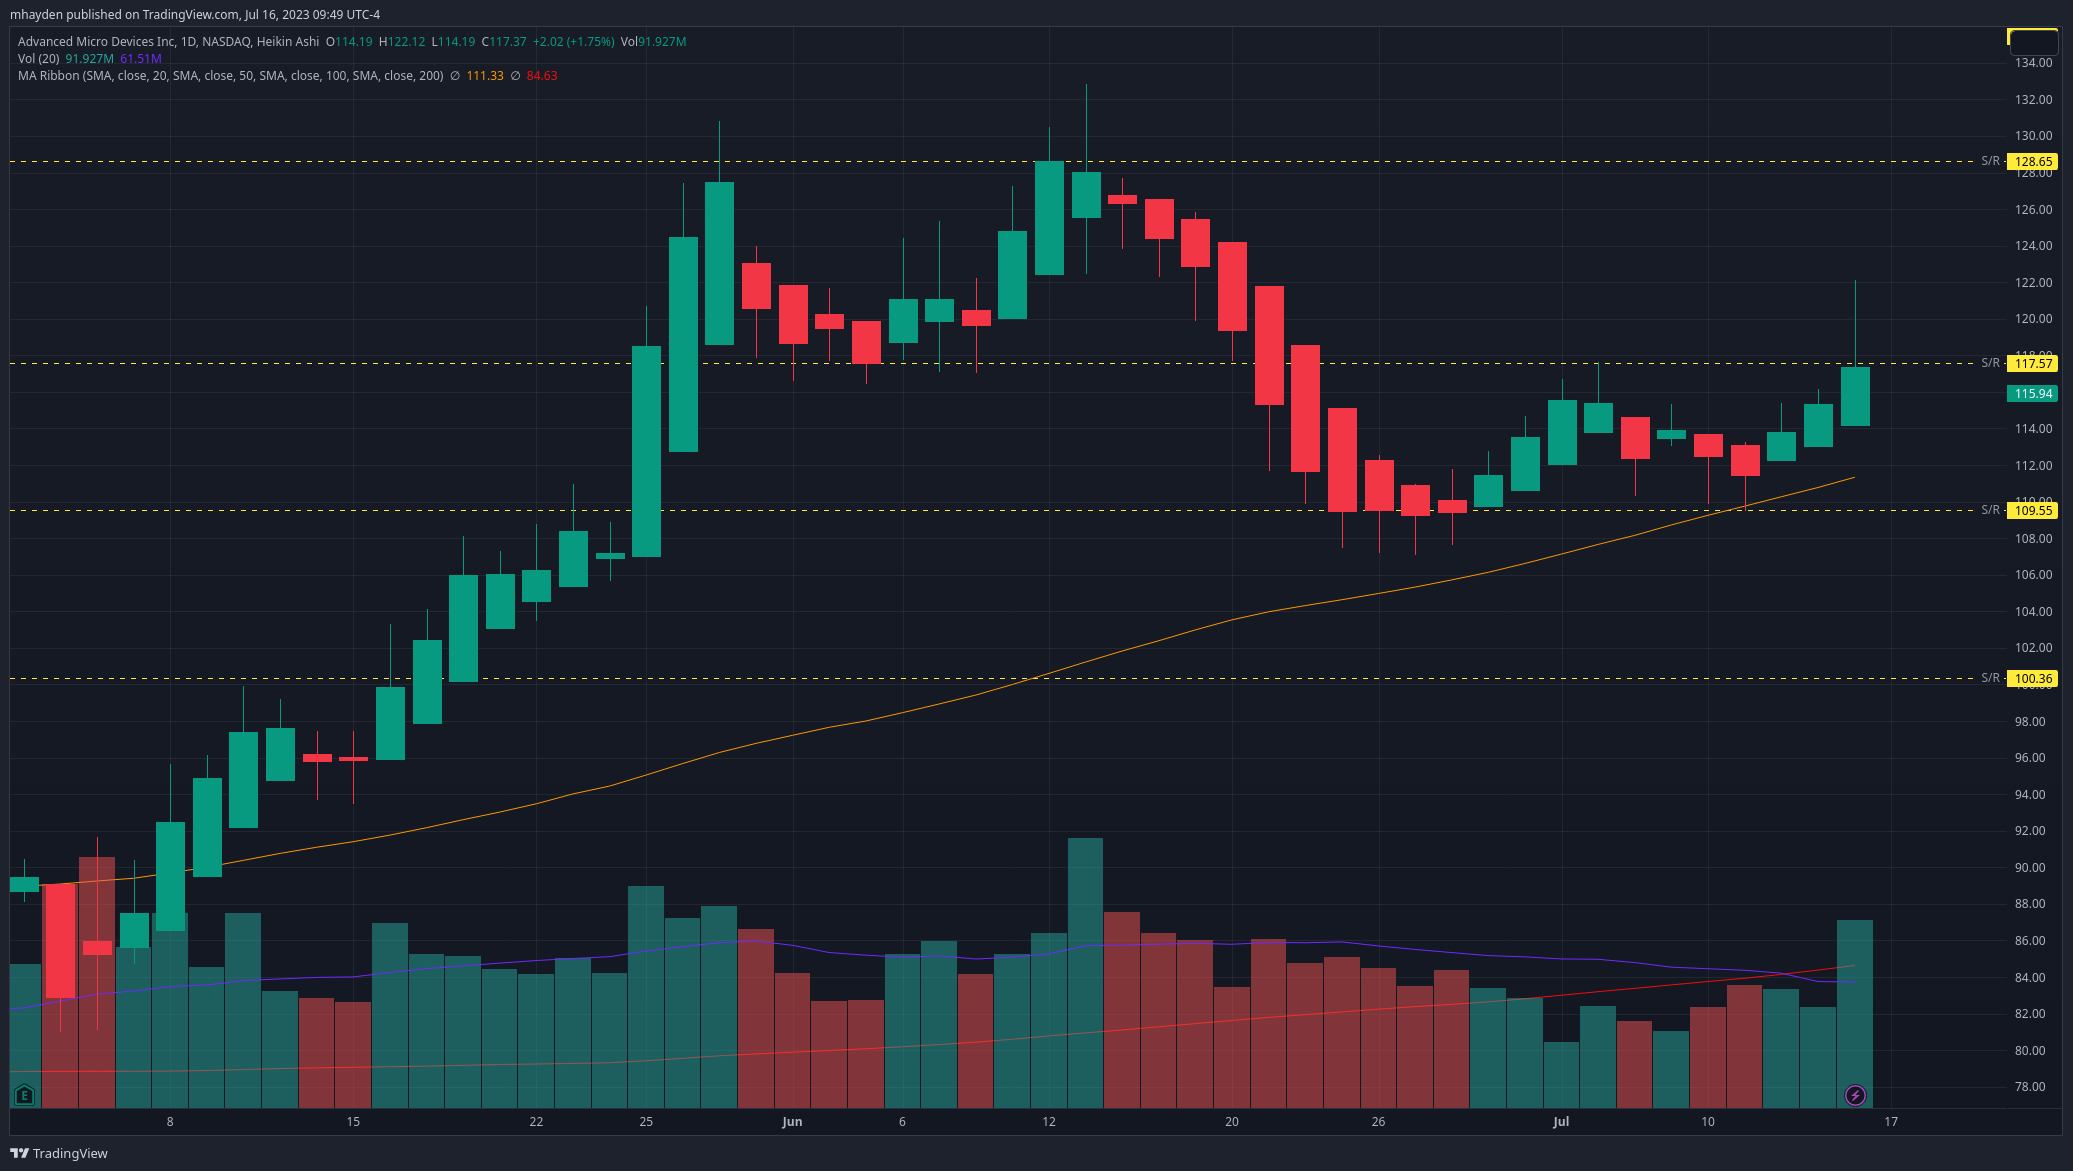
Friday's AMD rally really caught me on my heels. Based on options positioning, I had real doubts about AMD passing $115, but it found its way up past $122 until it settled back down under $117. As it turns out, this level around $117 was a support level in early June and it broke down around June 20th as the price slid to $109.
The price action on Friday tested that $117 line and initially looked great, but then the bullish run failed and the $117 resistance line remained strong. Friday had plenty of volume, so we might see another run past $117 if more bullish traders get on board.
My next question was: If we somehow make it over $117 and the rally holds, where could we go? We need to zoom out a little to December 2021 to answer that question:
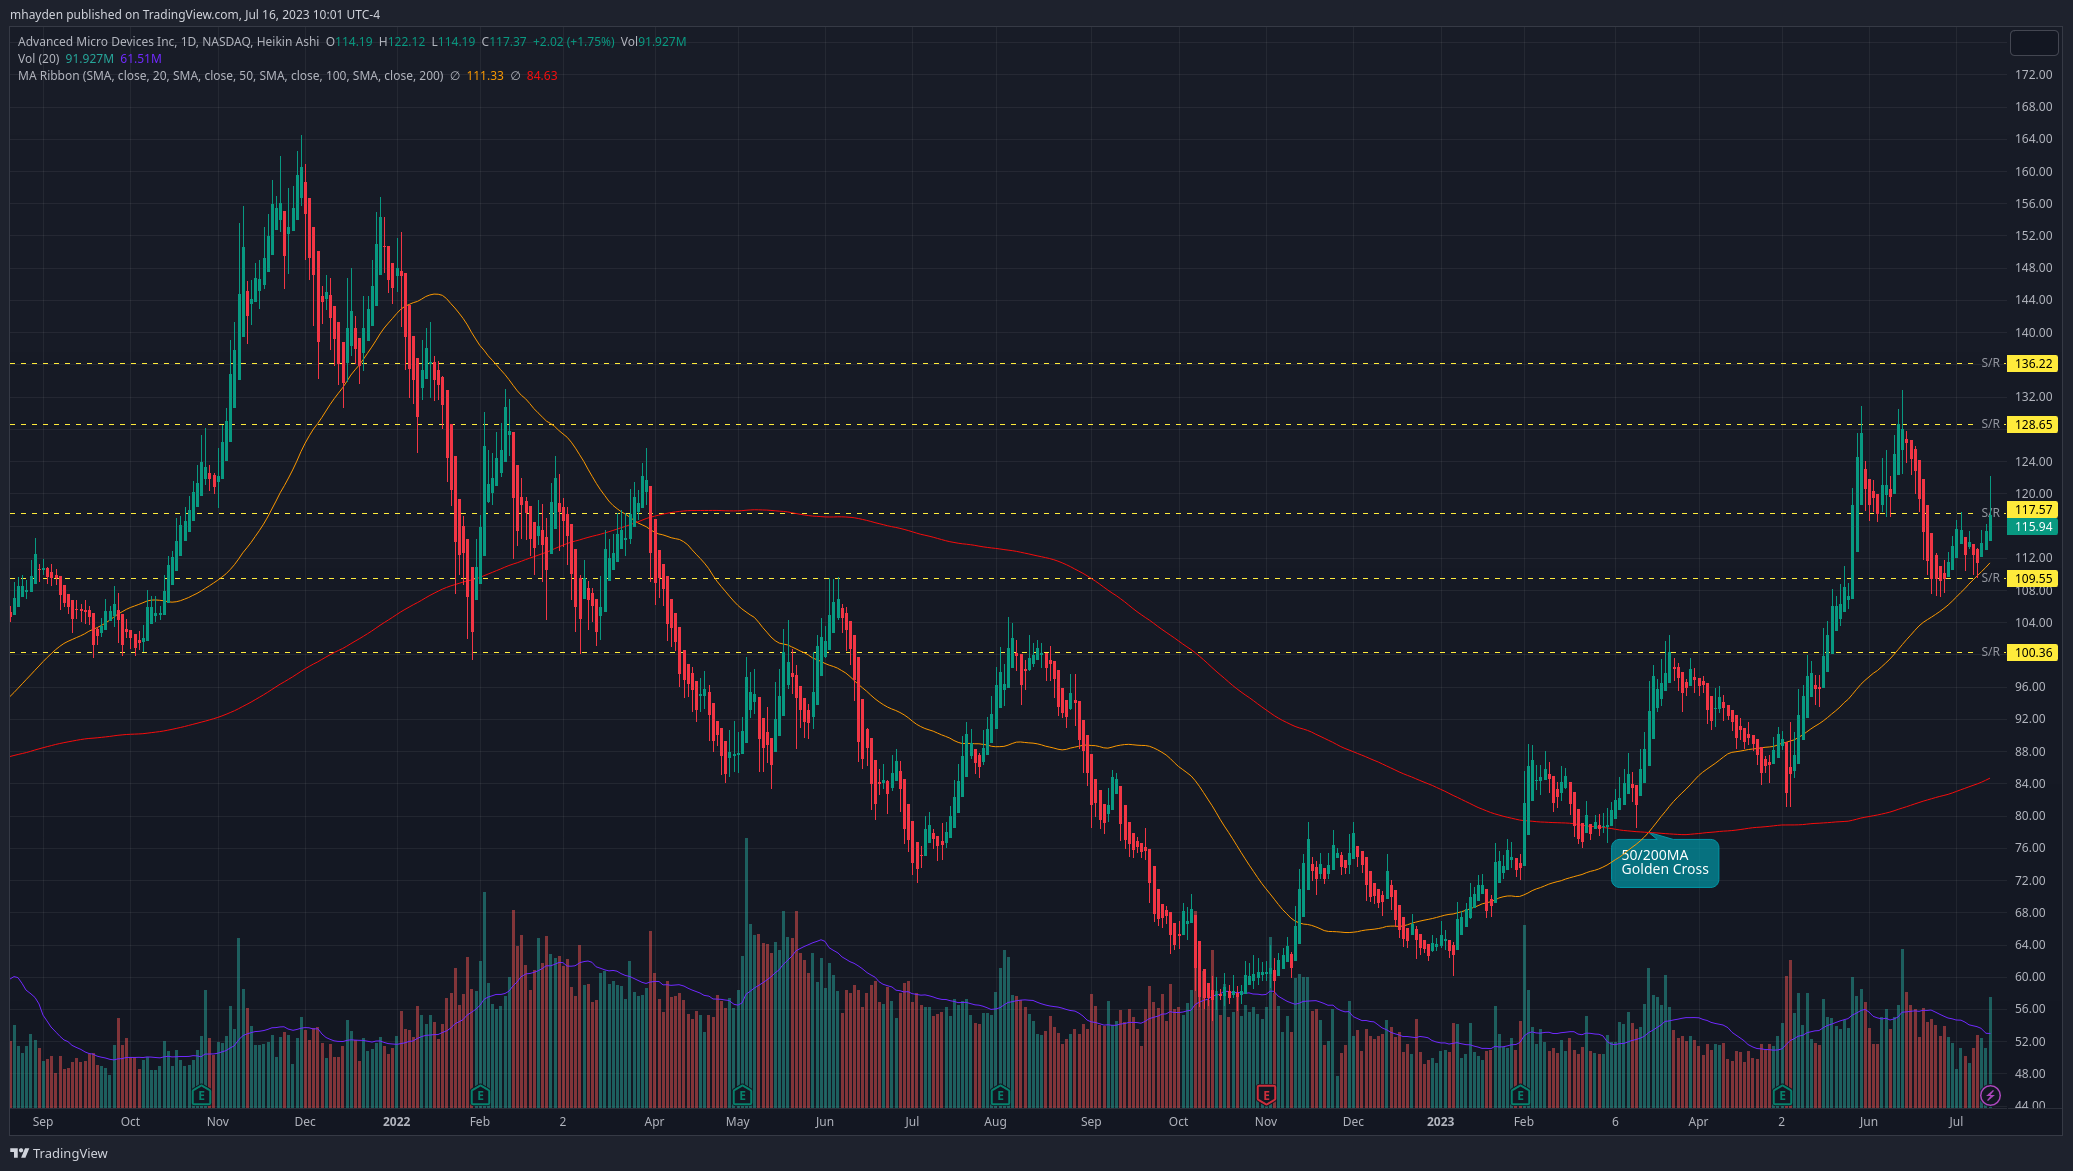
We ran into liquidity issues around $128-$130 after the May rally and that level was tested twice. The second time had plenty of volume. If we somehow shoot past there, our next stop is just over $136. That would be a nice run!
AMD also seems to be riding the 50MA line fairly consistently after breaking over it just as the May 5th rally got underway. Our 200MA line is also trending up, but it's way down in the mid $80's.
Bearish traders might look at the expanding distance between the 50/200MA lines and say that we're running far too hot and we're overdue for a correction. AMD did that in December 2021 in the $150's before a fall down to the upper $50's by the fall of 2022.
Either way, my eye is on that $117 line this week. If we can manage to close above it for a day, that presents a very bullish sign for AMD in the short term.
TSLA
The first thing I notice about TSLA is that it could be in a rally like AMD's, but in an earlier stage:
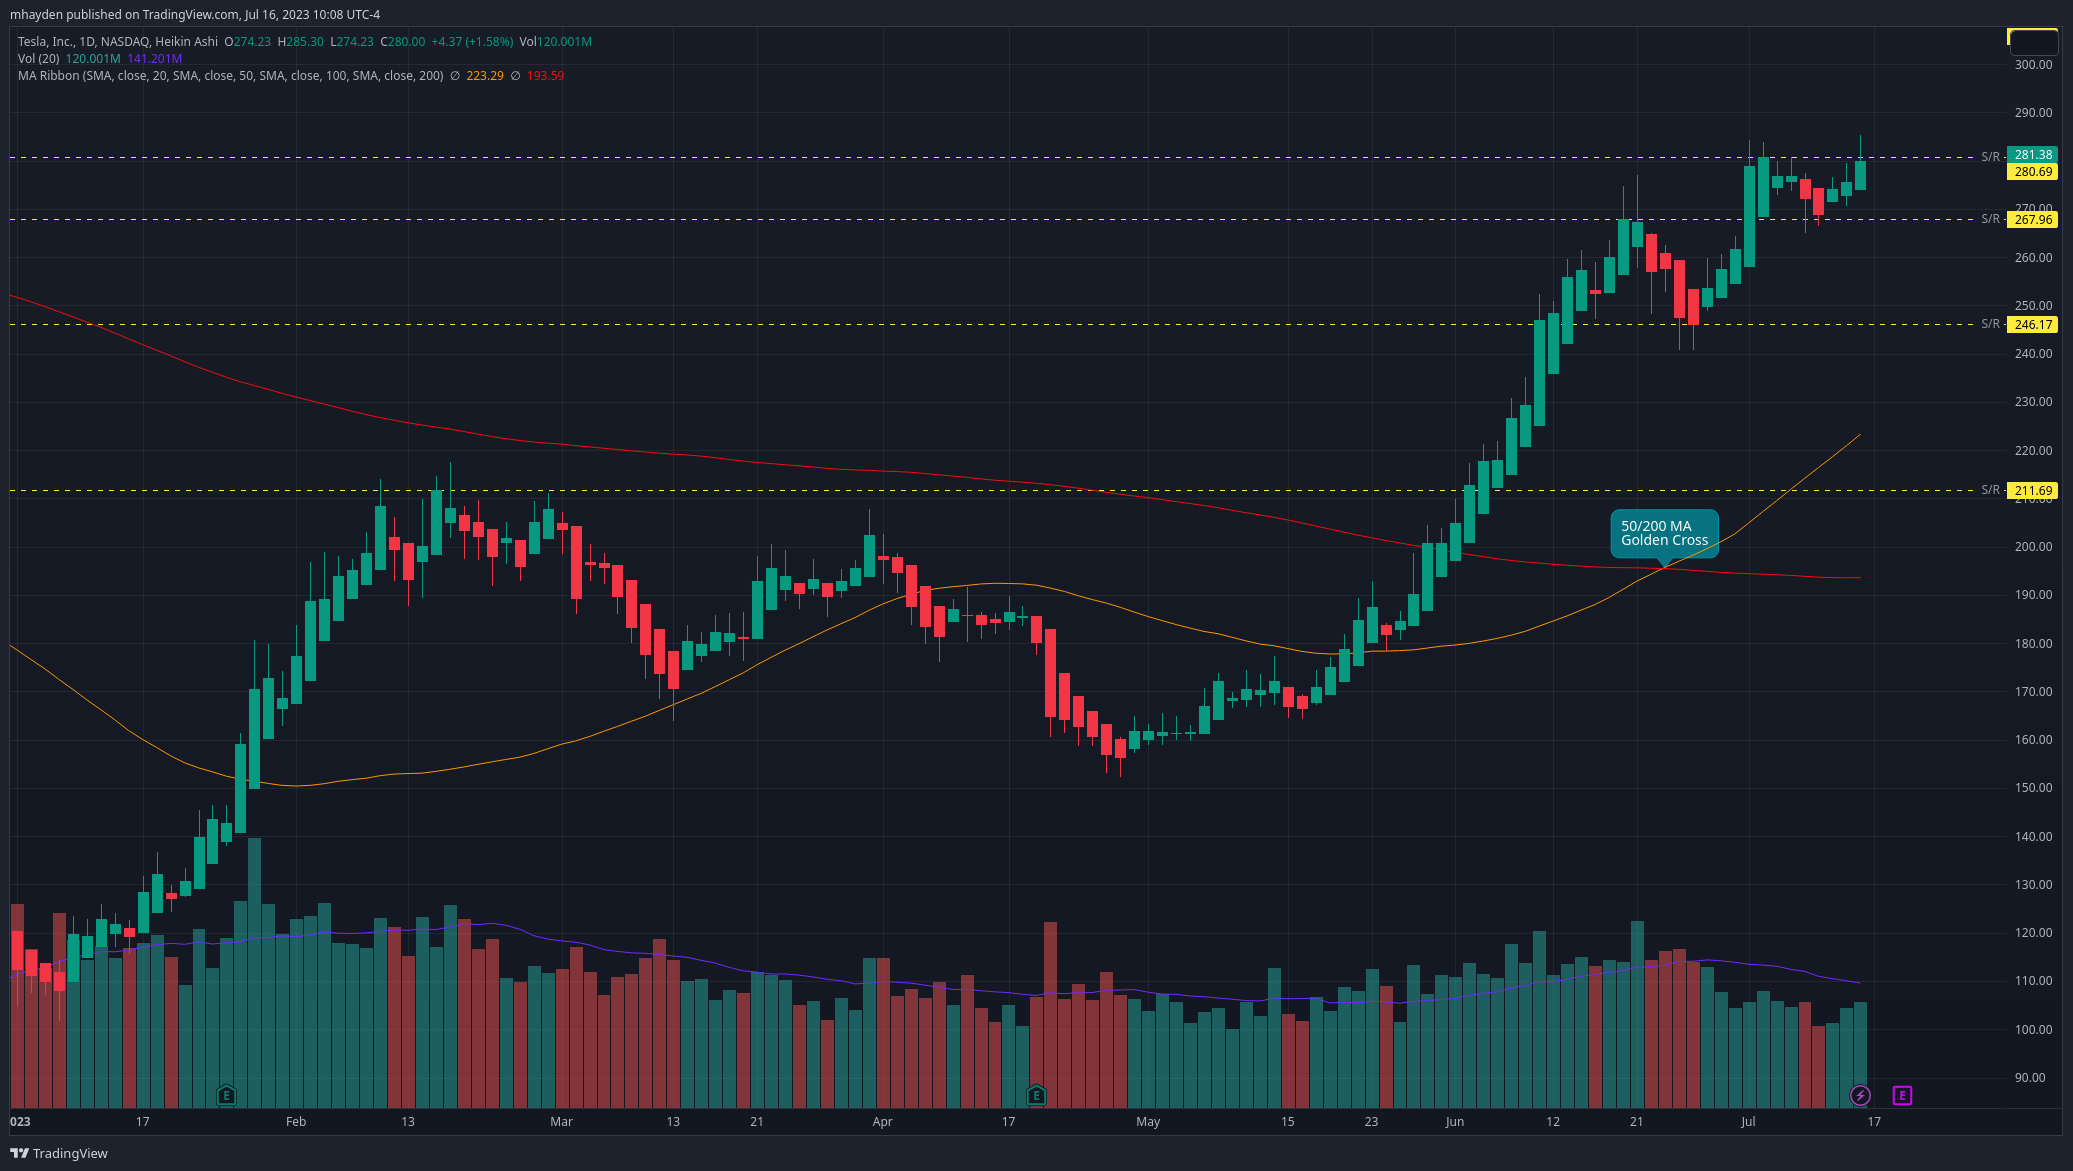
We had a golden cross of the 50/200MA lines in late June and we're hitting a resistance level around $281. TSLA also had a similar situation to AMD where the price rallied over the resistance on Friday only to fall back down underneath.
One thing that worries me here is the volume. Take a look at the volume over the last 10 trading days. It increased at the end of this week, but it's trending down from June's highs.
Could that be happening since TSLA's earnings are coming up and traders have already placed their bets? Possibly.
Is volume low because we've climbed too high and liquidity is low up here? That's possible, too.
If we're super bullish on TSLA, where could price end up if we have a rally (or if earnings on 7/19 look fantastic)? For that, we need to zoom out to September 2022:
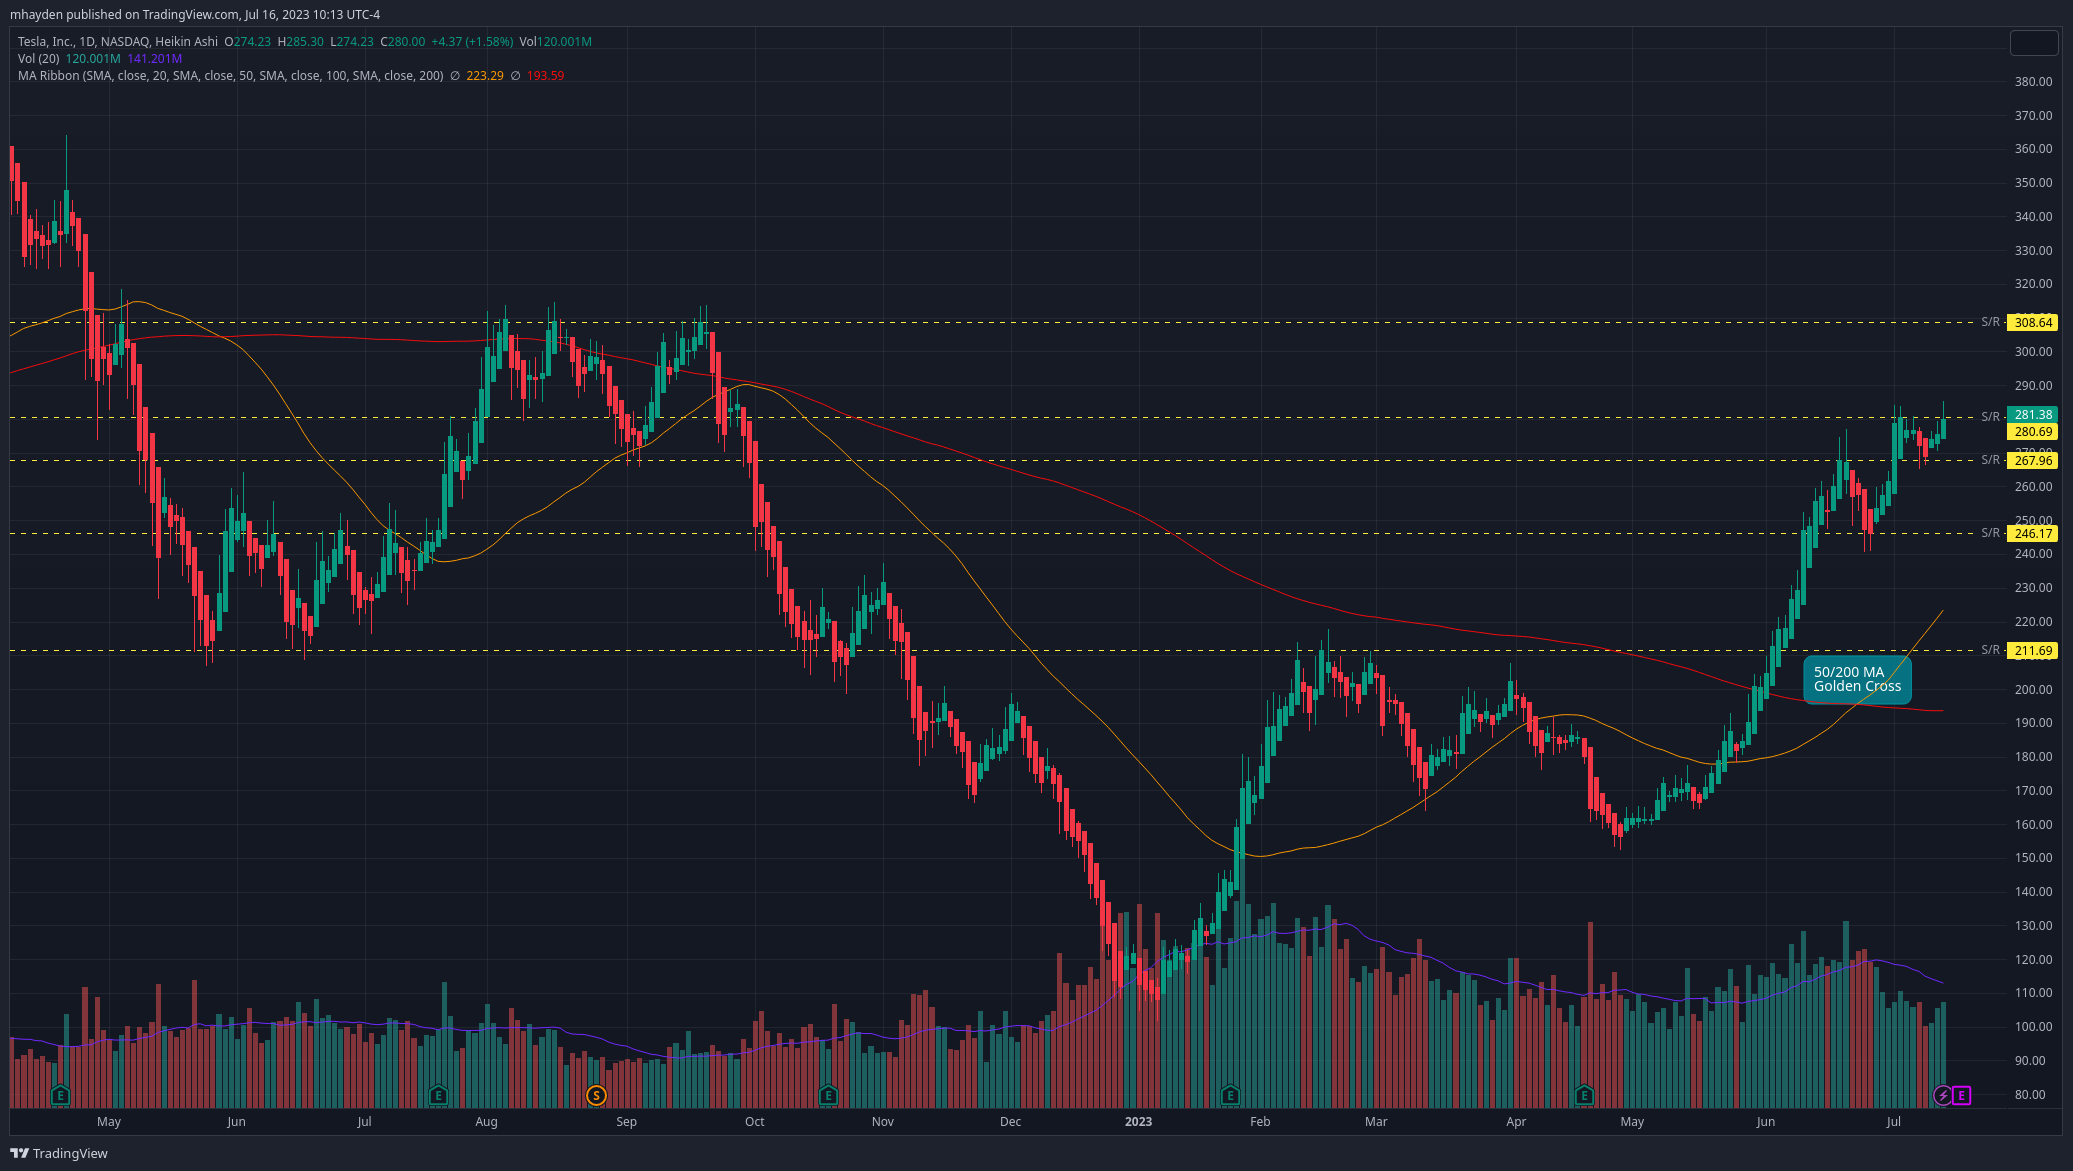
The level around $308 has been tested as resistance four separate times since May 2022. If TSLA creeps over the $280 level, there's definitely another opportunity to test $308 again. Options positioning into earnings definitely looks bullish (more on that tomorrow), but we need more volume to confirm the trend.
Bearish traders will likely balk at the low volume and quick separation of the 50/200MA lines. They also might note that the 200MA line for TSLA is not tilting upwards yet. TSLA's price has run off from the 50MA line by a wide margin and TSLA has had corrections in the past when this happened.
However, we're in a very interesting market right now where inflation seems to be calming down but many consumers haven't felt the change yet. The Fed is due to report on interest rate changes soon and some analysts feel like they will do another hike to ensure that inflationary pressure will come down. 🤷♂️
This week is the beginning of earnings season and anything can happen. Pair that up with an unpredictable interest rate decision and you have the ingredients for a volatile week. 💣
Discussion