Weekend charting for July 23

As we roll towards the 7/28 expiration, I'll take a look at AMD and TSLA charts to plan the week ahead. 📈

What a difference a week makes! In this post, I'll go through charts for AMD and TSLA to see where we might see price move this week.
As Fred McAllen says, the only two things in the market that won't lie to you are price and volume. These are both found on stock charts and you can get them for free! 😉
But first:
All investments come with significant risks, including the loss of all capital. Please do your own research before investing, and never risk more than you are willing to lose. I hold no certifications or registrations with any financial entity.
Let's get started.
AMD
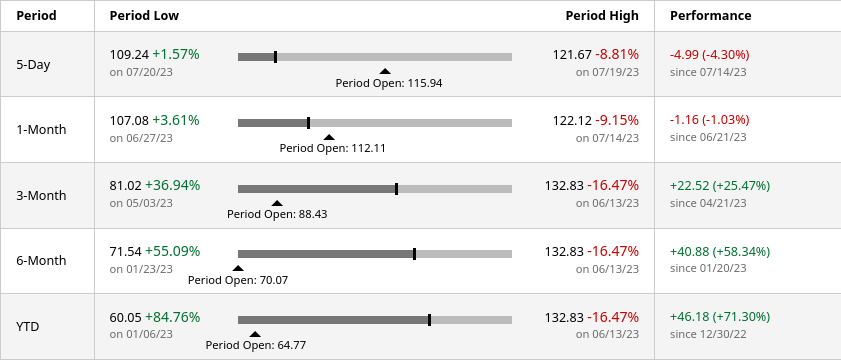
AMD finished down about 4.3% for the week and it's down over 1% over the last month. While that might feel a bit gloomy, bear in mind that AMD is up over 70% in 2023! 🤯
Let's start with my annotated daily chart:

First off, you'll notice a few things on my charts:
- I'm using Heikin Ashi (HA) candles here and they track price differently than traditional candlesticks.
- The S/R lines are my support and resistance lines that I drew based on the price action I saw.
- GEX push/pull lines are areas with high levels of gamma exposure (more on that in a minute)
- My only two trend lines are the 50 and 200 day moving averages
What's important to notice with AMD?
A few things caught my eye:
- We broke the 50 day moving average (~ $114) twice two days in a row but we're still well above the 200 day moving average (~ $85).
- We have a two day drop with increasing volume and HA candles showing a strong downward trend.
- Price is approaching the $109 support/resistance area that has been tested a few times already and was tested in June 2022 as well.
How I'm thinking about AMD this week
As we race towards that $109 support area, my biggest question is whether we will get a bounce off that line or not. We were last there on June 28th. Something changed in the market that made traders concerned and it could have been related to earnings from TSM or ASML.
If AMD closes below the $109 level this week, I'd be looking at a potential move lower to something around $100. That's a big psychological support level and it's been tested as support and resistance many times.
A move up could find trouble around $117 and $126 as AMD has struggled to find liquidity above those levels.
As for me I'm betting on a bounce this week. We might have a close at or below $109, but it feels like this small correction was a kneejerk reaction to other earnings calls.
What about those GEX lines?
Gamma exposure examines how dealers in the market will likely react at certain price points. Remember that dealers profit from the bid/ask spread on options and stocks. They don't want to have a bullish or bearish position in the market. To maintain their hedging, they may have to buy or sell stock at certain price points.
The biggest negative GEX line for AMD this week is $121 with the biggest positive GEX line at $119. Positive GEX lines tend to slow price movement and negative lines can act as magnets. This leads me to think that market participants are betting on a bounce on that $109-$110 area.
Would we see $121 potentially? I doubt that's possible with the liquidity challenges at $118-$120 that we've seen multiple times already.
TSLA
TSLA finished the week down a decent amount, but again, it's good to keep things in perspective:
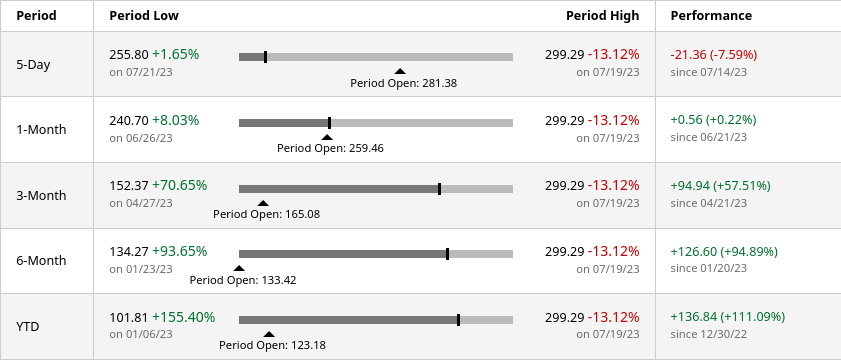
This stock is still up over 110% in 2023. 🚀
Sure, earnings were a mixed bag, and TSLA's competition seems to be weakening and strengthening in different areas. You could likely put the ten best stock analysts in a room to debate TSLA's valuation and they would probably end up in a fist fight. 😜
But we're here to talk charts!
What's worth noticing on TSLA's chart?
Plenty:
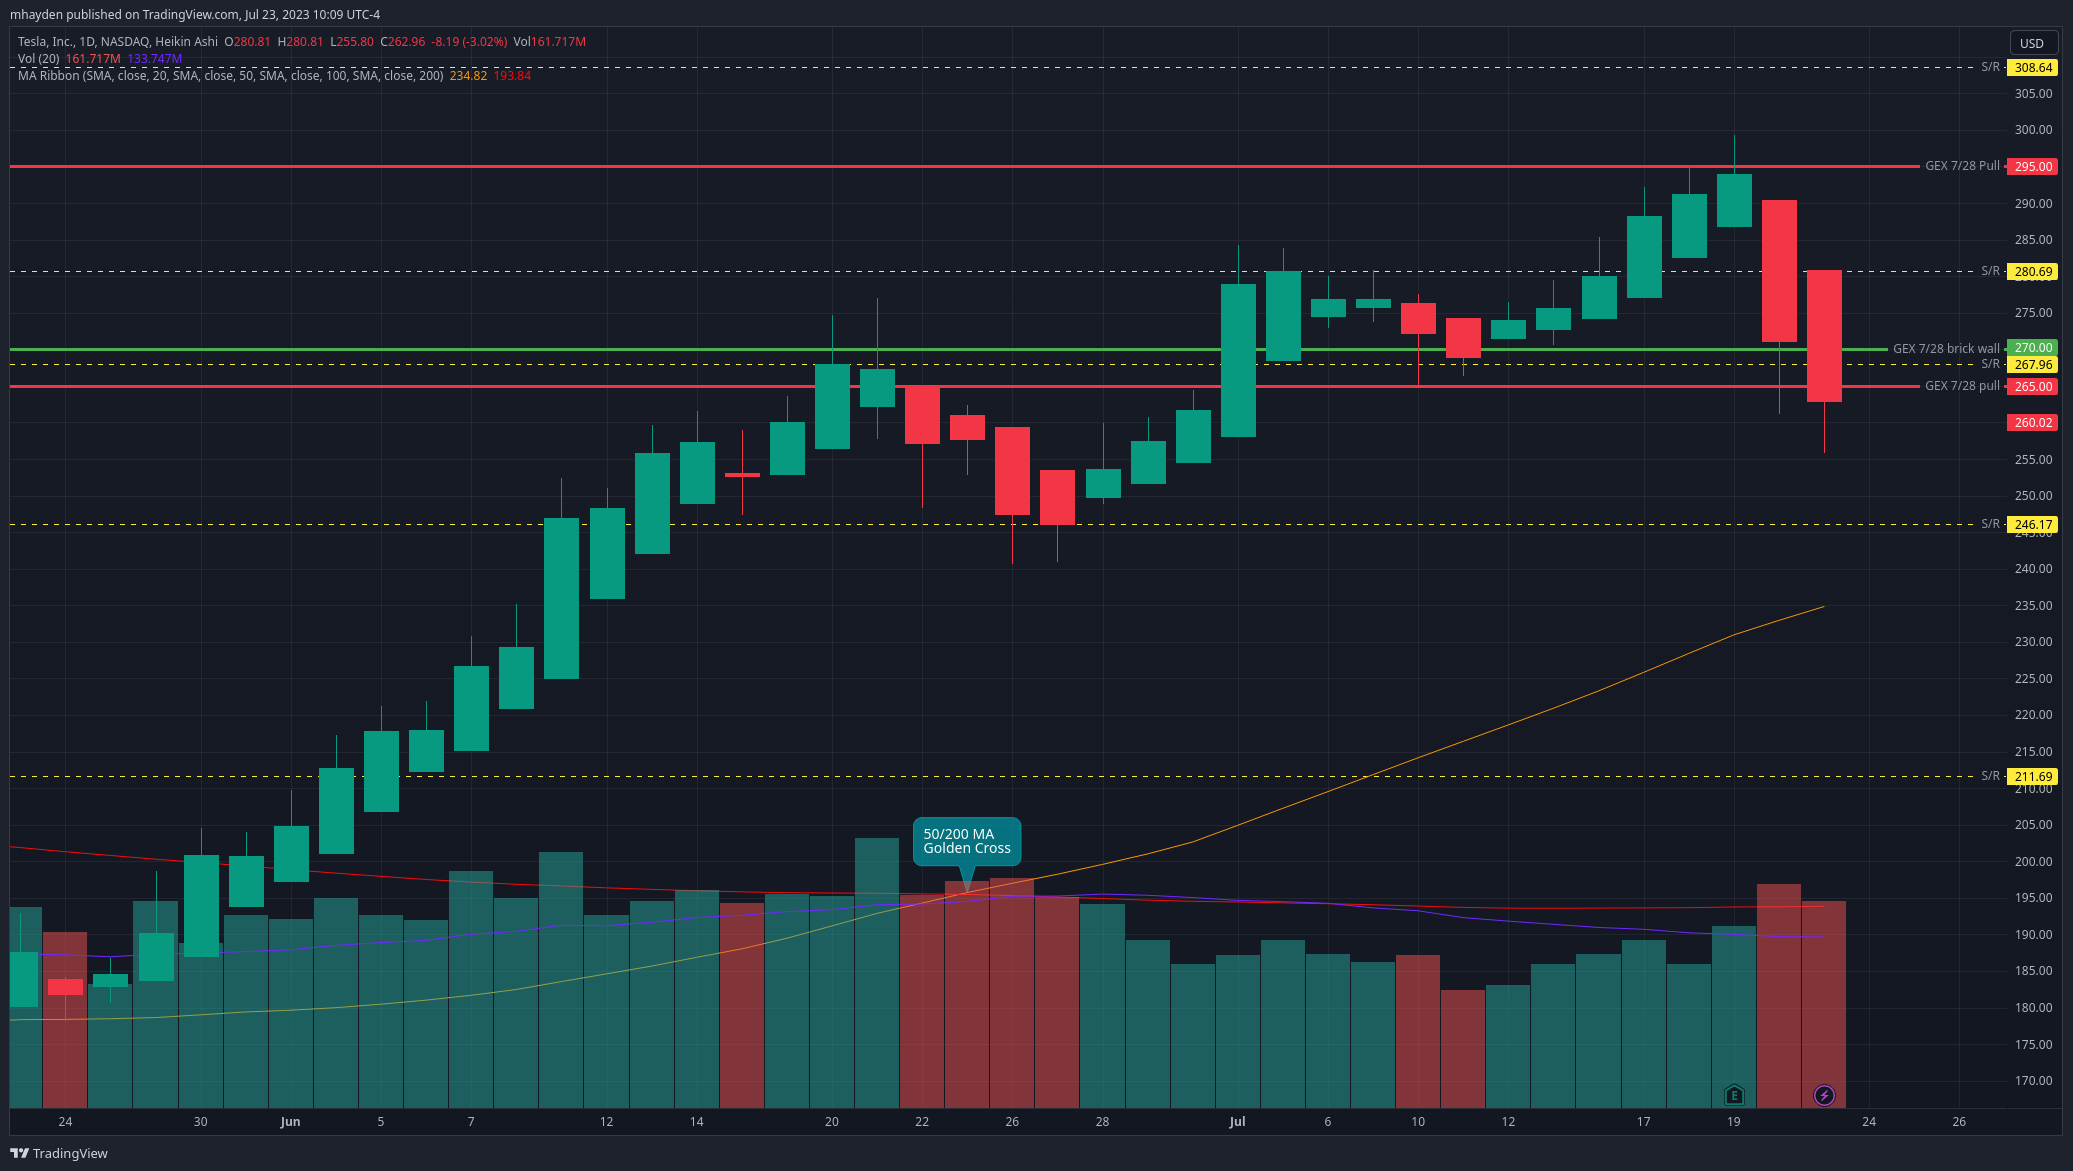
- TSLA made a hard turn down after earnings that was confirmed by above average volume and Heikin Ashi candles with no wicks on top.
- We're still well above the 50 and 200 day moving averages.
- TSLA broke two of my support lines over a two day span.
- The next support level down around $246 has been tested many times from both directions.
How I'm thinking about TSLA this week
This stock has some wild price movements and it's entirely possible we visit that support area around $246 this week. I still think that's unlikely because we ran past it with decent volume and strong HA candles back in June.
Sure, the thesis for some traders might have changed after earnings and we might have to discount the impact of that June rally.
Gamma exposure charts show some large negative gamma around $265 and $295. These could act as magnets for price, but we have a massive positive gamma level at $270 that would slow price movement over that level.
TSLA could be in for some consolidation around the $267 area and although that might not be exciting for options traders looking for wild swings, that would allow more support to build (as it has for AMD lately) for a stronger price movement later.
How am I trading these?
I'm still long plenty of AMD shares with some short puts for 8/4 in the $110-$117 range. $117 was a pretty aggressive play for a short put on AMD and I may end up paying the price for it. Covered calls for AMD above $120 still look like a relatively safe bet and I've sold a $129 and $130 call for 8/4. My AMD cost basis sits around $97 so assignment on these calls would be great.
TSLA surprised me last week and I took on a little more risk than I should have taken. I was assigned on my $280 short put and that wasn't fun. My cost basis is still in the low $260's. I sold a covered call at $270 for 7/28 since I have doubts we will exceed that level this week.
As always, you can follow along with all of my trades (winners and losers) in my Theta Gang profile. Good luck to everyone this week. ☘️
Discussion