Weekly prep for July 29th

Expect some volatility from lots of jobs data and an interest rate decision this week. As the market adjusts, what are the levels worth watching?

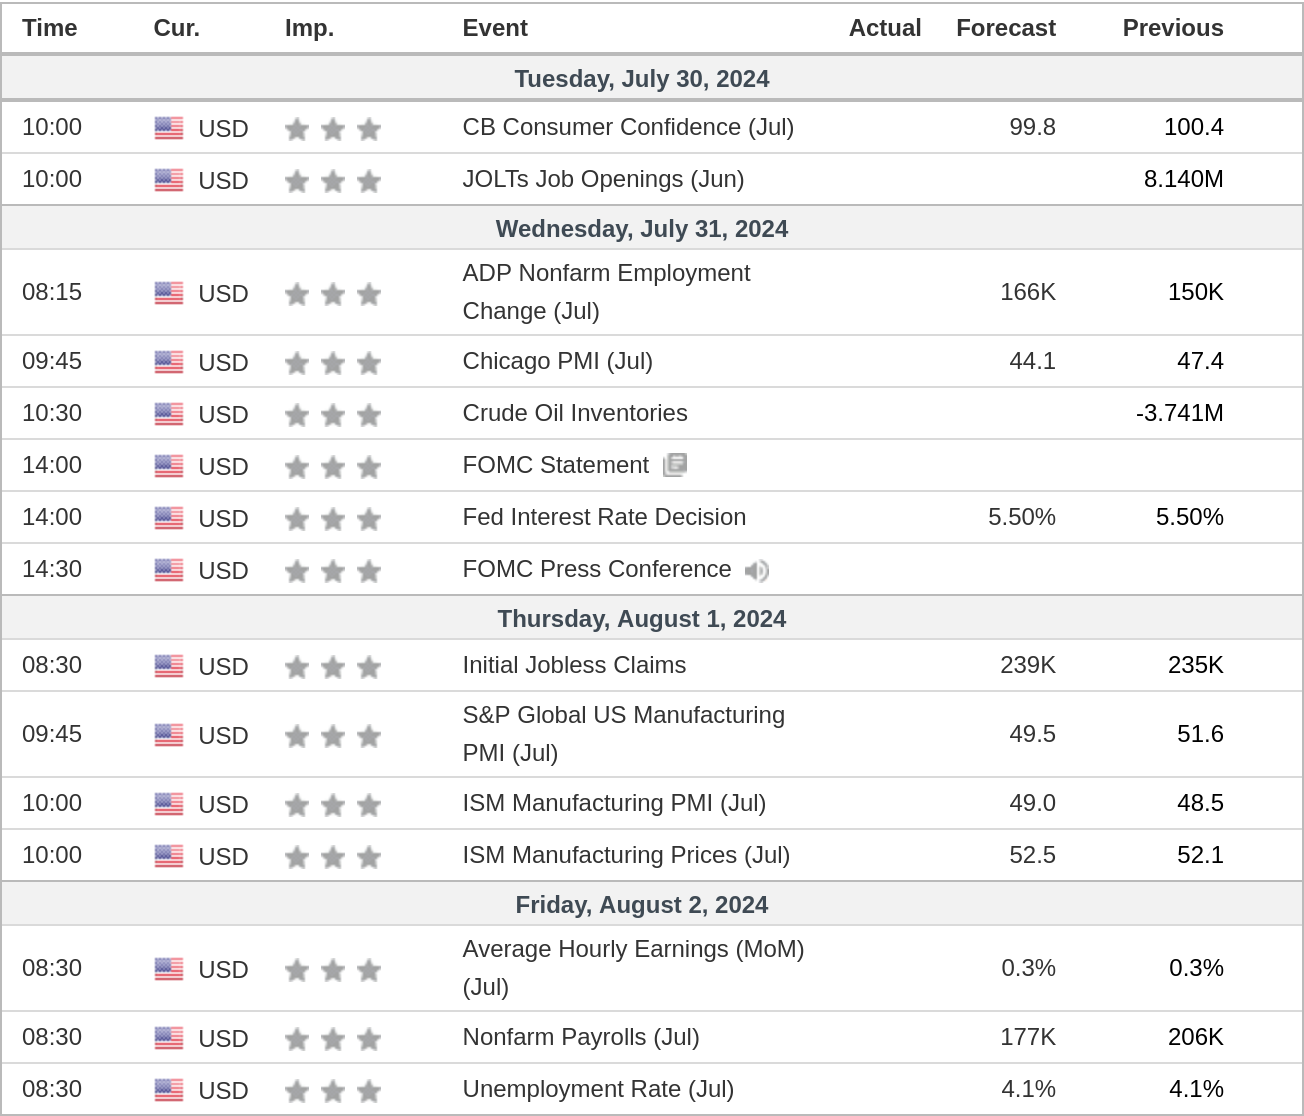
This week is shaping up to be a busy one! We have jobs data arriving all week long with the Federal Reserve's interest rate decision on Wednesday:
Markets are now betting on a rate cut of more than 25 basis points for September with almost 70 basis points of cuts by the end of the year:
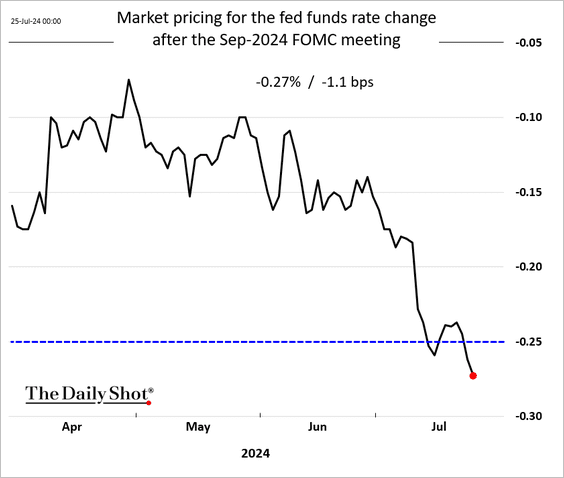
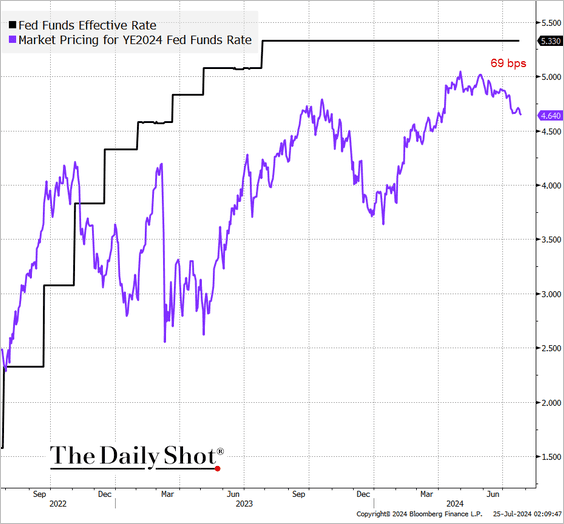
Interest rate expectations
I'll share my weekly market preparation with you in this post. If you have comments or if you disagree with something, please leave a comment or send me an email!
All investments come with significant risks, including the loss of all capital. Please do your own research before investing, and never risk more than you are willing to lose. I hold no certifications or registrations with any financial entity.
Let's get into it.
Chris Ciovacco's takeaways
One of my weekend rituals is to watch the video update from Ciovacco Capital. Chris is great at highlighting things I've forgotten or completely miss. It's a great way to shove the punditry from CNBC and Twitter aside and focus on the charts in front of you:
His big takeaways this week are:
- Keep your focus on the primary trend in your charts.
- IWM (small caps) is likely in the midst of a rotation right now and it has broken through several levels when you compare its strength against SPY.
- A cut from the Federal Reserve should help just about everyone in the market in the short to medium term. Recession risks are always there, but focus on the charts in front of you.
- IWM is now trying to build a new primary trend against XLE and XLK, but it has not proven itself yet. This remains an area to watch.
- RSP is trying to build a new primary trend relative to XLK. Again, it's not there yet, but it's worth watching.
What's in an index?
It's a good idea to remind yourself of the high-level makeup of the three big market indexes (I'm excluding the Dow for now):
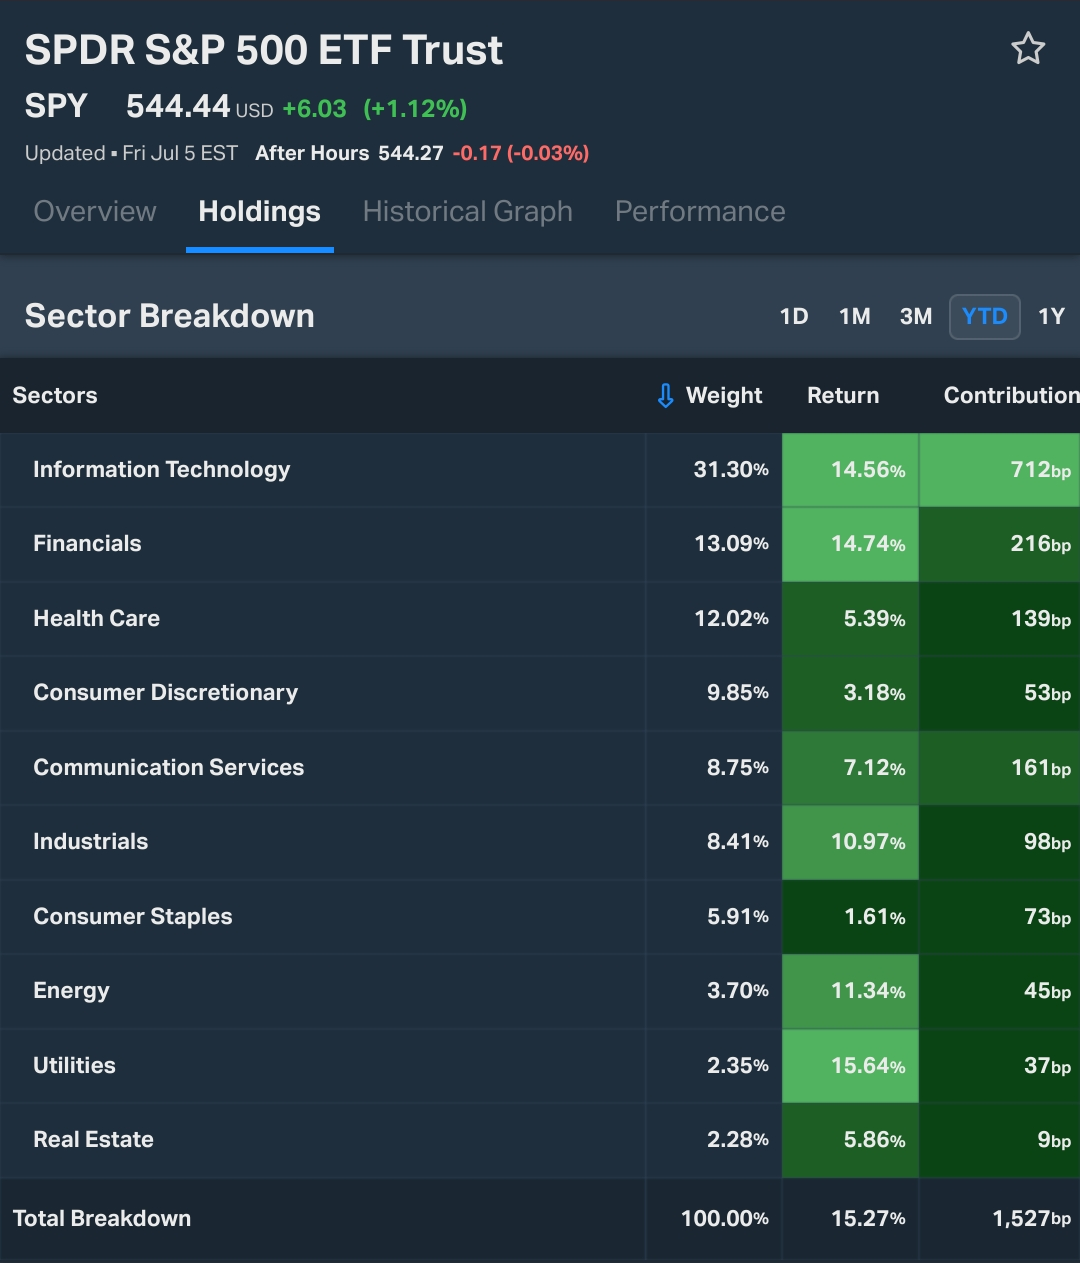
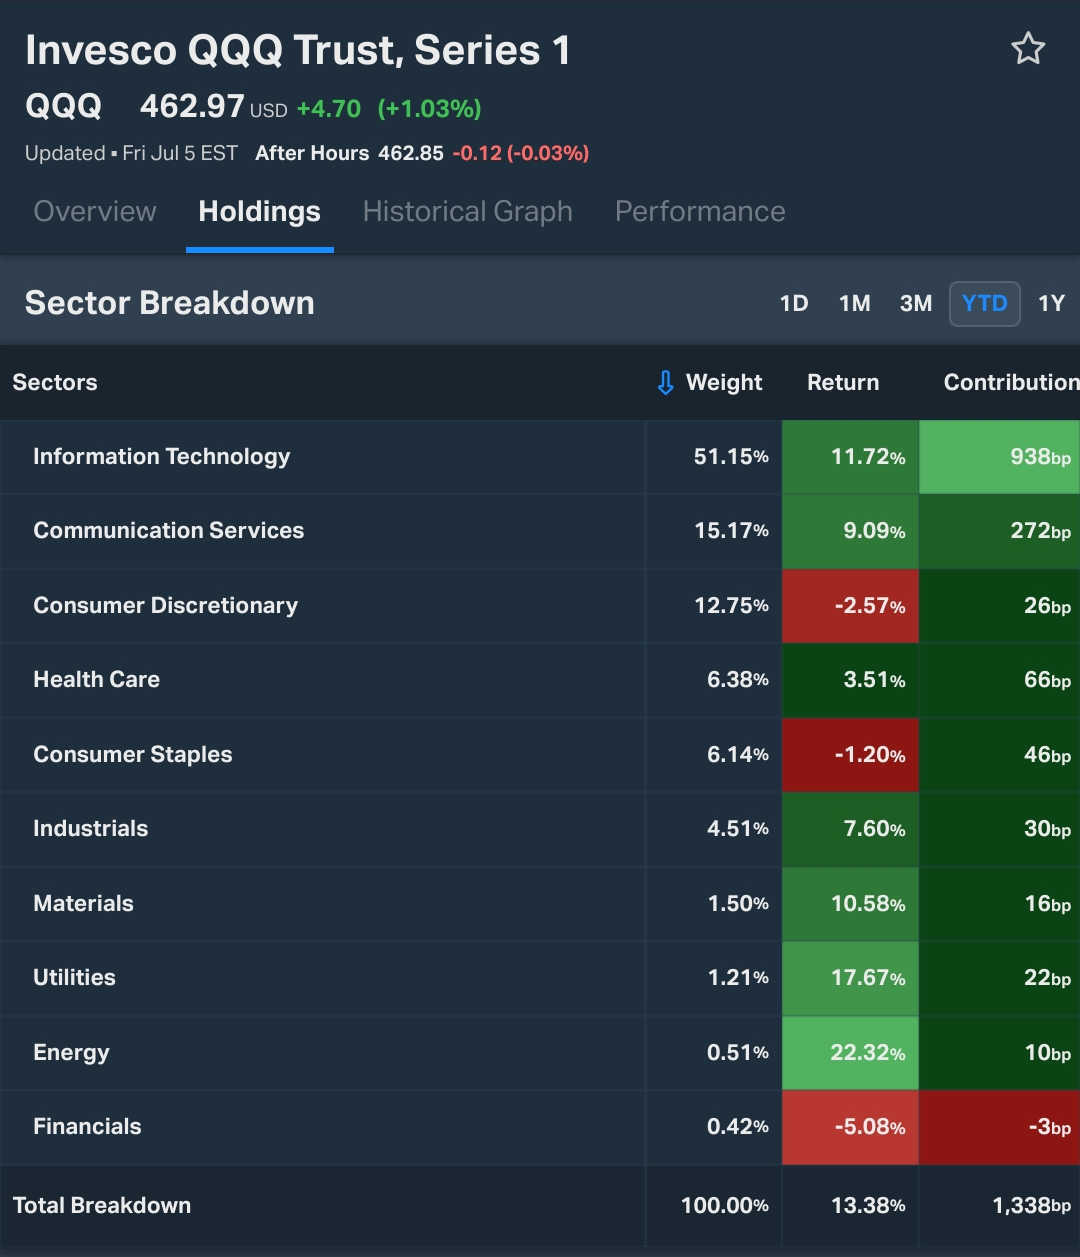
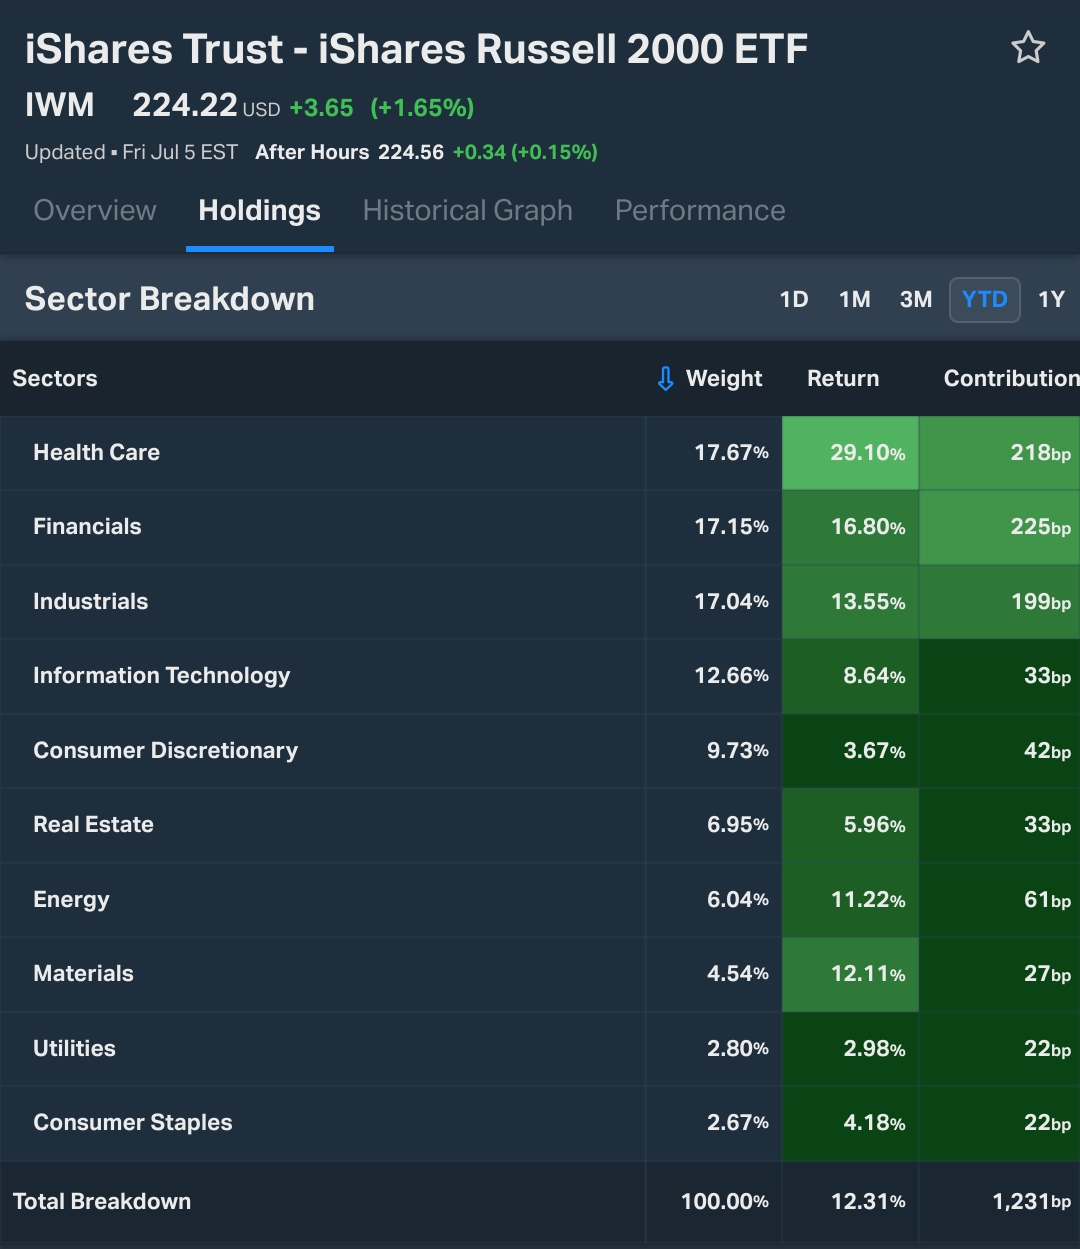
Index holdings from Koyfin
QQQ is over 51% tech at the top and SPY is over 31% tech. However, the top three sectors in IWM, the Russell 2000 ETF, make up 51% of the index and they include rate-sensitive sectors. In fact, the banking industry makes up almost 10% of IWM's holdings.
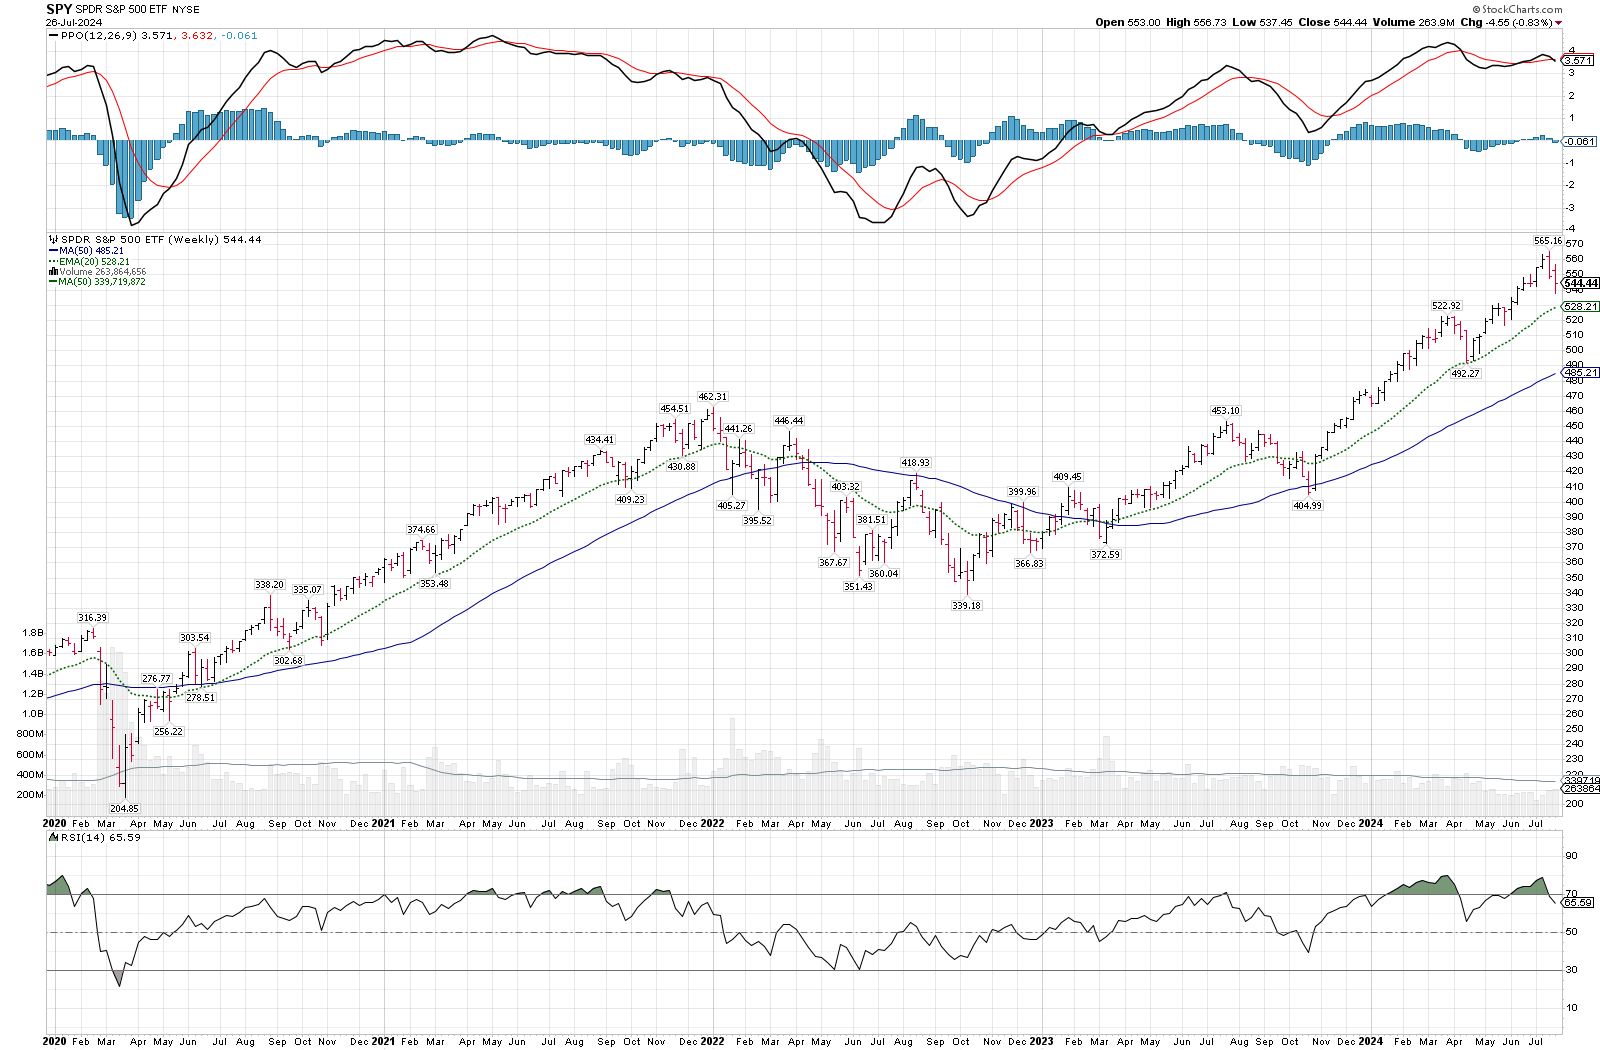
How do the indexes look?
Let's take a look at SPY first. It rallied from about $340 since the 2022 lows and gained an extra boost towards the end of 2023. However, the most recent high was made with a bit less momentum. The RSI shows a slightly higher high and the PPO made a lower high as well. Note that lower highs on the PPO indicator towards the second half of 2021 signaled that challenges were on the horizon:
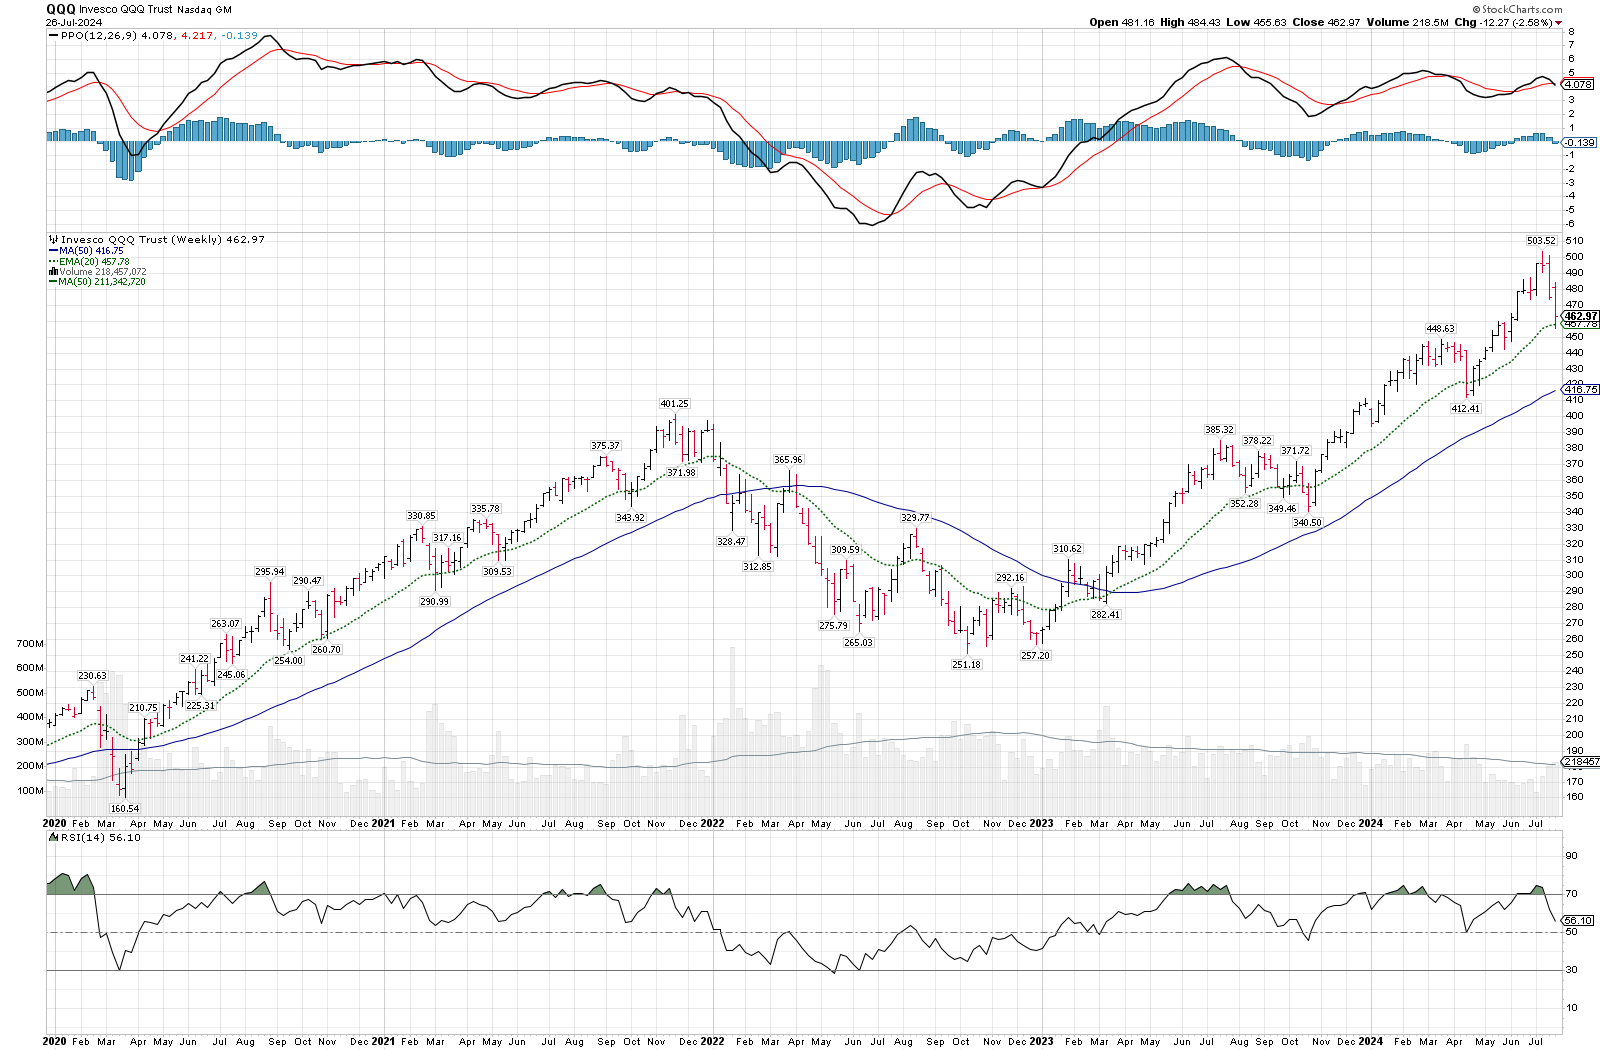
QQQ looks weaker with the PPO indicator already making two lower highs as the price churned higher. Note that the same pattern appeared in 2020 and 2021. However, the RSI hints at some good strength remaining as it has barely touched the bottom half of its range since early 2023:
IWM definitely has a different pattern as it roared out of the COVID lows, got stuck in a range in 2021, and then fell into a lower range after a blow-off top in 2021. Since mid-2022, the Russell 2000 has been trapped in a range, but the range has been slowly leaning upward. The fall of 2023 brought momentum upwards again and it has made higher highs and higher lows since then:
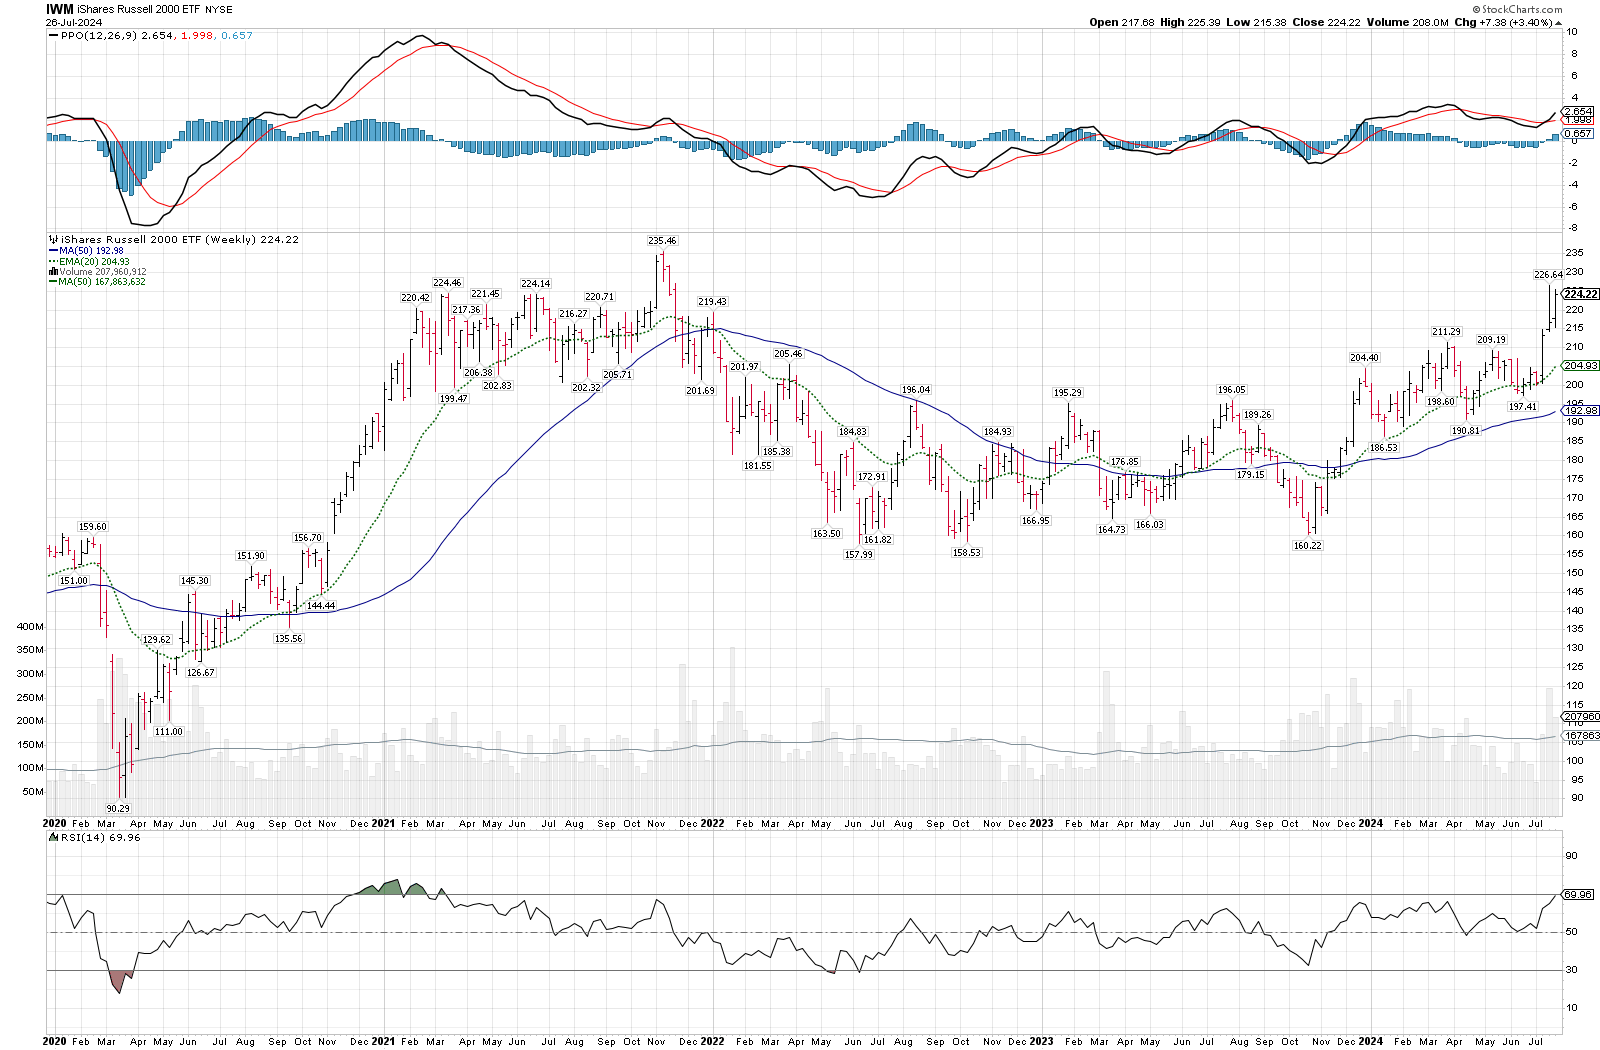
In summary, QQQ is looking the weakest of the bunch with SPY beginning to show some initial weakness as well. All of this is happening as IWM broke out of an upwards channel and sits just $9 short of a new all time high.
Before we leave the charts here, I'll leave you with two last ones. The first measures SPY's strength relative to IWM and the second measures QQQ's strength relative to IWM. The left edge of the chart begins as the dot-com bubble burst. Both of these ratios have returned to the same levels today as they were after the bubble burst.


Am I suggesting that we're facing another dot-com bubble? Absolutely not.
Macroeconomic conditions in 2000 were wildly different to the ones we are experiencing now. I encourage you to read Wikipedia's brief summary of the dot-com bubble to learn more. However, this is just one more piece of context as I sit here this weekend wondering where the market might go from here.
Institutional trades
I spent a good part of yesterday morning rolling through all of the top 25 ranked trades for last weeks from Volume Leaders. You can export them all into a spreadsheet and sort them into a list for further review.
You'll often see traders with deep pockets reaching for less-traveled corners of the market to place their bets, including lower volume index ETFs and leveraged ETFs. Some of these moves can give us clues on where we should be looking. Here are a few interesting ones I found.
S&P 500 trades
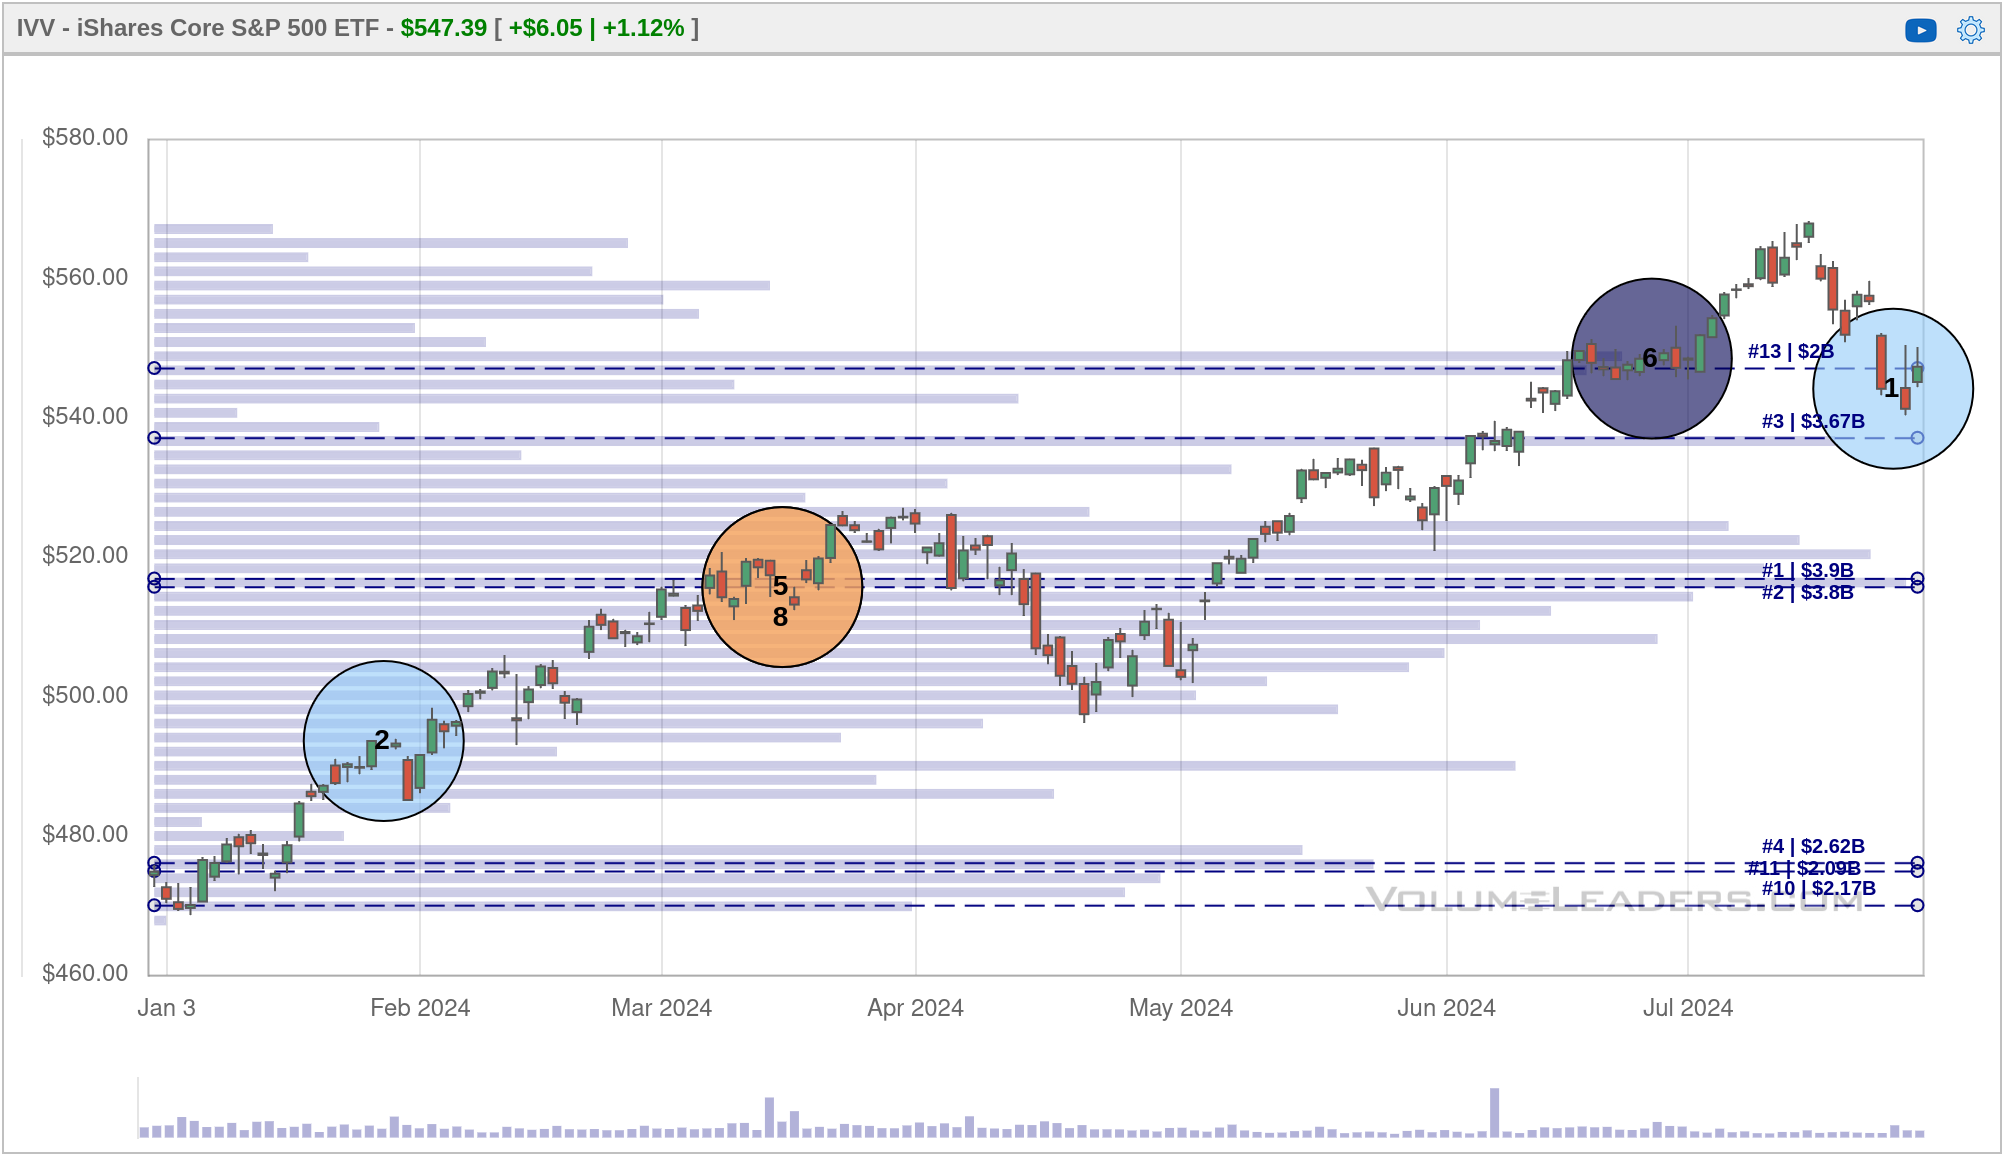
The first trade that caught my eye was the larges trade ever made on IVV, the iShares S&P 500 ETF. Over 2 million shares were traded on July 24th at $544.21. That's where IVV closed on Wednesday. It traded below it on Thursday and then bounced above that level Friday. An older #6 trade from June at $548.57 sits nearby.
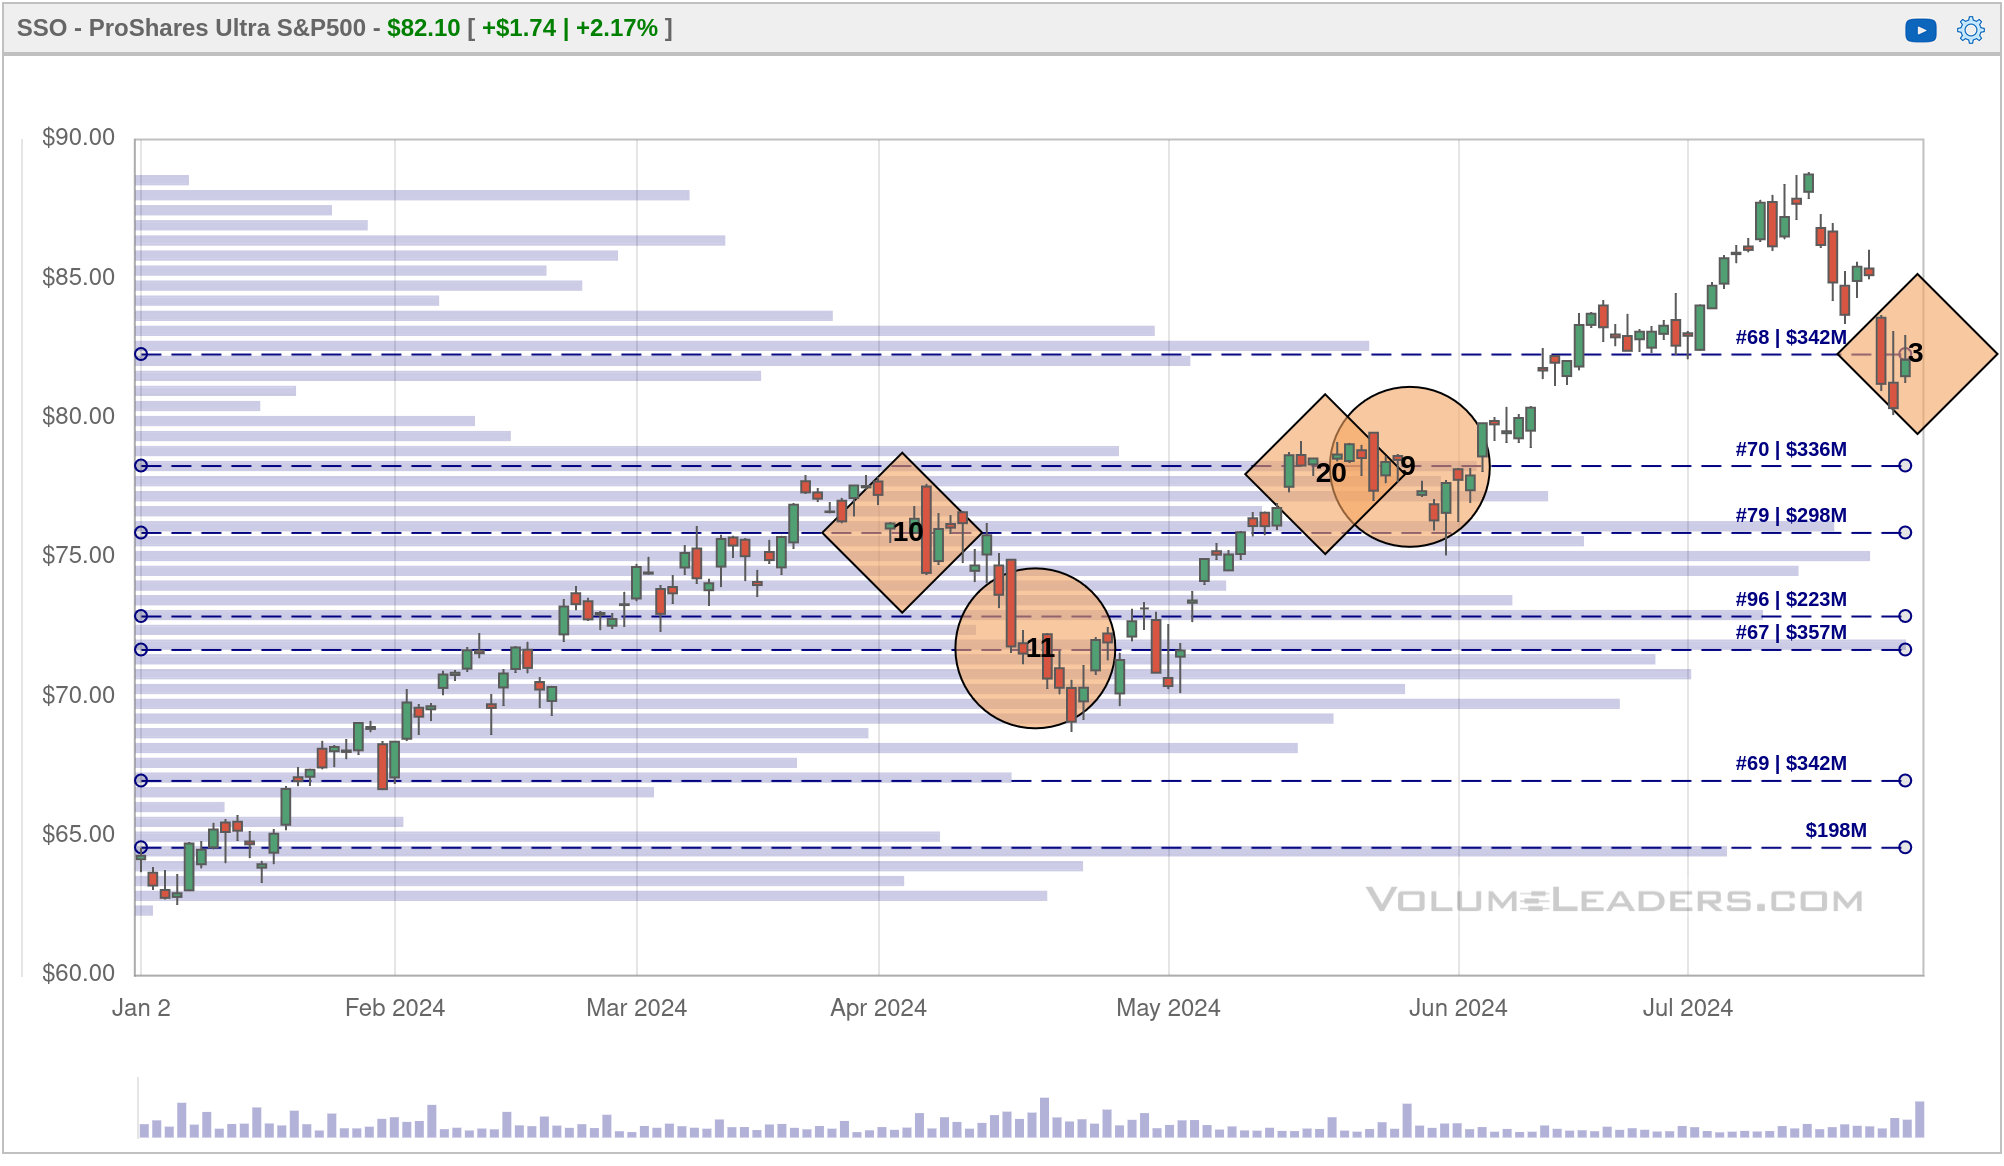
There was also a #3 trade on SSO, the ProShares Ultra S&P 500 ETF. This is a leveraged ETF where traders like to jump on expected short term moves in the market. This #3 trade hit on Friday at the close.
SPY closed Friday at $544.44. This is an important level to watch as it could become a new base for a move higher, or it might turn into resistance and signal a larger correction is on the way. SPY and IVV have large volume levels just under $520, so if we do correct more, that is the next spot to watch.
Russell 2000 trades
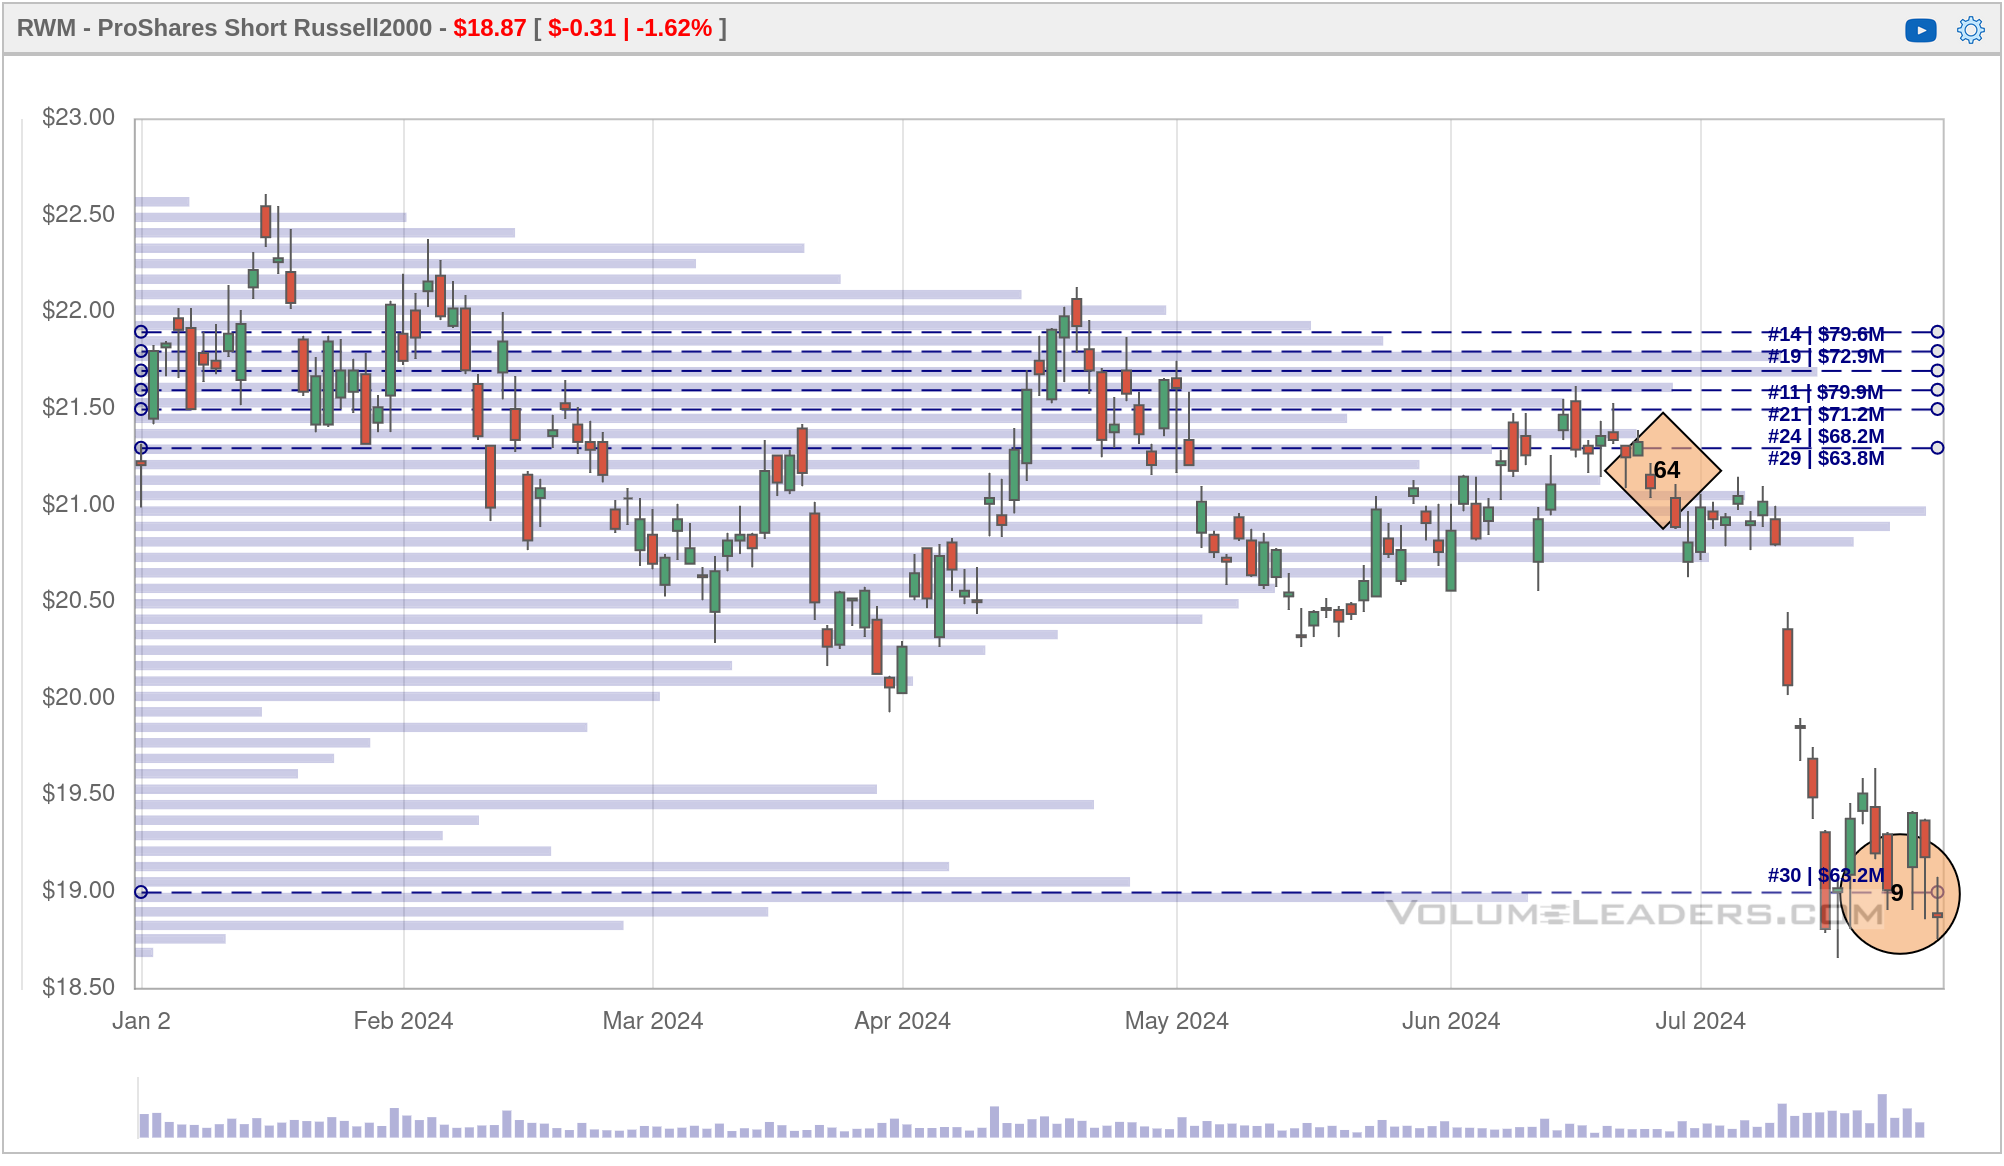
Lots of eyeballs are on the Russell 2000 index, especially after its recent performance. I couldn't find any outsized bets on IWM last week, but traders were placing bets on RWM, the ProShares Short Russell 2000 ETF. This is a short ETF, so it moves opposite to IWM.
A #9 trade arrived at the lowest spot of the year. Although it was only $60M worth of bets, that's 38 times larger than the average RWM trade since it began trading. IWM was sitting around $222.63 when this trade came through, so that level is important to watch.
XSMO, the Invesco S&M Small Cap Momentum ETF, had some other interesting patterns. The #1 and #2 trades appeared during IWM's consolidation in May/June. Last week saw the arrival of trades ranked #3, #4, and #5 right at the highs.
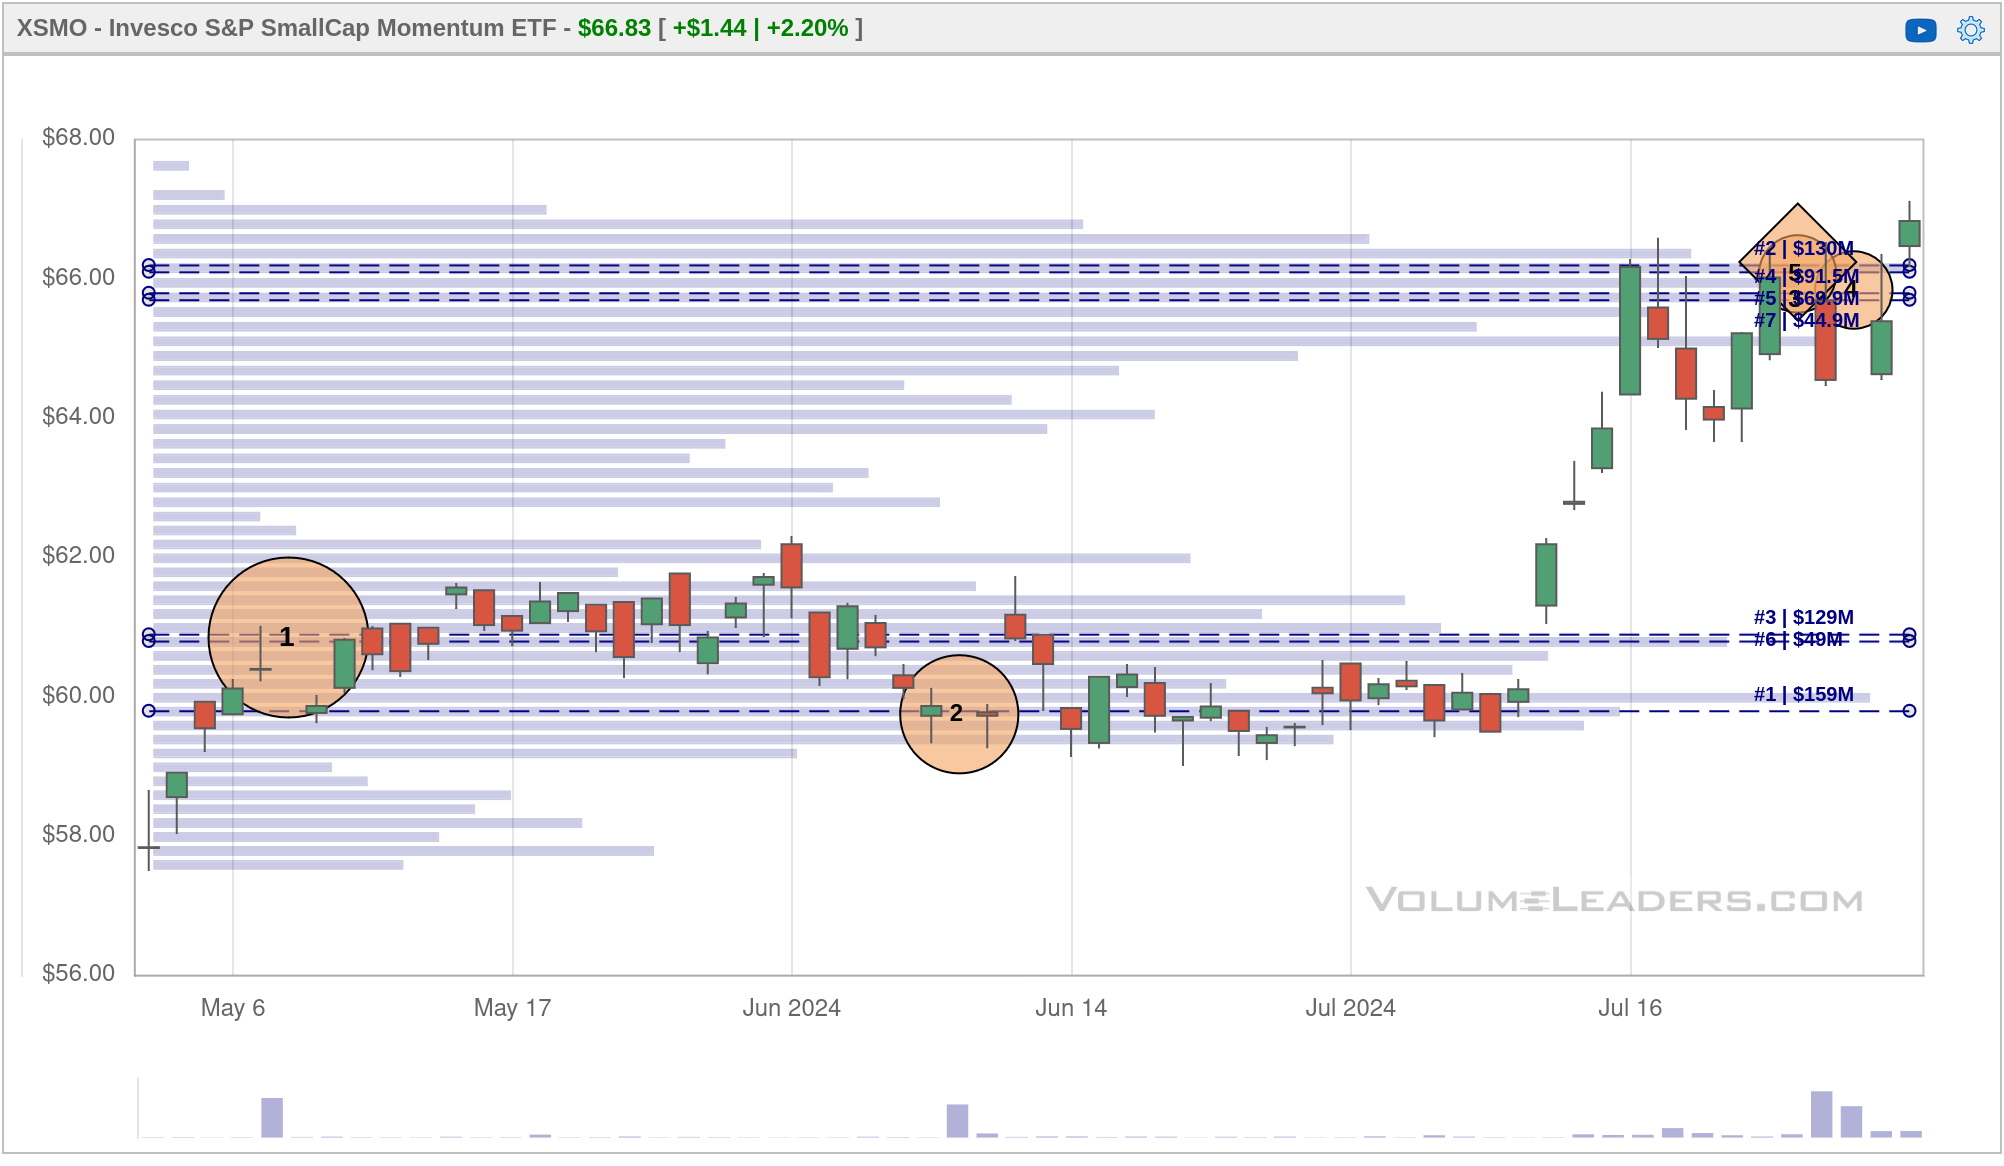
It's difficult to tell what traders are doing here, but it's clear that IWM's current level is really important to traders. It could be a new base for a run higher or resistance prior to a move lower. Keep an eye on IWM's $222-$226 range.
NVDA trades
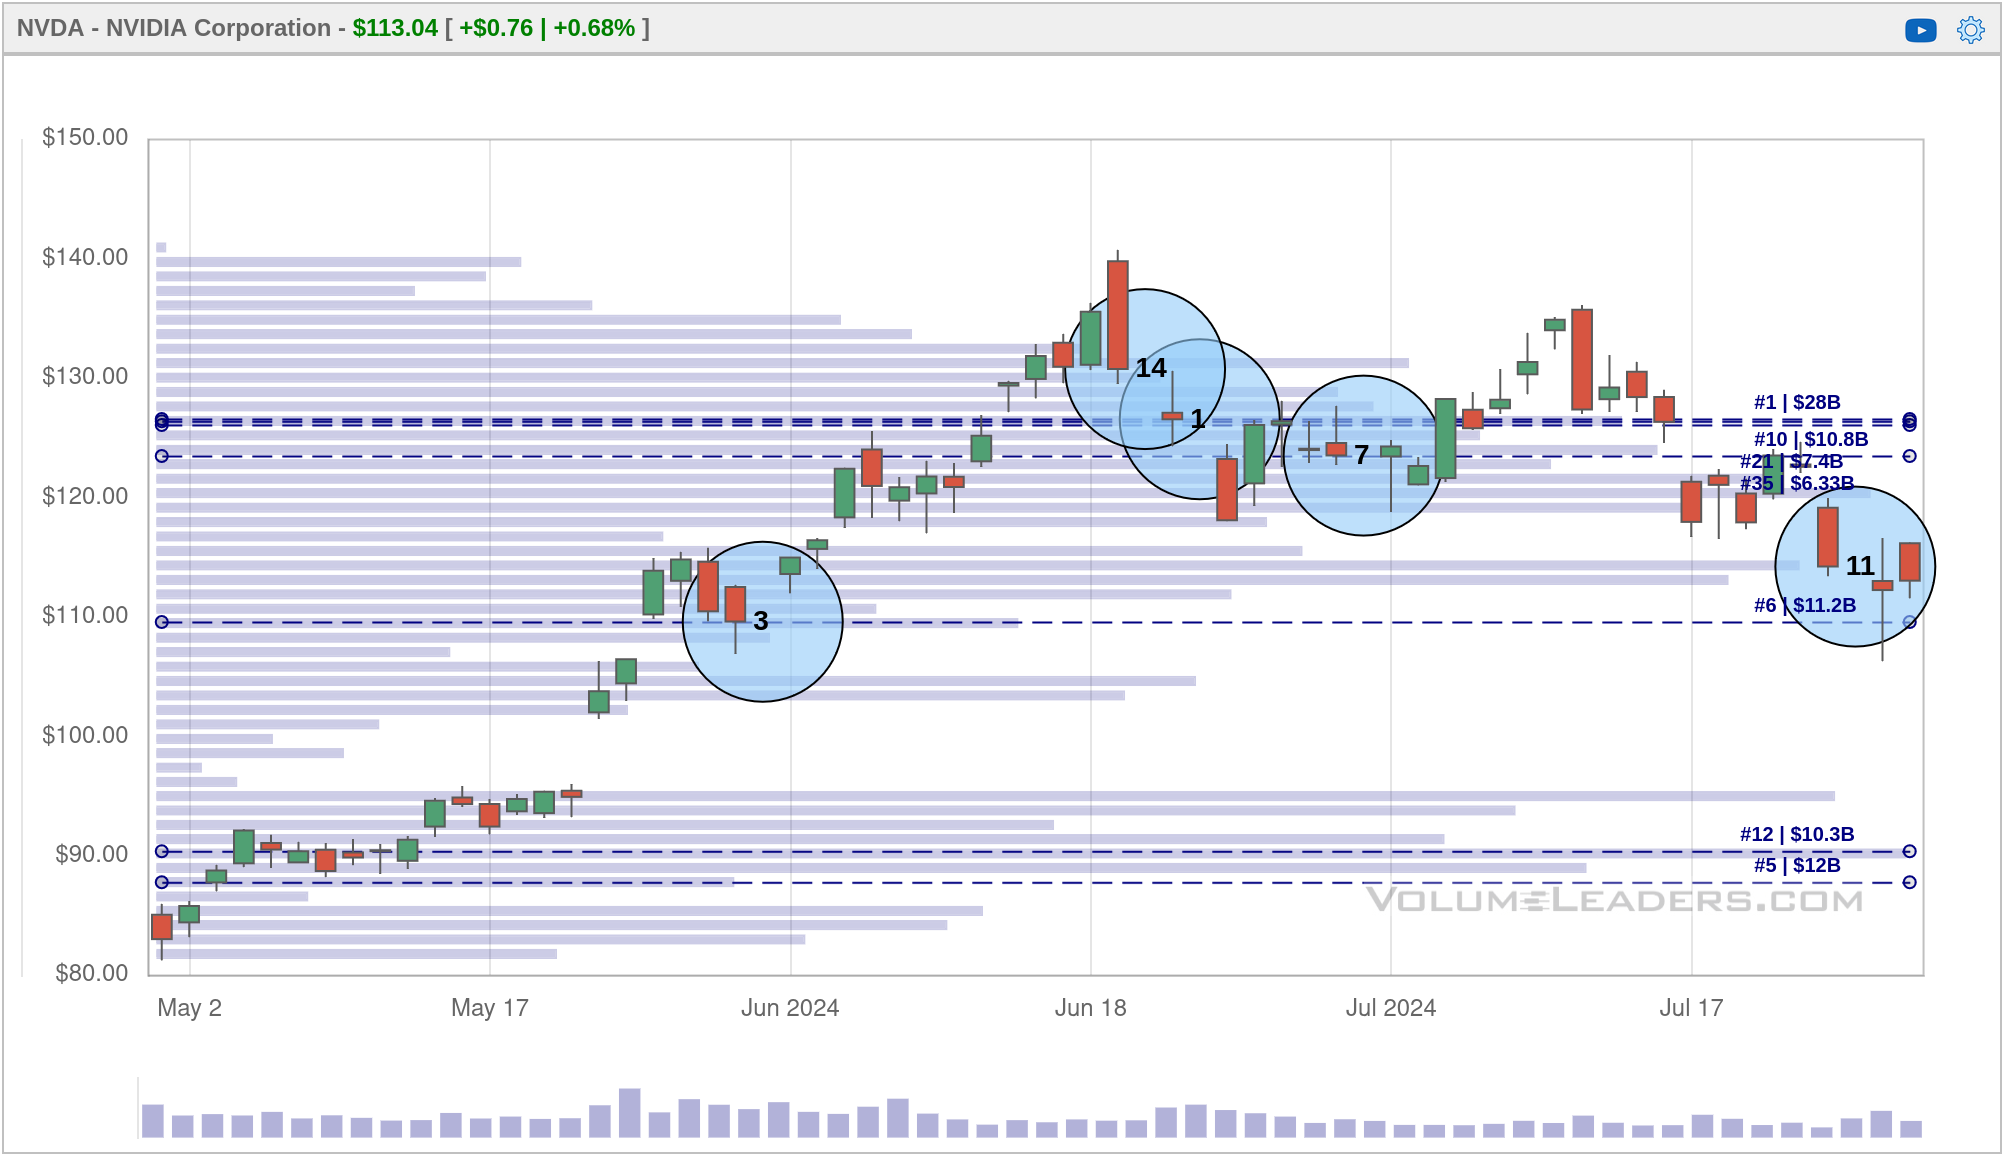
NVDA has received tons of attention lately and it had a #11 ranked trade last week at the lows. It picked up the biggest trade in its history at $126.57 on June 21 worth just under $14B. That's huge.
When I see a cluster of trades at highs followed by more trades at a consolidation level, I get excited for a new rally. However, NVDA traded down through three large trades, tried to make a new high and failed. The #11 trade is quite close to the old #3 level around $123 which was worth over $4B.
Tracking in NVDA is easier when you begin looking at its array of leveraged ETFs. Here's a selection of big trades made recently on some of these ETFs:
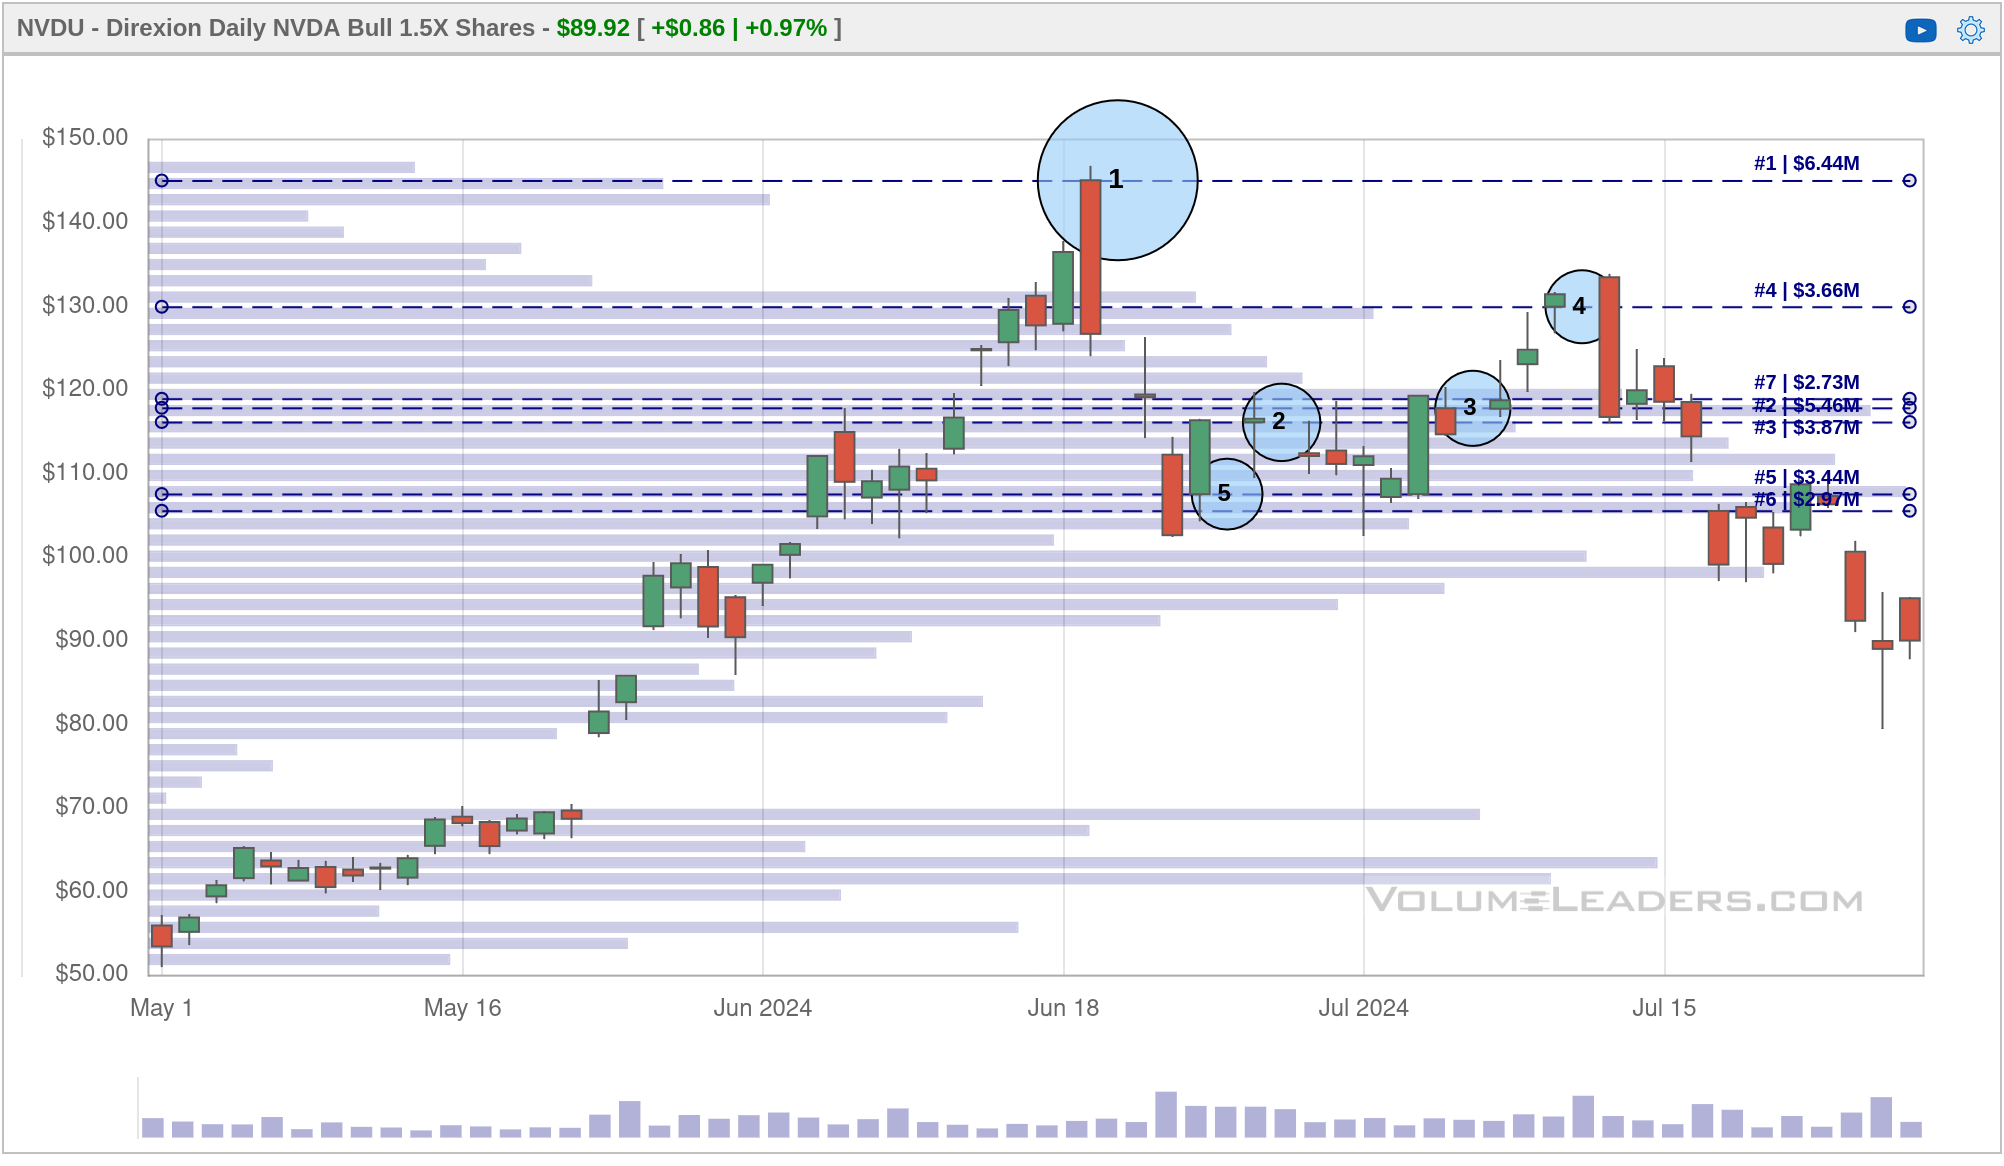
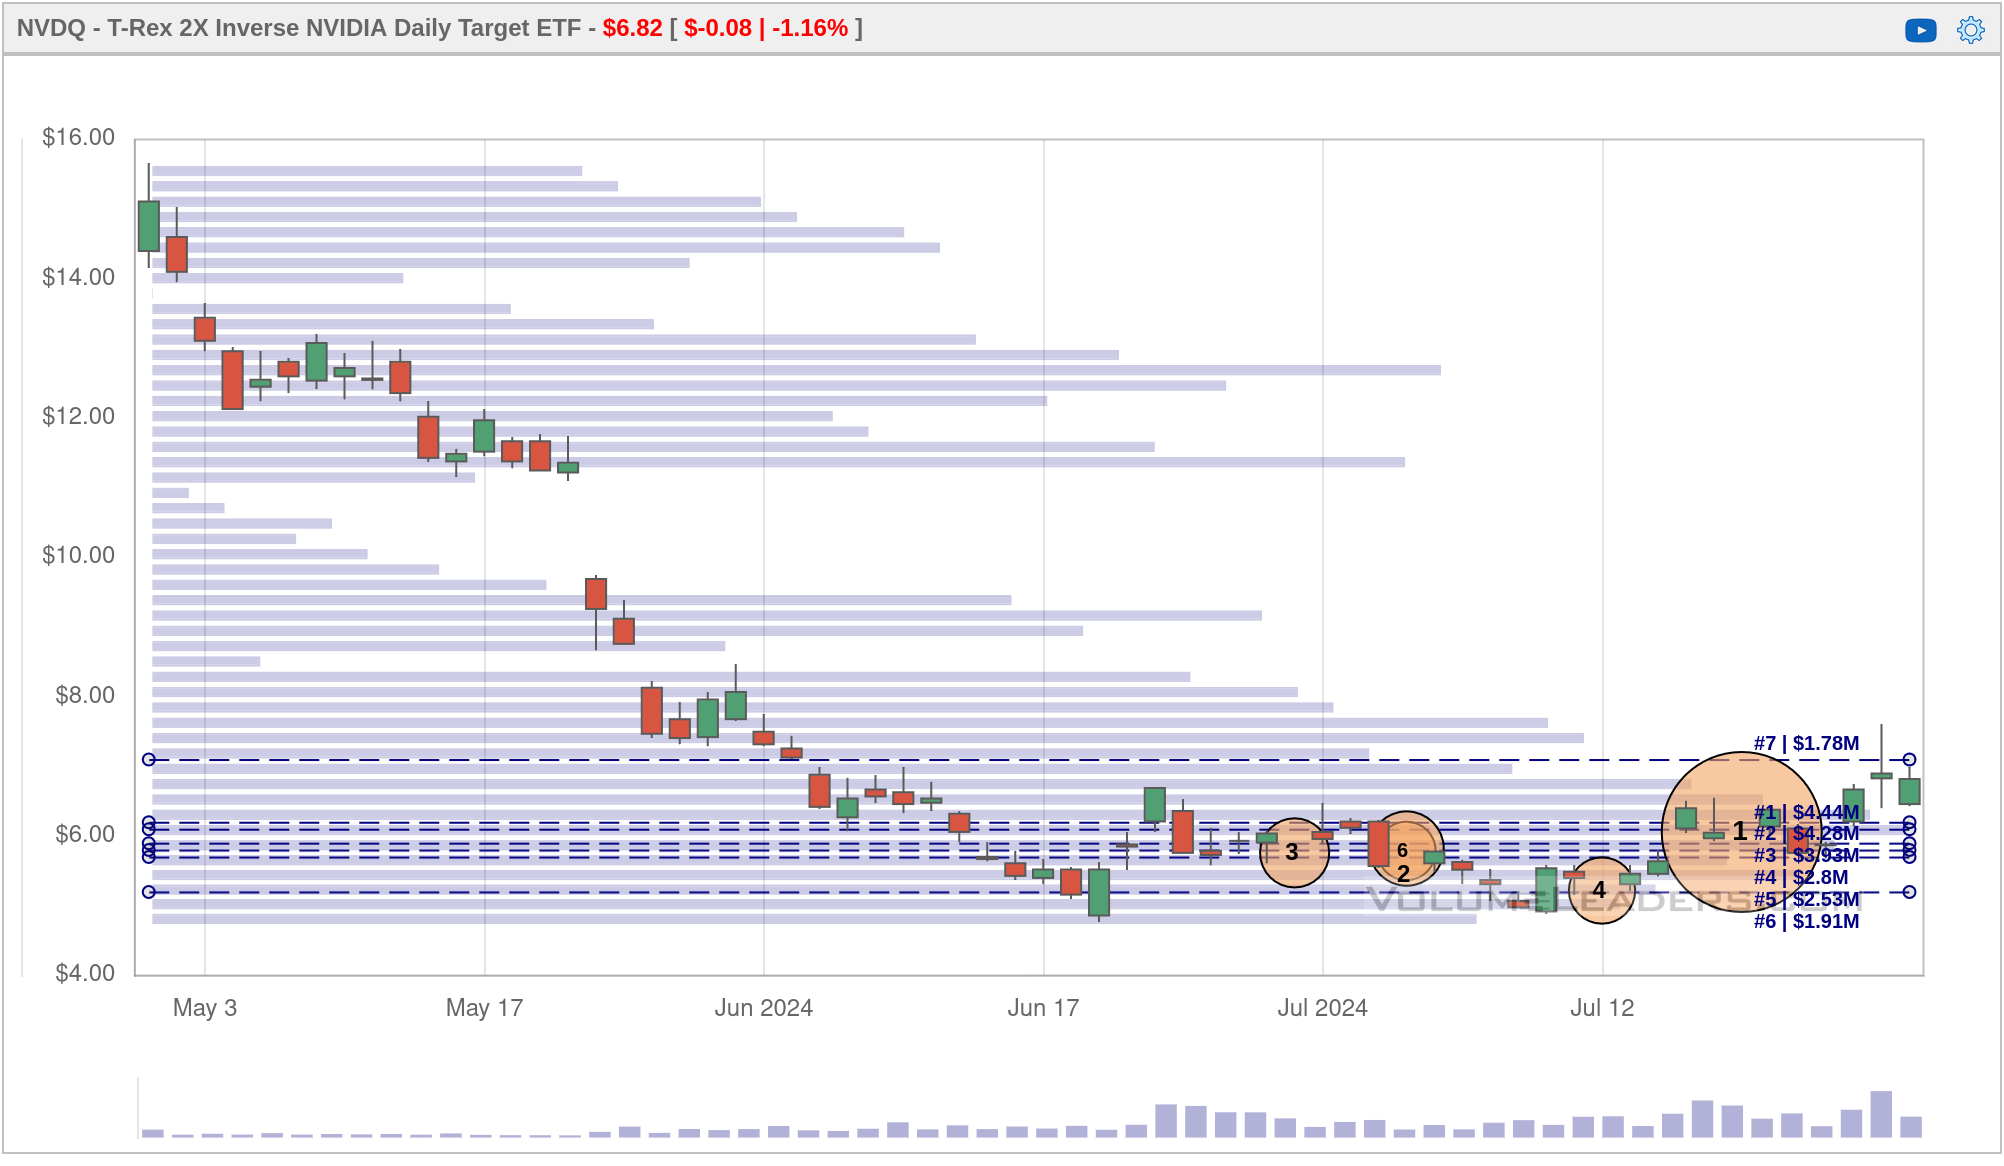

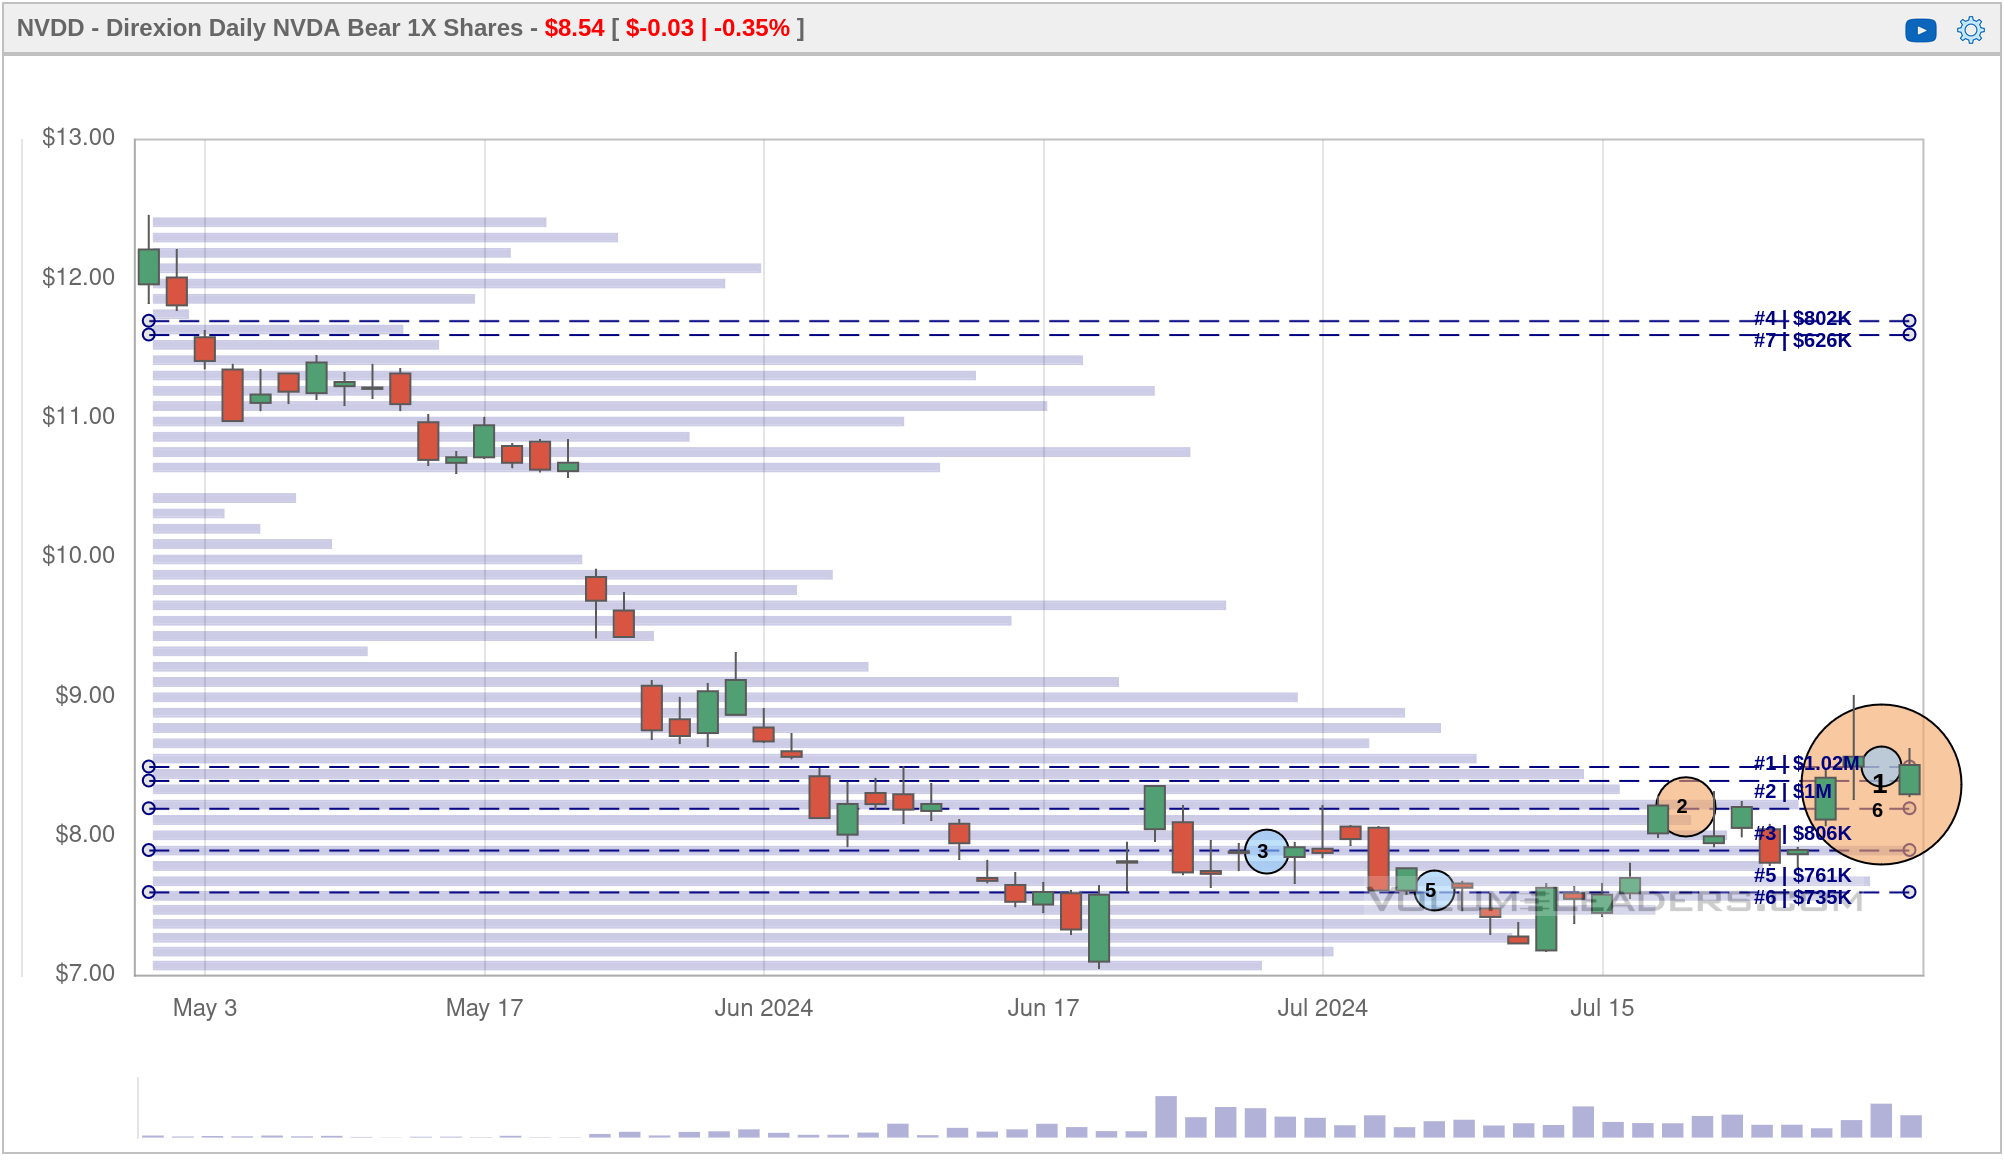
NVDA leveraged ETFs
The NVDU #1 trade was a perfect mark of NVDA's recent top. The other long ETF, NVDL, has some trades that look similar to NVDA's main chart. The short ETFs show very recent #1 trades and it doesn't appear that traders have made their exit yet. This suggests to me that NVDA likely has some more correction left in it, possibly to the $109 level or down into the unfilled gap around $100.
Semiconductors
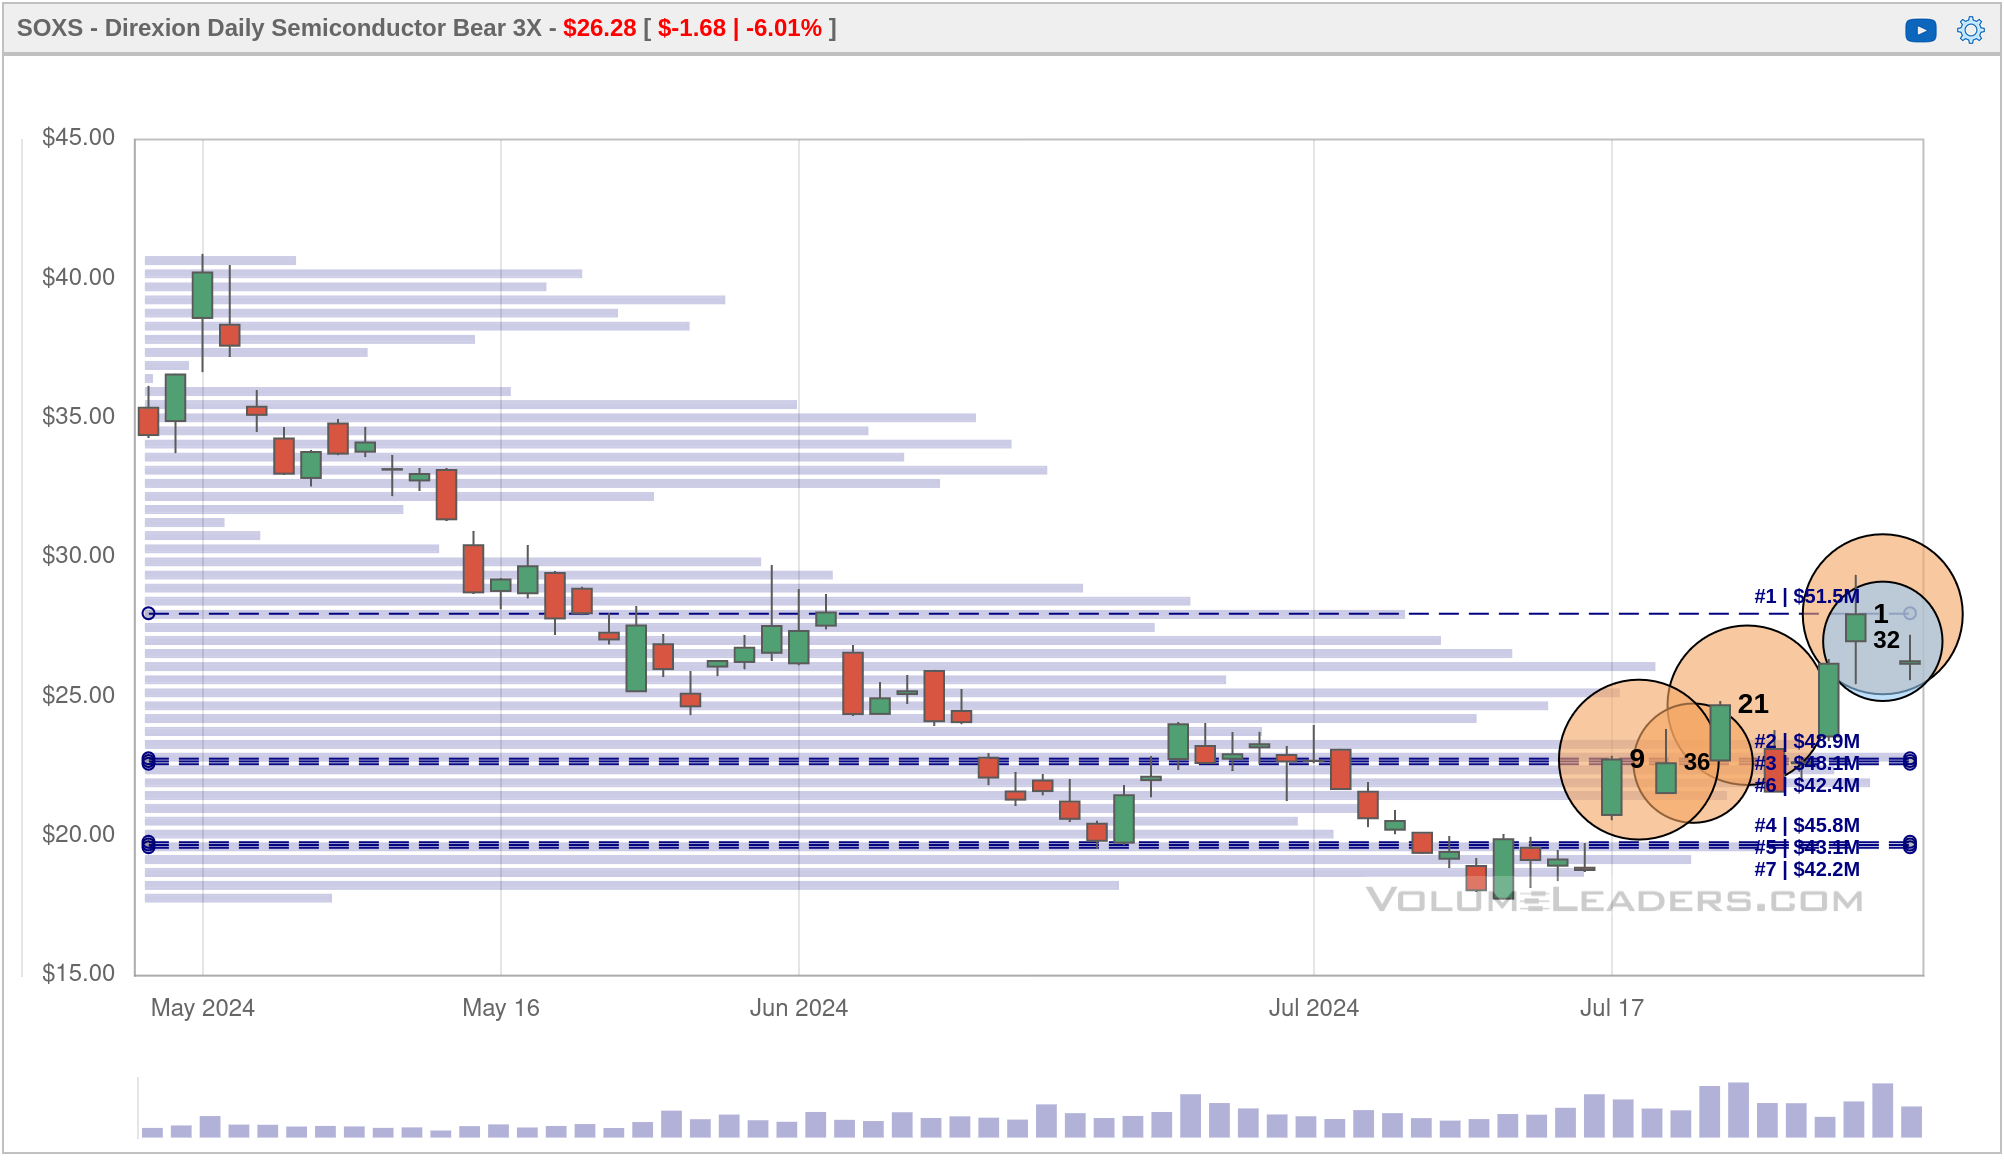
I wrote about semiconductors last week and there are some new big trades recently that are worth a look. SOXS is a short leveraged semiconductor ETF and it's steadily been picking up large trades since the recent top. Price continues to trade through these, which leads me to believe that traders are betting on a continuation of the trend. The #1 trade hit Thursday with 1M shares traded. Semiconductors improved a little on Friday, but SMH's $236 level is definitely one to watch.
SMH had its own large trade Thursday with #20 arriving at $238.63. It's very close to the #19 trade that arrived back in late May. Both trades are very similar sizes (960K vs 957K).
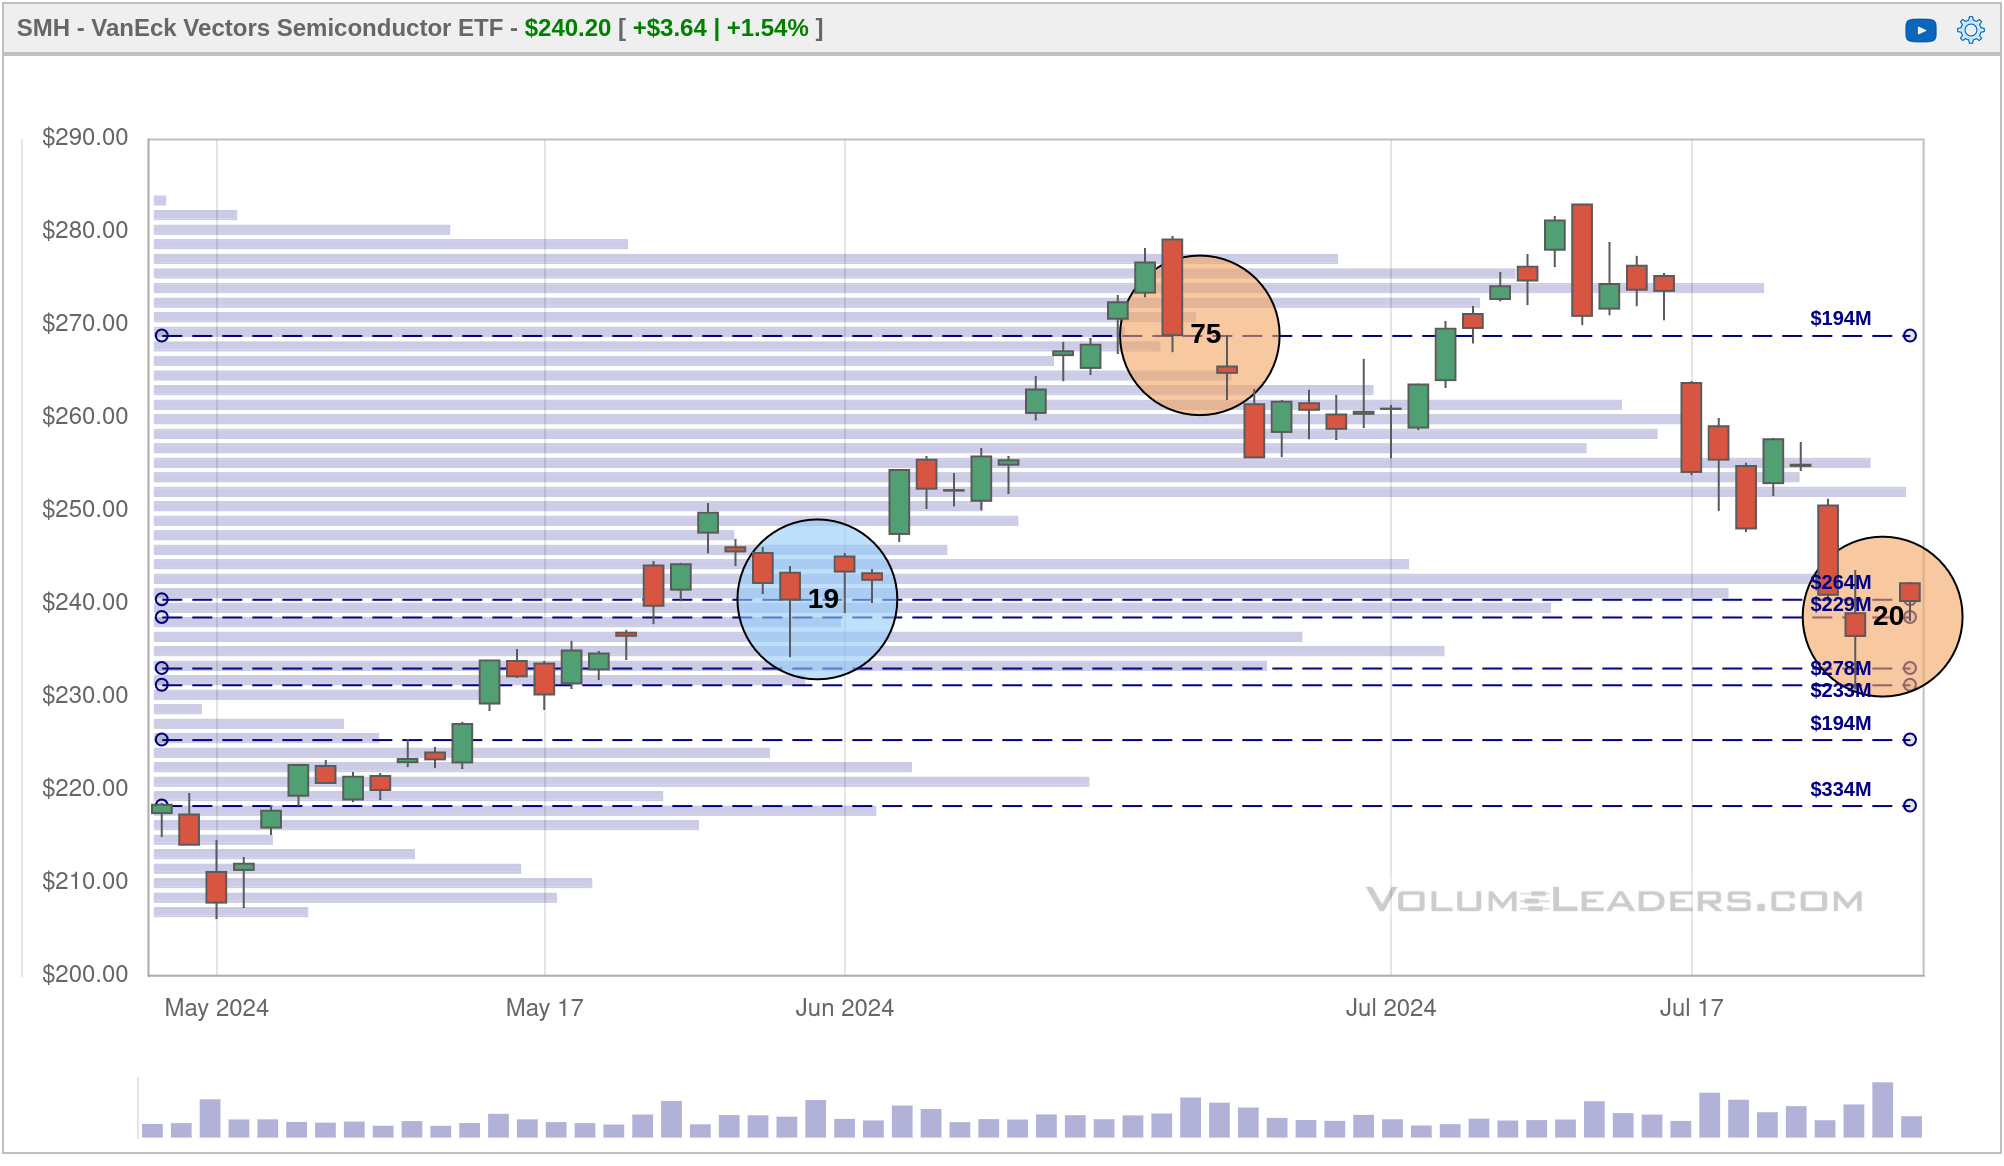
Could this be a trader who was long from May that finally exited? Could it be someone doubling down on the old support level before a move higher? Could it be a new short position? I'm not sure, but this SMH $236-$238 level is critical to watch this week. Remember that semiconductors finished a long 229% rally from the lows and just gave back about 15%.
Thesis
This week's interest rate decision is likely to be lackluster, but watch for how the Federal Reserve signals their intentions going into September. If they make their intentions clear, we should see volatility relax a bit (US election volatility is certainly a real thing right now), and that could fuel a bounce in some of the names which have taken a beating lately.
I'll be closely watching some key levels:
- SPY $544
- NVDA $105-$110
- SMH $236-$238
- IWM $222-226
Be careful with making big bets going into Wednesday's interest decision. Sometimes the rate decision seems clear cut, but then the press conference throws a wrench into those expectations.
Good luck to all of you this week! ☘️
Discussion