Weekly prep for March 25, 2024

Kick off the last week of March 2024 with a broad market look and an AMD update. 🤔

Hey there! I'm back to blogging on Ghost and that means you should see posts in your inbox again. I kept going back and forth between whether I wanted to keep the blog going (it's a lot of work!) or switch it to a static blog with no newsletter.
Lots of you replied and said you wanted the newsletter back. Thank you for your support. 💕
All investments come with significant risks, including the loss of all capital. Please do your own research before investing, and never risk more than you are willing to lose. I hold no certifications or registrations with any financial entity.
Without further ado, let's get the ball rolling on the last week of March!
My must watch video each week
Chris Ciovacco's weekly video delivers a broad market outlook by taking a longer term view on lots of critical indexes and ETFs:
The big question raised in the video is whether we will see a rally in small cap stocks in the near term. We had a big jump after COVID, but then it turned out to be a counter-trend move in a longer downward trend.
Higher interest rates add problems for smaller companies as their debt comes due and refinancing debt becomes more expensive. This has much less of an effect on large companies like AAPL or MSFT since they usually have more financing options available and more cash on hand.
Chris provides lots of comparison charts that should show signs of a change in trend if one appears soon. As for now, the small cap strength is still trending down relative to large cap names. Watch his smaller updates and thoughts via his account on Twitter/X.
2024 strategy update
My strategy for this year has been working quite well, but the last couple of weeks have thrown a wrench into some of my trades, especially AMD. I was a bit more bullish here than the rest of the market and some news appeared that pushed sentiment down a bit.
I'm still very green for the year even with the recent bumps in the road. I'm embracing the TastyTrade model of "trade small, trade often" as well as Tom Hougaard's "buy high and sell higher" method.
I still find it incredibly difficult to add to my winners, but I am finding it a little easier to cut my losers earlier. Learning is a process! 🧠
What about AMD?
A broad weekly look at AMD since COVID shows that we're returning to the highs from late 2021 after an awesome rally:
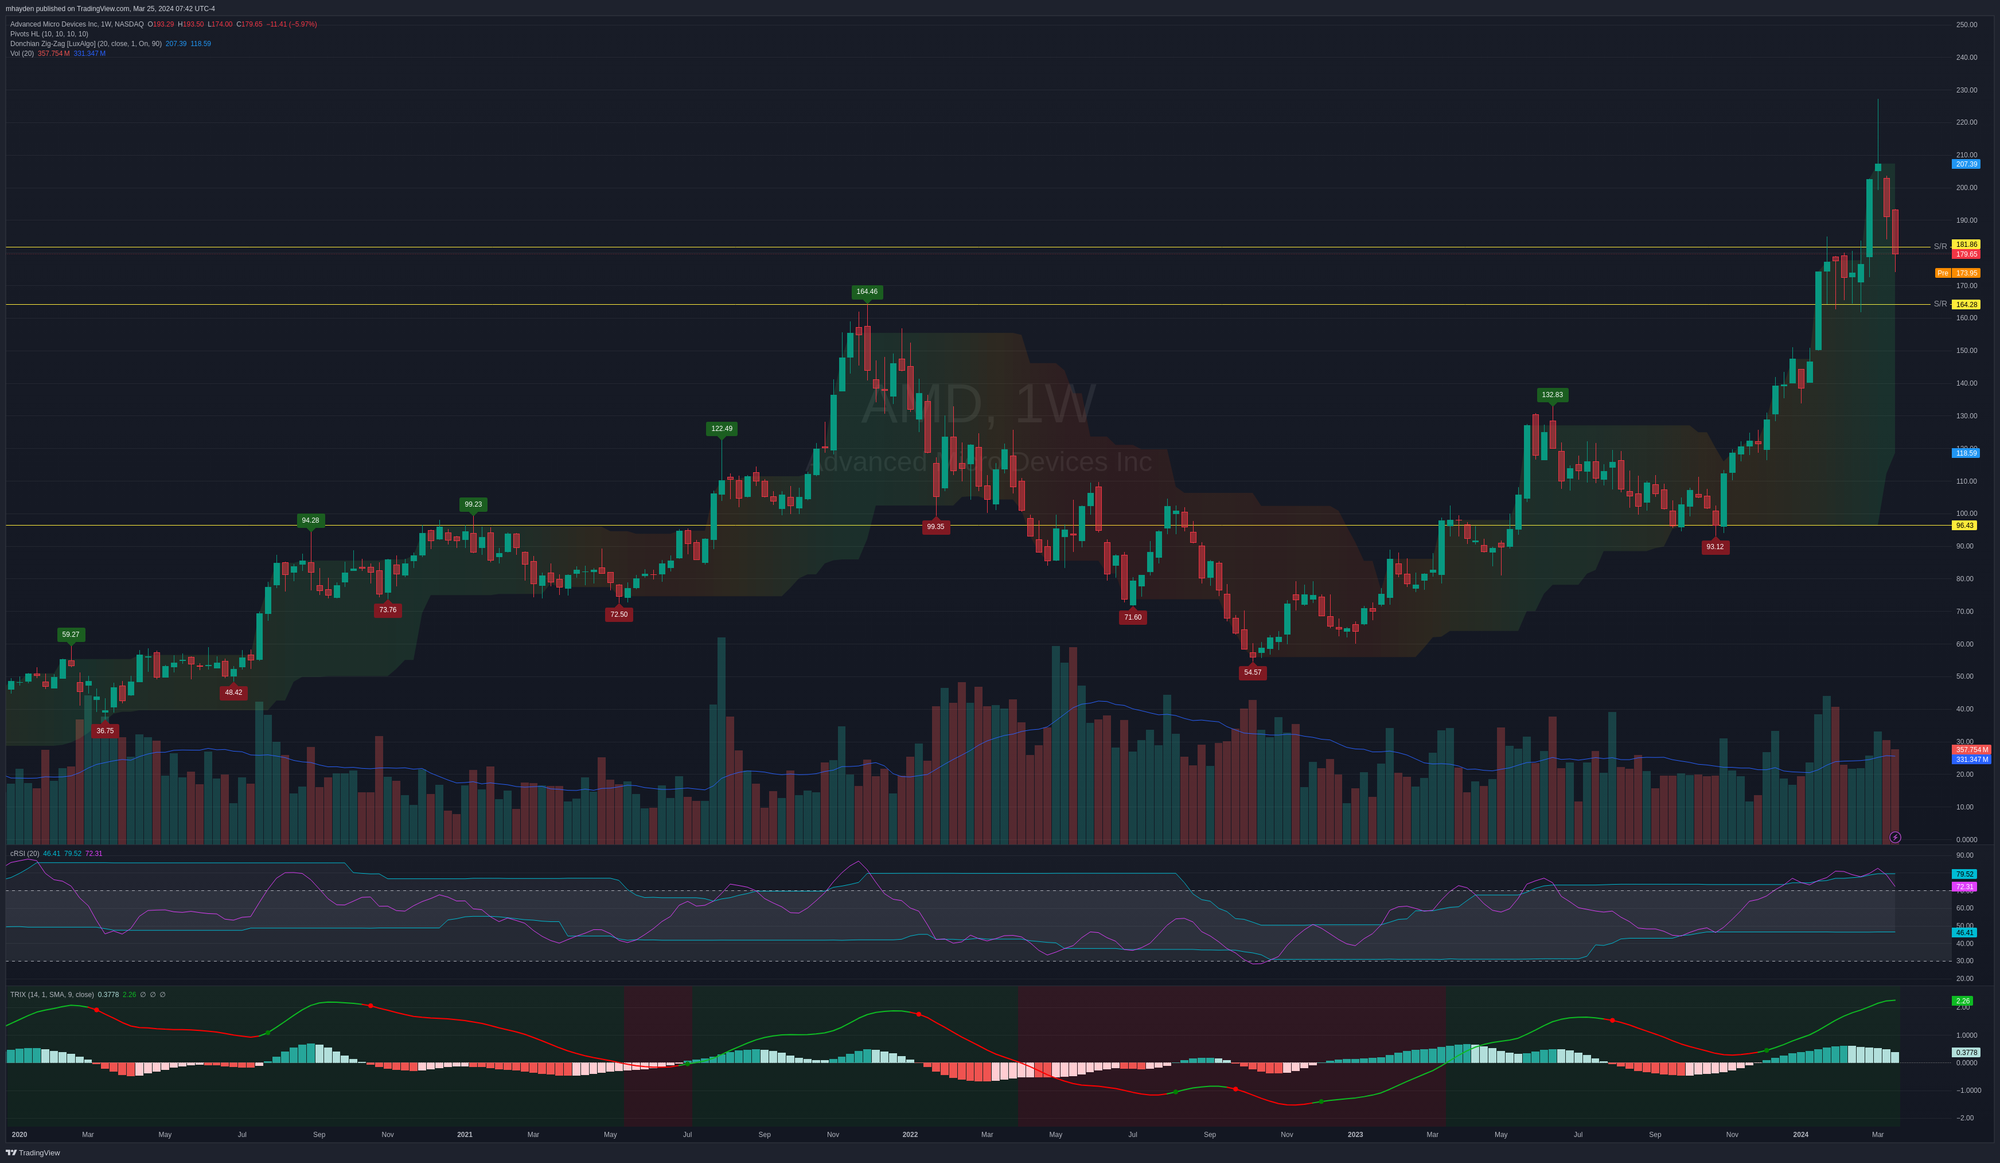
The cRSI oscillator suggests that we're breaking down for a pullback or correction. The TRIX shows we're in very bullish territory, but momentum is flattening out. As a reminder, the TRIX is a lagging indicator as it is built on multiple moving averages.
If you're looking for some optimism here, there is some to be found:
- Volume is decreasing over the past two red weeks. That suggests to me that the trend is weakening slightly as we approach some support lines.
- We're approaching a consolidation zone from about $164-$181 where AMD saw a significant amount of volume for 5-6 weeks.
The chart from Volume Leaders tells the story well. If we look at the top 10 trades (excluding closing trades) since January 16th, we can see the consolidation clearly. AMD also began receiving a lot of attention from institutional investors as it drifted underneath $190:
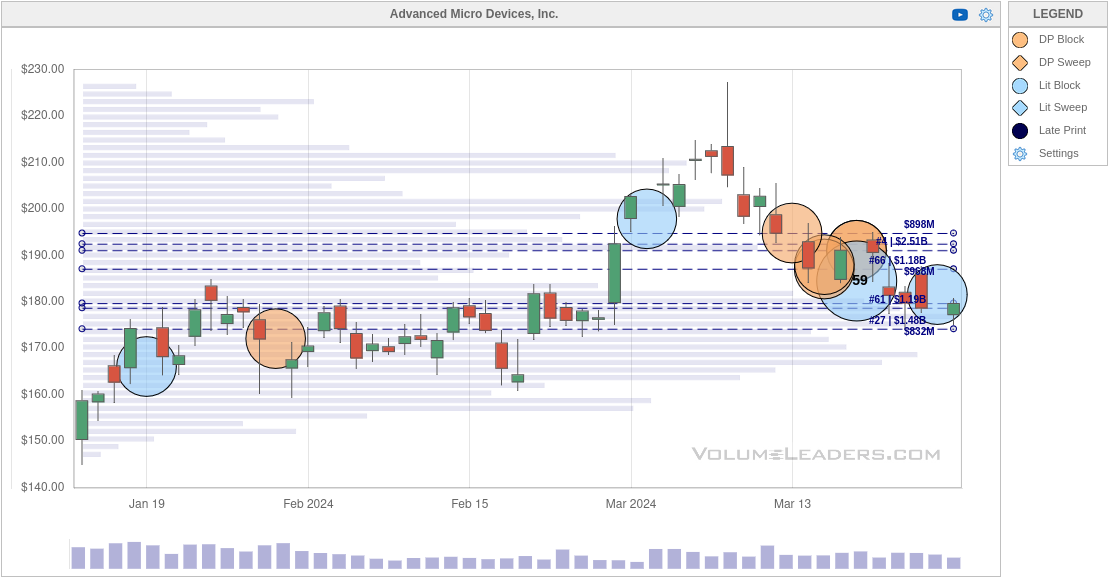
Could this be institutions getting out or taking profits? It certainly could be.
Could it be institutions increasing their positions after AMD took a hit over some bad news and was overshadowed by NVDA's recent developer event? That could be possible, too.
Either way, I'm very interested to see what AMD does in the $160s and $170s.
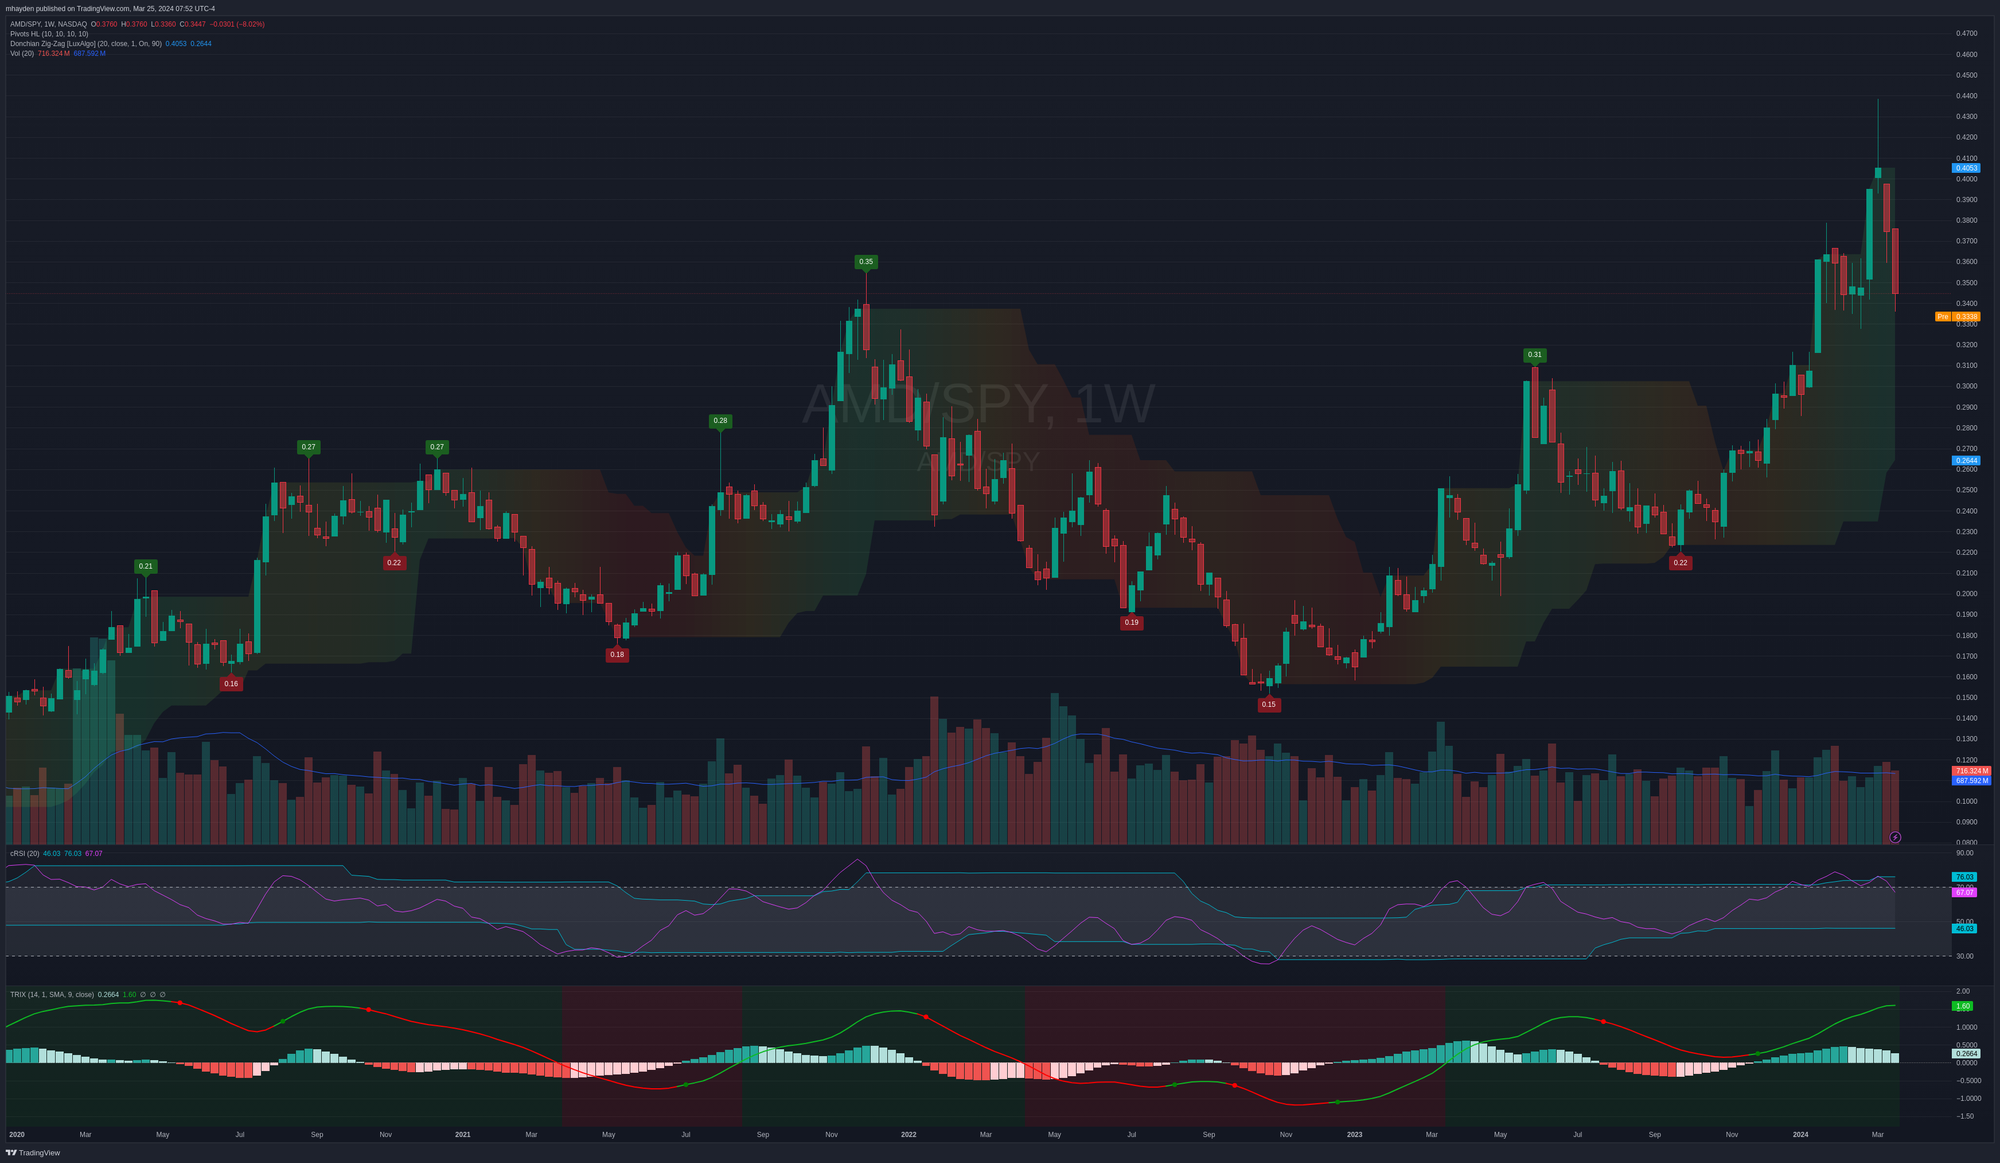
AMD vs. everyone else
How does AMD look when compared against the rest of the companies in SMH, the semiconductor ETF? This chart moves higher when AMD shows strength relative to other SMH companies:
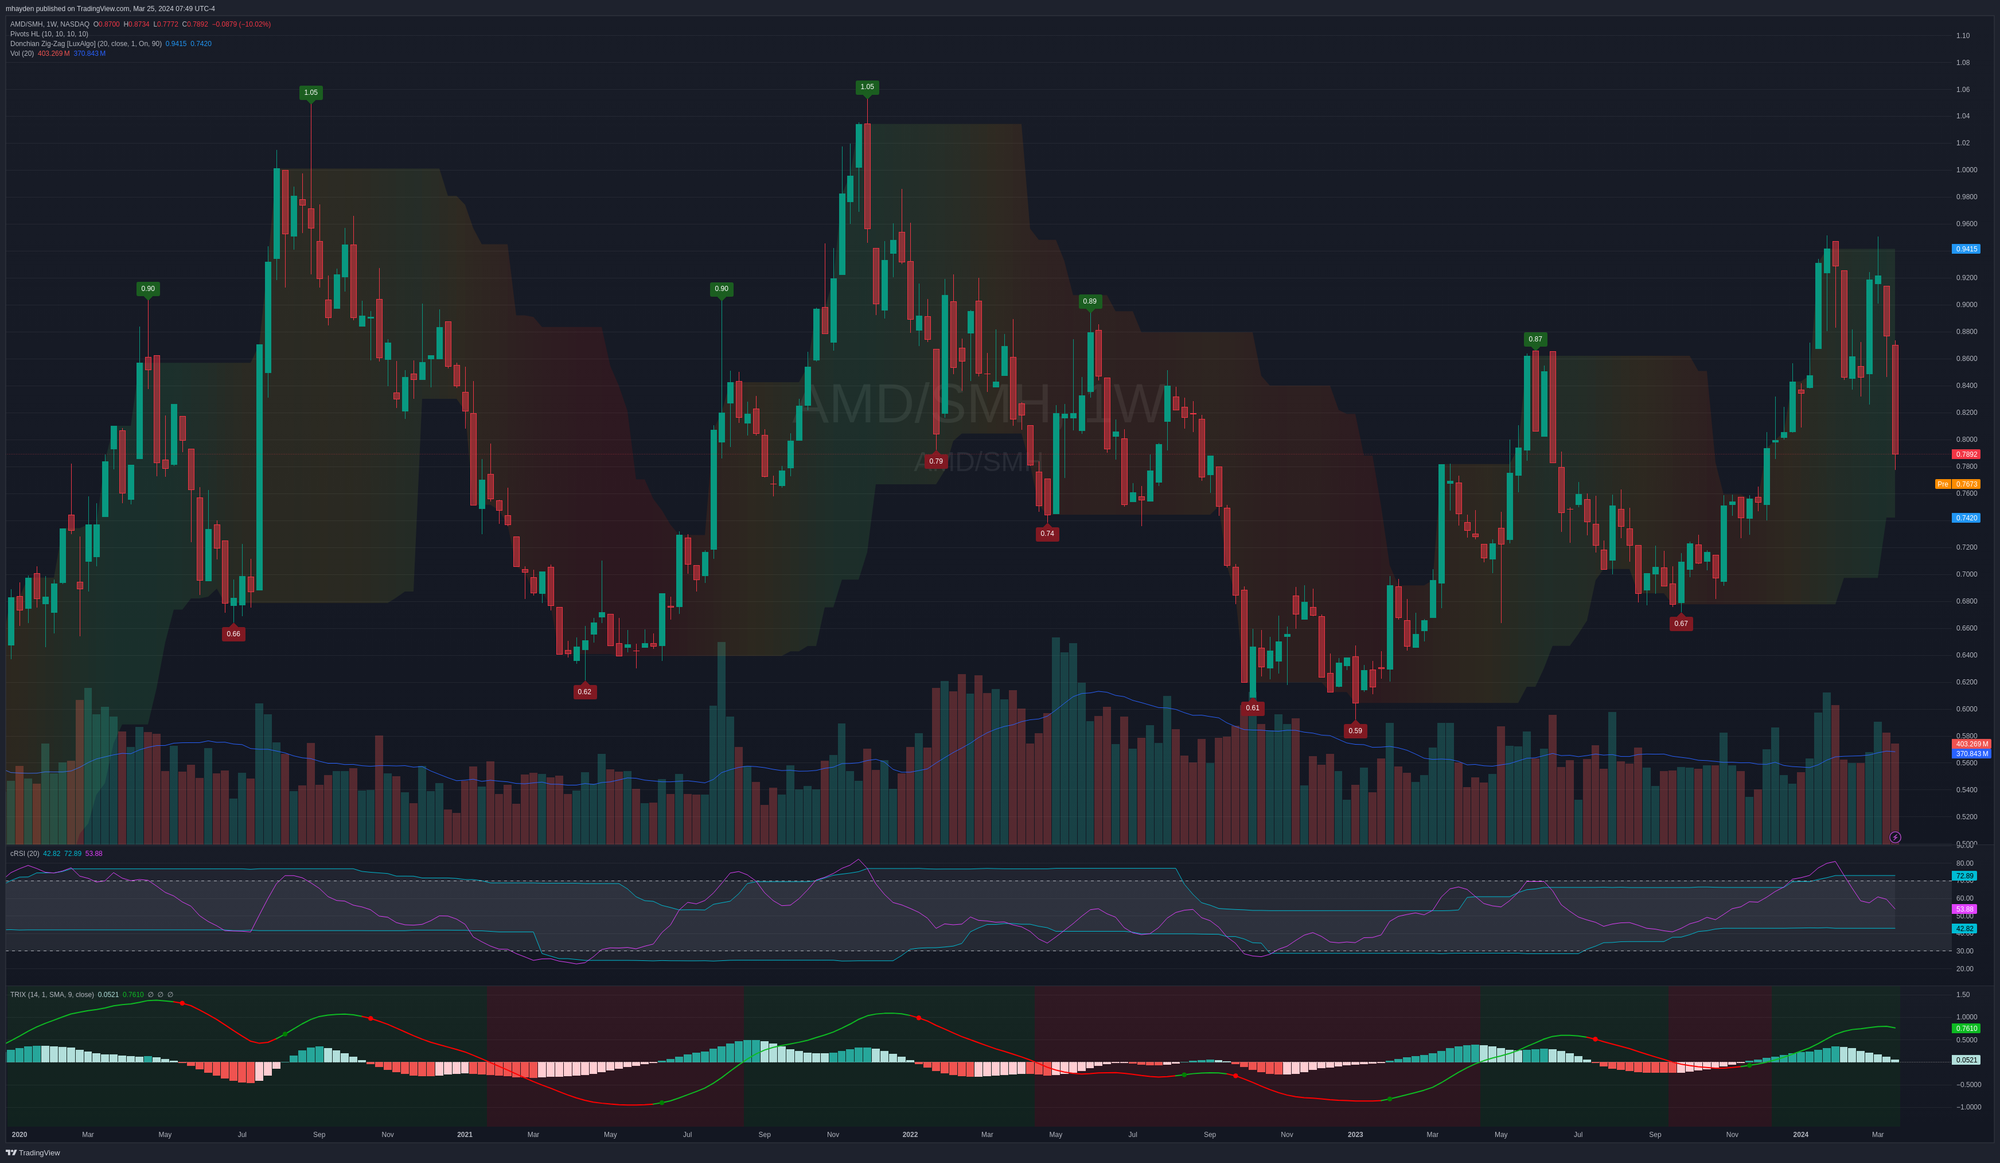
The long term pattern since early 2023 shows a general strengthening with some pullbacks in strength from time to time.
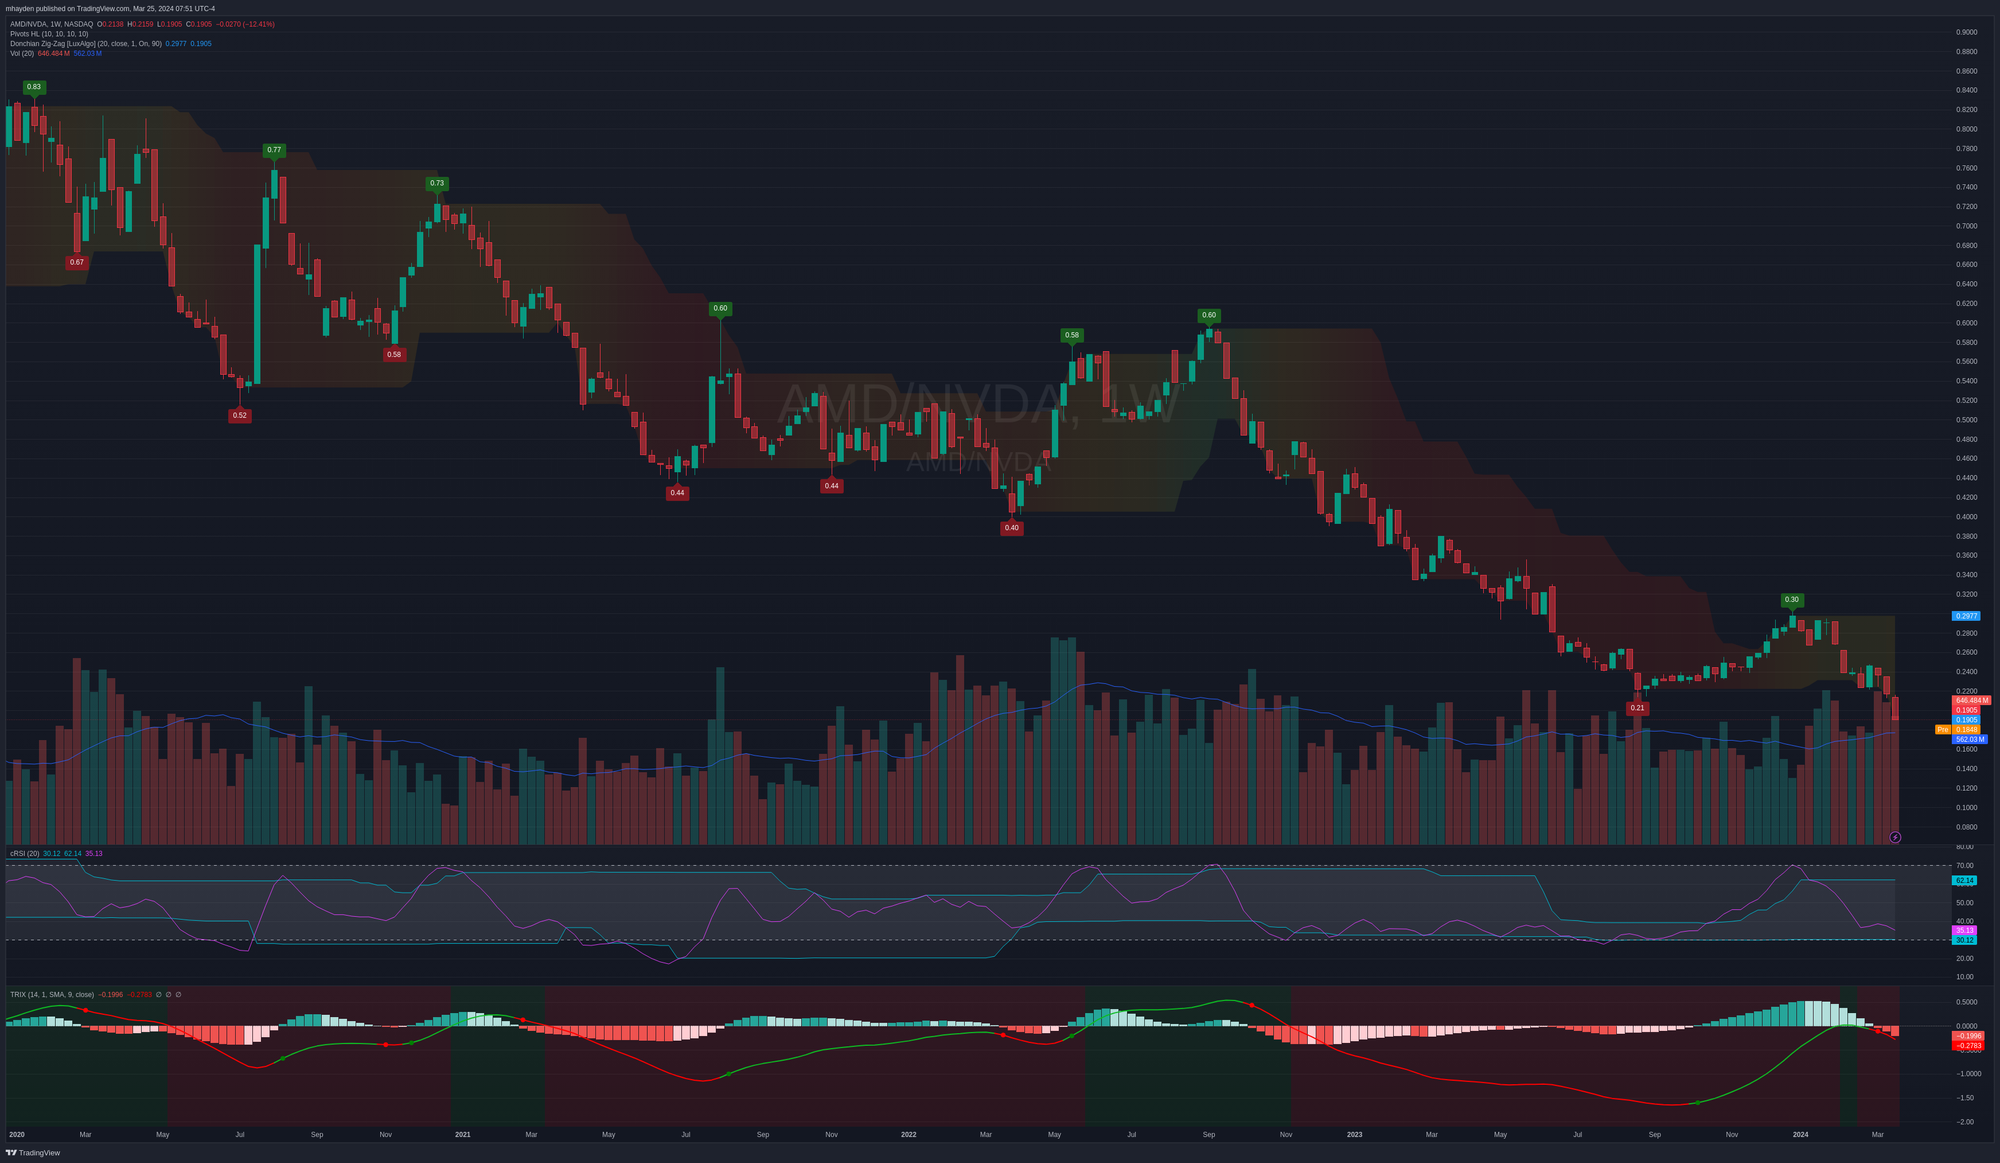
As you might expect, the AMD/NVDA chart shows a distinct downtrend, which indicates that NVDA is gaining strength over AMD quite consistently:
But, when you compare AMD to SPY, it's clear that it's strong relative to other S&P 500 components:
My trades
There are two things I do after a trade fills at my brokerage:
- Make a good-to-close order for a 50% profit target
- Log the trade on Theta Gang
Trade journals are an incredible benefit for any trader. They allow you to go back in time and understand why a particular decision went one way or the other. It also shows transparency to other traders and helps them learn. I love it when someone opens a trade, explains why, and then I can open a trade to see the same thought process.
I have several short puts on AMD right now (probably more than I should):
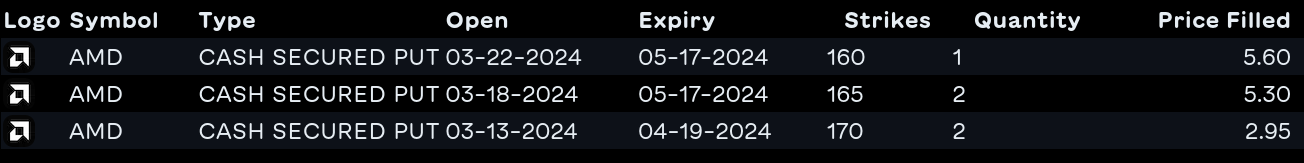
All of them sit within that consolidation zone that I am eager to watch. 👀
Good luck to everyone this week. 🍀
Discussion