Weekly wrap-up for 7/28

GDP numbers looked good, but AMD and TSLA look like they're still in a tight range. Let's dig into numbers before the weekend.

Happy Friday! Yesterday's GDP numbers came in higher than expected:
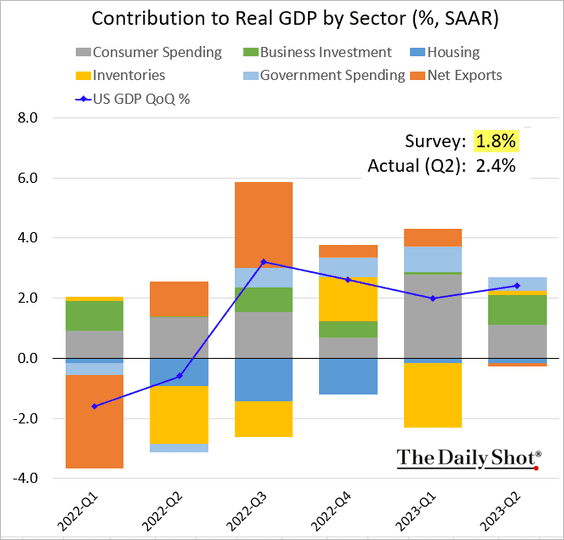
That's a great indicator for the overall economy. Housing investments came down as a percentage of GDP and the job market remains strong, but home sales still lag. Mortgage rates over 7% and inflated home values have kept home buyers at bay a little longer.
It's time to dig into the latest data and see where the market is headed. But first:
All investments come with significant risks, including the loss of all capital. Please do your own research before investing, and never risk more than you are willing to lose. I hold no certifications or registrations with any financial entity.
Let's finish the week strong! 💪
Overall market
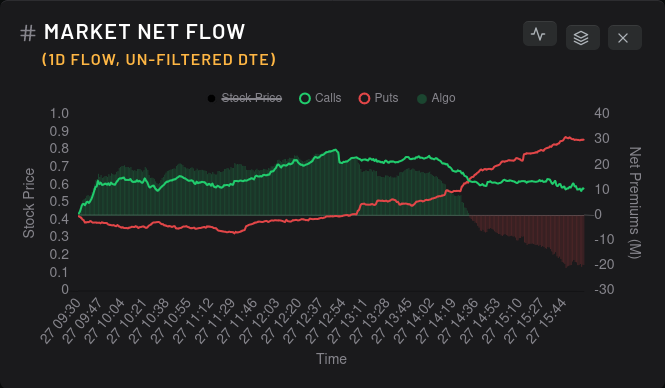
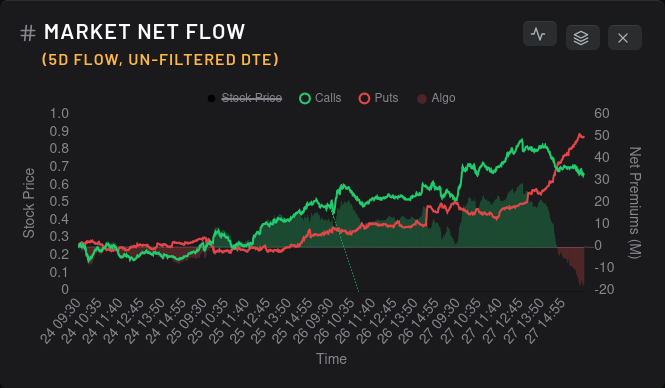
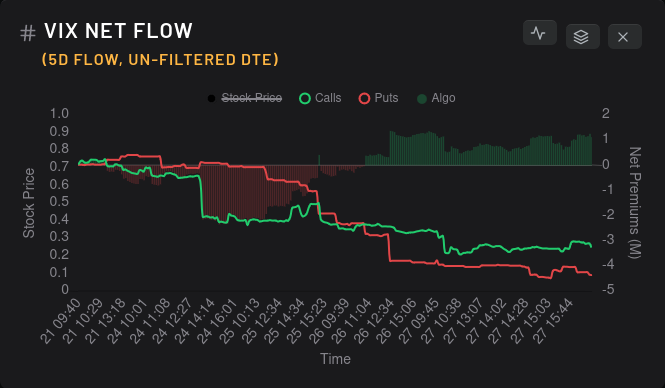
The options flow for the market took a bearish turn yesterday afternoon:
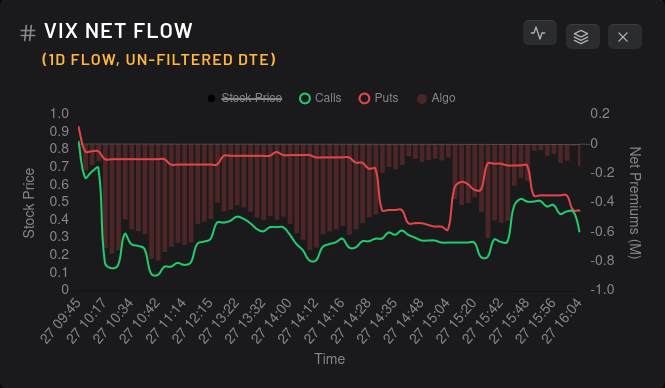
But bets on volatility continue to fall off the board:
SPY made a gap up in today's pre-market trading and is sitting around $454. If I combine the vanna for each SPY expiry through 8/4 (next Friday), I get a chart that shows a lot of selling pressure from $460-$465:

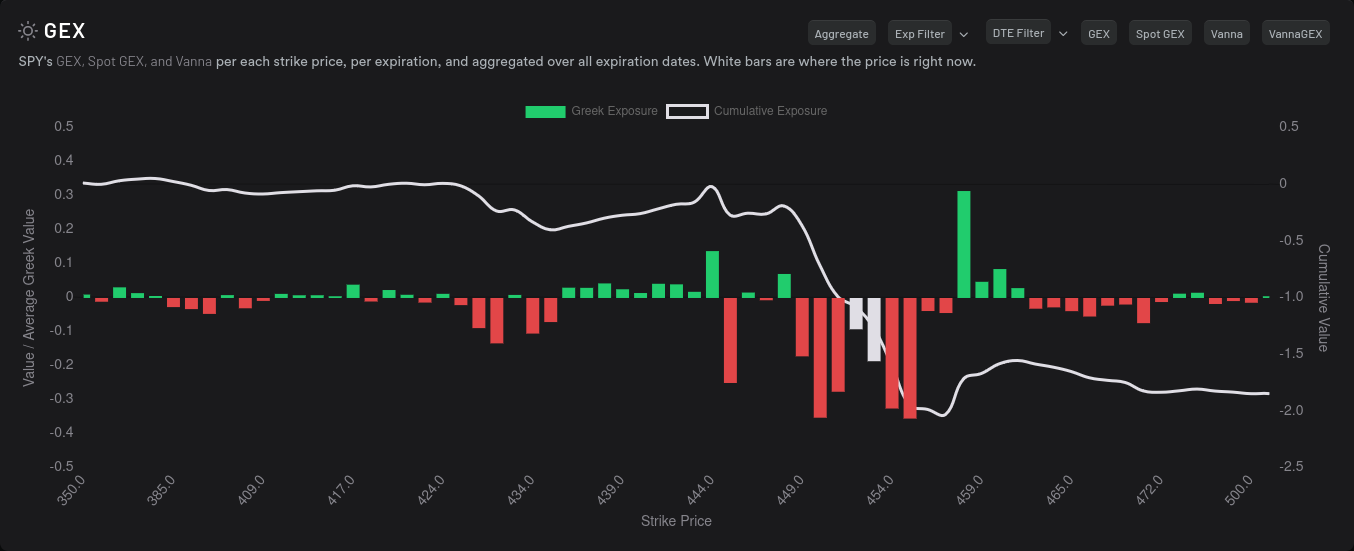
SPY's aggregate gamma exposure (GEX) across all expiries shows that we're in the middle of a negative GEX zone where price is fairly free to move around. $448 and $458 look like the edges of this zone:
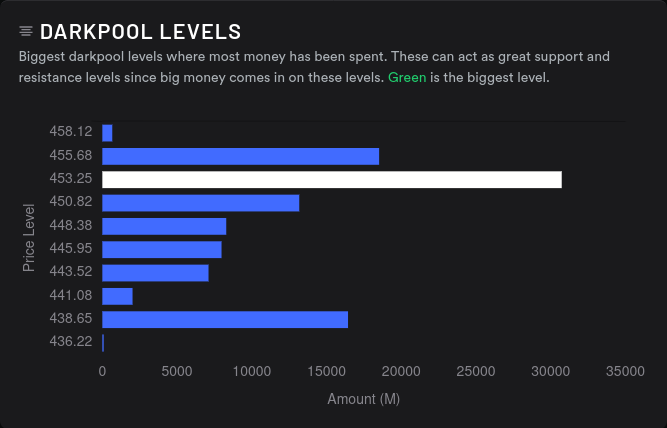
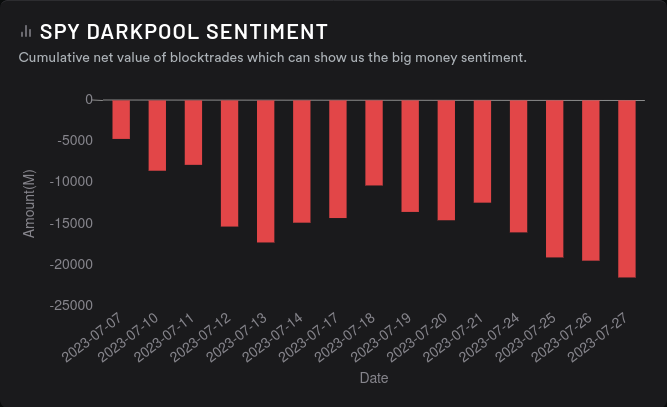
SPY's dark pool sentiment remains bearish and the highest volume shows up around $453
Big money options traders for SPY really like the $440 strike, but they're going bearish on $450 and $455:

For some reason, market participants are doing very bearish on the 9/15 expiry:

AMD
I had an amazing time trading AMD yesterday as it bounced within its trading range:
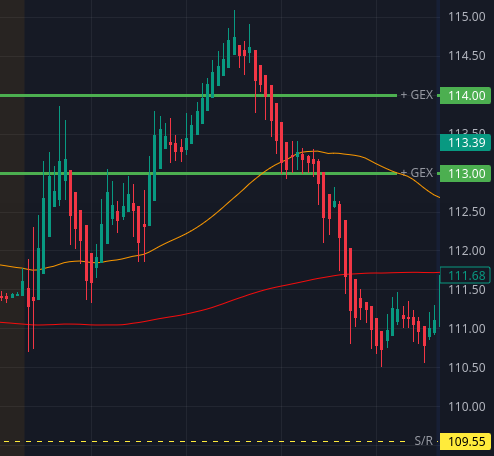
I called out the $110-$114 range yesterday and I was able to sell calls from $112-$114, sometimes for multiple trips. Earnings are rapidly approaching on 8/1, so let's see if the range is still there.
First off, AMD's aggregate GEX shows that our zone extends from $106-$113:

But let's look at 8/4 by itself:

$110 is the largest price magnet, but now it appears that $115 is the cap. I notice two things here. First, the range has widened a bit, which makes sense with earnings coming. Second, there's not a downside resistance point, which is worrisome. How about 8/11?

We get downward resistance at $110, a cap at $114, and the biggest pull is $113. How about 8/18, the monthly options expiration date?

This is what I want to see! 🥰 Downward resistance around $103, a cap around $123, with the biggest price magnets around $115 and $135. This GEX chart says "room to run" and AMD's tight trading range might loosen a bit. This is reflected in the open interest, too:

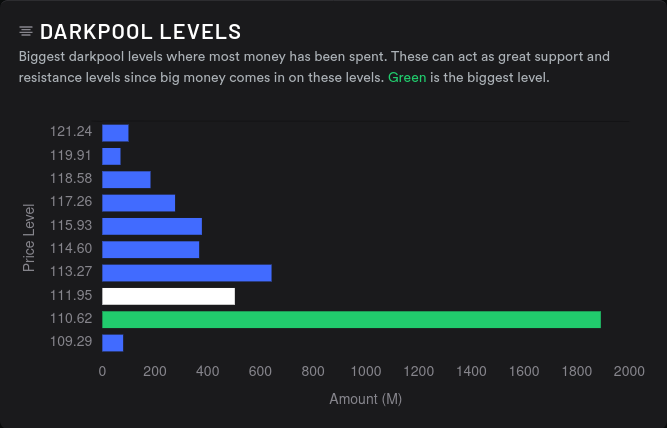
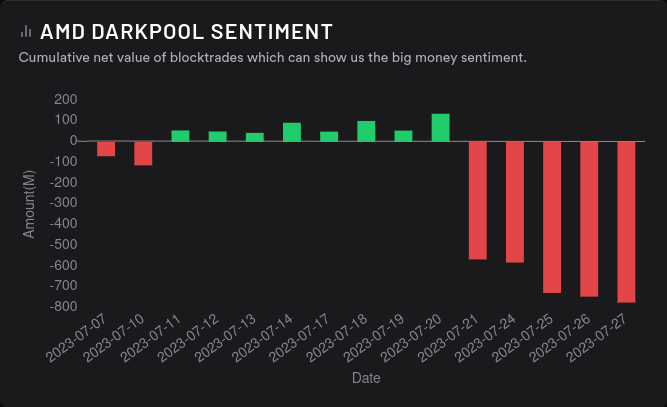
8/4 looks like a tight range trading week that is highly dependent on earnings, but there's bets on AMD making a run sometime before 8/18. AMD's dark pools are bearish, but they leveled off after the volume we had on 7/21. $110 remains a really strong level of support here:
TSLA
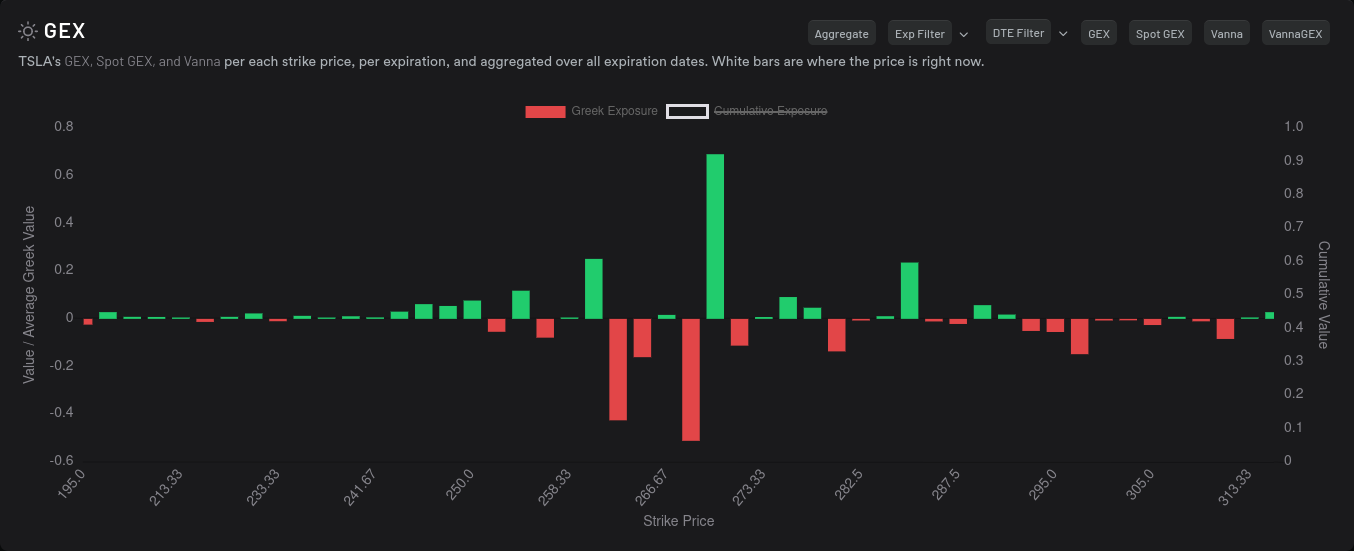
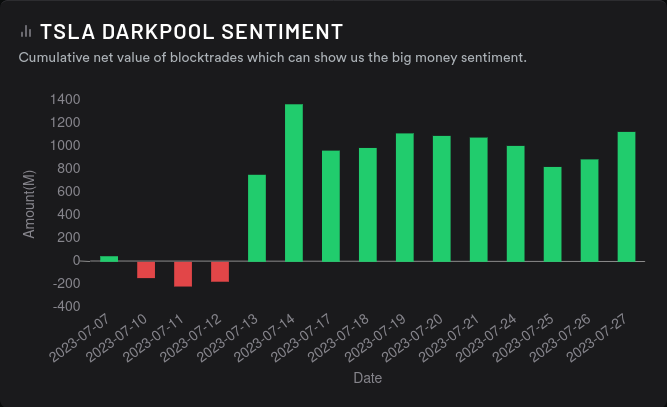
TSLA's aggregate GEX looks like we're locked into a $260-$270 range for a period of time. TSLA is SPX's fifth largest holding, so this also matches up with the trading range we saw for SPY earlier:
Big money traders are going bullish on $280 but bearish on $300, which also makes sense in the short term since we're in this tight range:
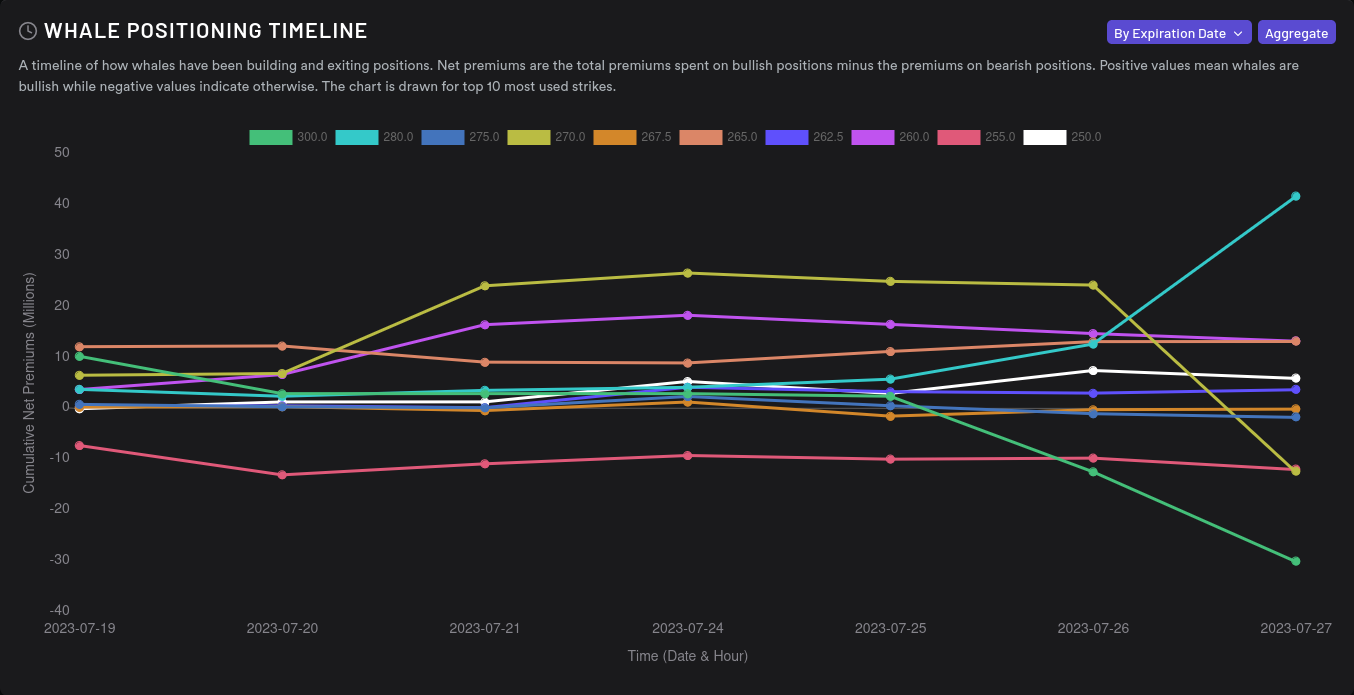
Okay, so the assumption here is a range from $260-$270 for a while, perhaps with a move to $280? Can we find more data that correlates with this?
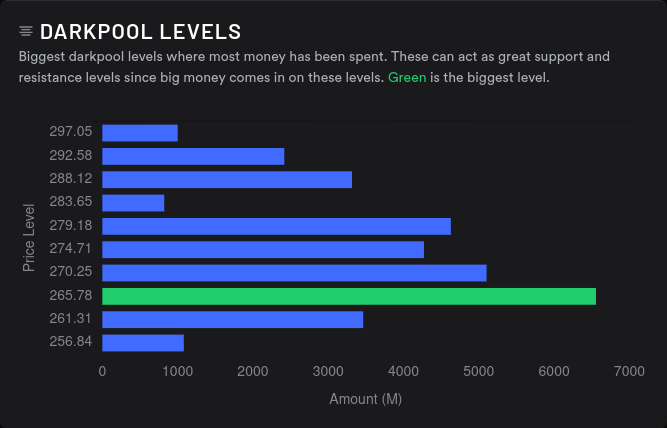
That's exactly where the highest dark pool volume sits as well. $261-$279 are our highest levels. However, that positive GEX at $270 has been incredibly strong so far. It pushed price down multiple times. If that begins to clear, we could see TSLA up to $280 at some point.
Customer OI for TSLA looks great for this week, but it looks indecisive until a slightly bearish 8/18 expiry:

Thesis
For AMD, aggressive traders might look to capitalize on the $110-$115 moves through next week. Conservative traders might look to enter trades around $105 (long) or $120 (short). As for me, I'm sitting on too many shares of AMD right now, so I might get a bit more aggressive with selling calls on the topside.
TSLA needs a way to break out of the $270 cap. There's dark pool volume there to support that, but the positive GEX at $270 has been relentless so far. If we see that level degrade, TSLA does have room to run. I plan to make bullish trades on it from $255-$260 and consider selling calls at $270 if the GEX level remains strong.
The big thing to watch here is the overall market. SPY has been running hot lately but cooled off a bit yesterday. For example, SPX had an RSI over 70% earlier this week but it sits at 63% this morning. That could give it a little room to run but it could also be a sign that buying liquidity is slowing down.
Good luck and have a great weekend! 🍀 🌴
Discussion