What to watch for as the market makes big moves

As the market heads lower, what can we watch for signs of a bounce? 🏀

Hey there. 👋 This week in the markets was absolutely wild. The SPX index is down over 9% this week and down almost 17.5% from the highs. It will pick up the "bear market" label if or when we cross through 20%. Wow. 📉
My last post was about watching for signals in the market and I'll follow up on some of those charts along with some new ones. But first:
All investments come with significant risks, including the loss of all capital. Please do your own research before investing, and never risk more than you are willing to lose. I hold no certifications or registrations with any financial entity.
Let's get into some charts.
Volatility
Volatility in the stock market is usually measured using the VIX index. The VIX uses options prices on the S&P 500 index to determine how high or low the volatility is. If traders are buying up options like crazy, especially puts, you get a supply/demand imbalance and prices go up. That gives you a higher VIX reading. When traders sell off their options contracts, you get another supply/demand imbalance and prices drop. The VIX reading drops, too.
There's another index, the VXV, which measures volatility over the next three months. It uses the same measurements as the VIX, but it looks out further into the future. You can plot VXV versus the VIX to get a better idea of whether traders see more risk happening right now, or further in the future.
Here's a weekly VXV:VIX relative chart since about 2017:
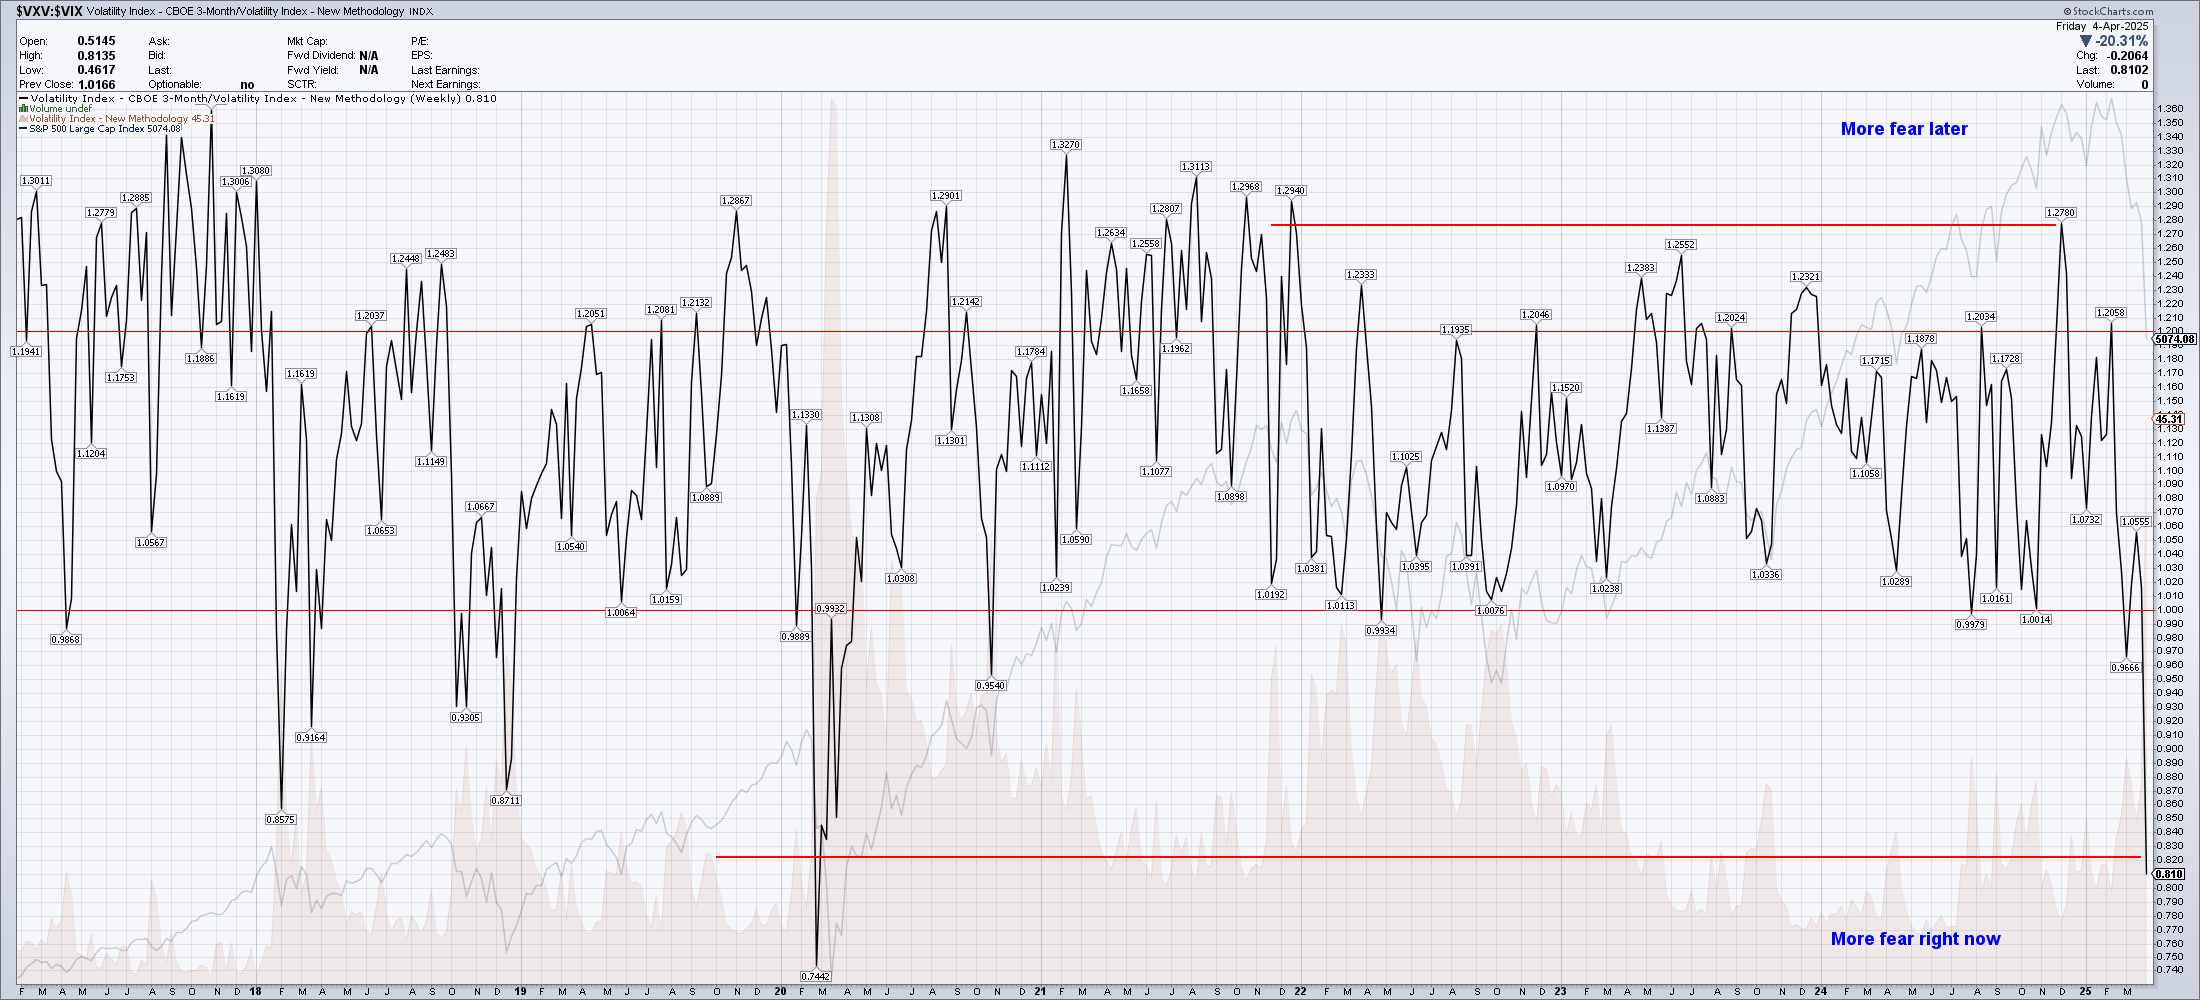
When this chart moves up above 1, it suggests that traders see more risk in the future and less risk right now. The market is normally in this state because there are a lot more crazy things that can happen in the world over 90 days than in just 30 days. However, when the chart creeps below 1, traders are worried much more about here and now rather than what comes later.
The reading sits at 0.81 as of this afternoon and that's lower than at any point except for the COVID drop. What does this tell us? Traders are much more worried about things happening right now. This forces market makers to hedge more aggressively and margin requirements for traders increase. This can force additional selling in the market and we saw plenty of that over the past few days.
Moving averages
One of my trading rules is to avoid stocks which are trading below the 200 day moving average. If they're strong enough and getting enough attention, they should be above a rising 200 day moving average. We can examine the market broadly by looking at how stocks in each index are doing relative to their 200 day moving averages.
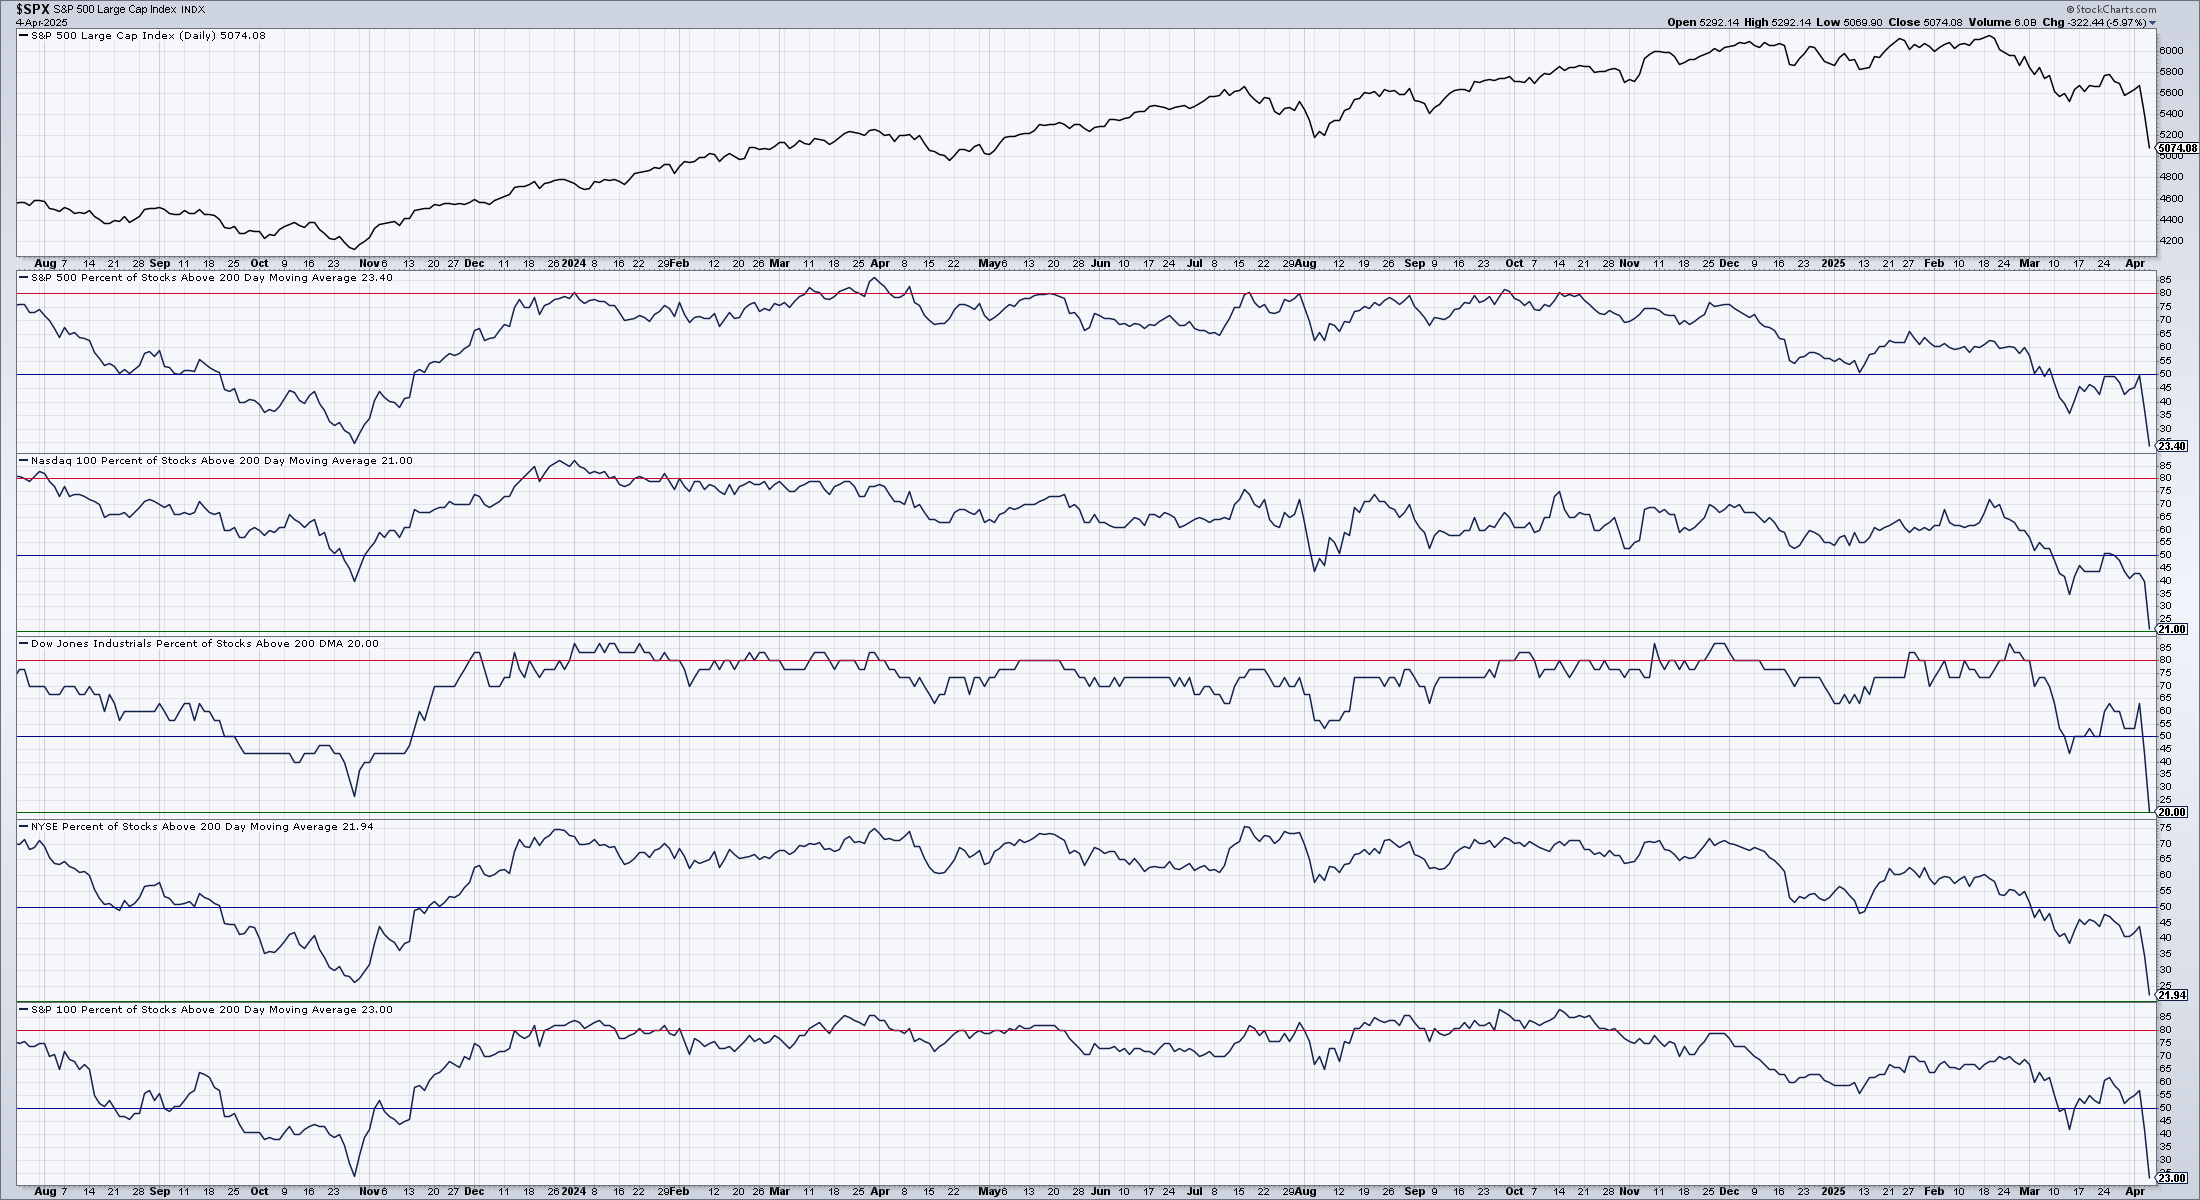
Ouch. In each index shown above, less than 25% of the stocks in the index are above their 200 day moving average. It's rare to get this low across all of these indices. This is lower than the values in October 2023 when the big rally began.
Correlations
Correlations between two charts are high if the prices are moving together. If the prices move in opposite directions, correlations are very low. Here's a chart of SPY with correlations to various other charts provided below:
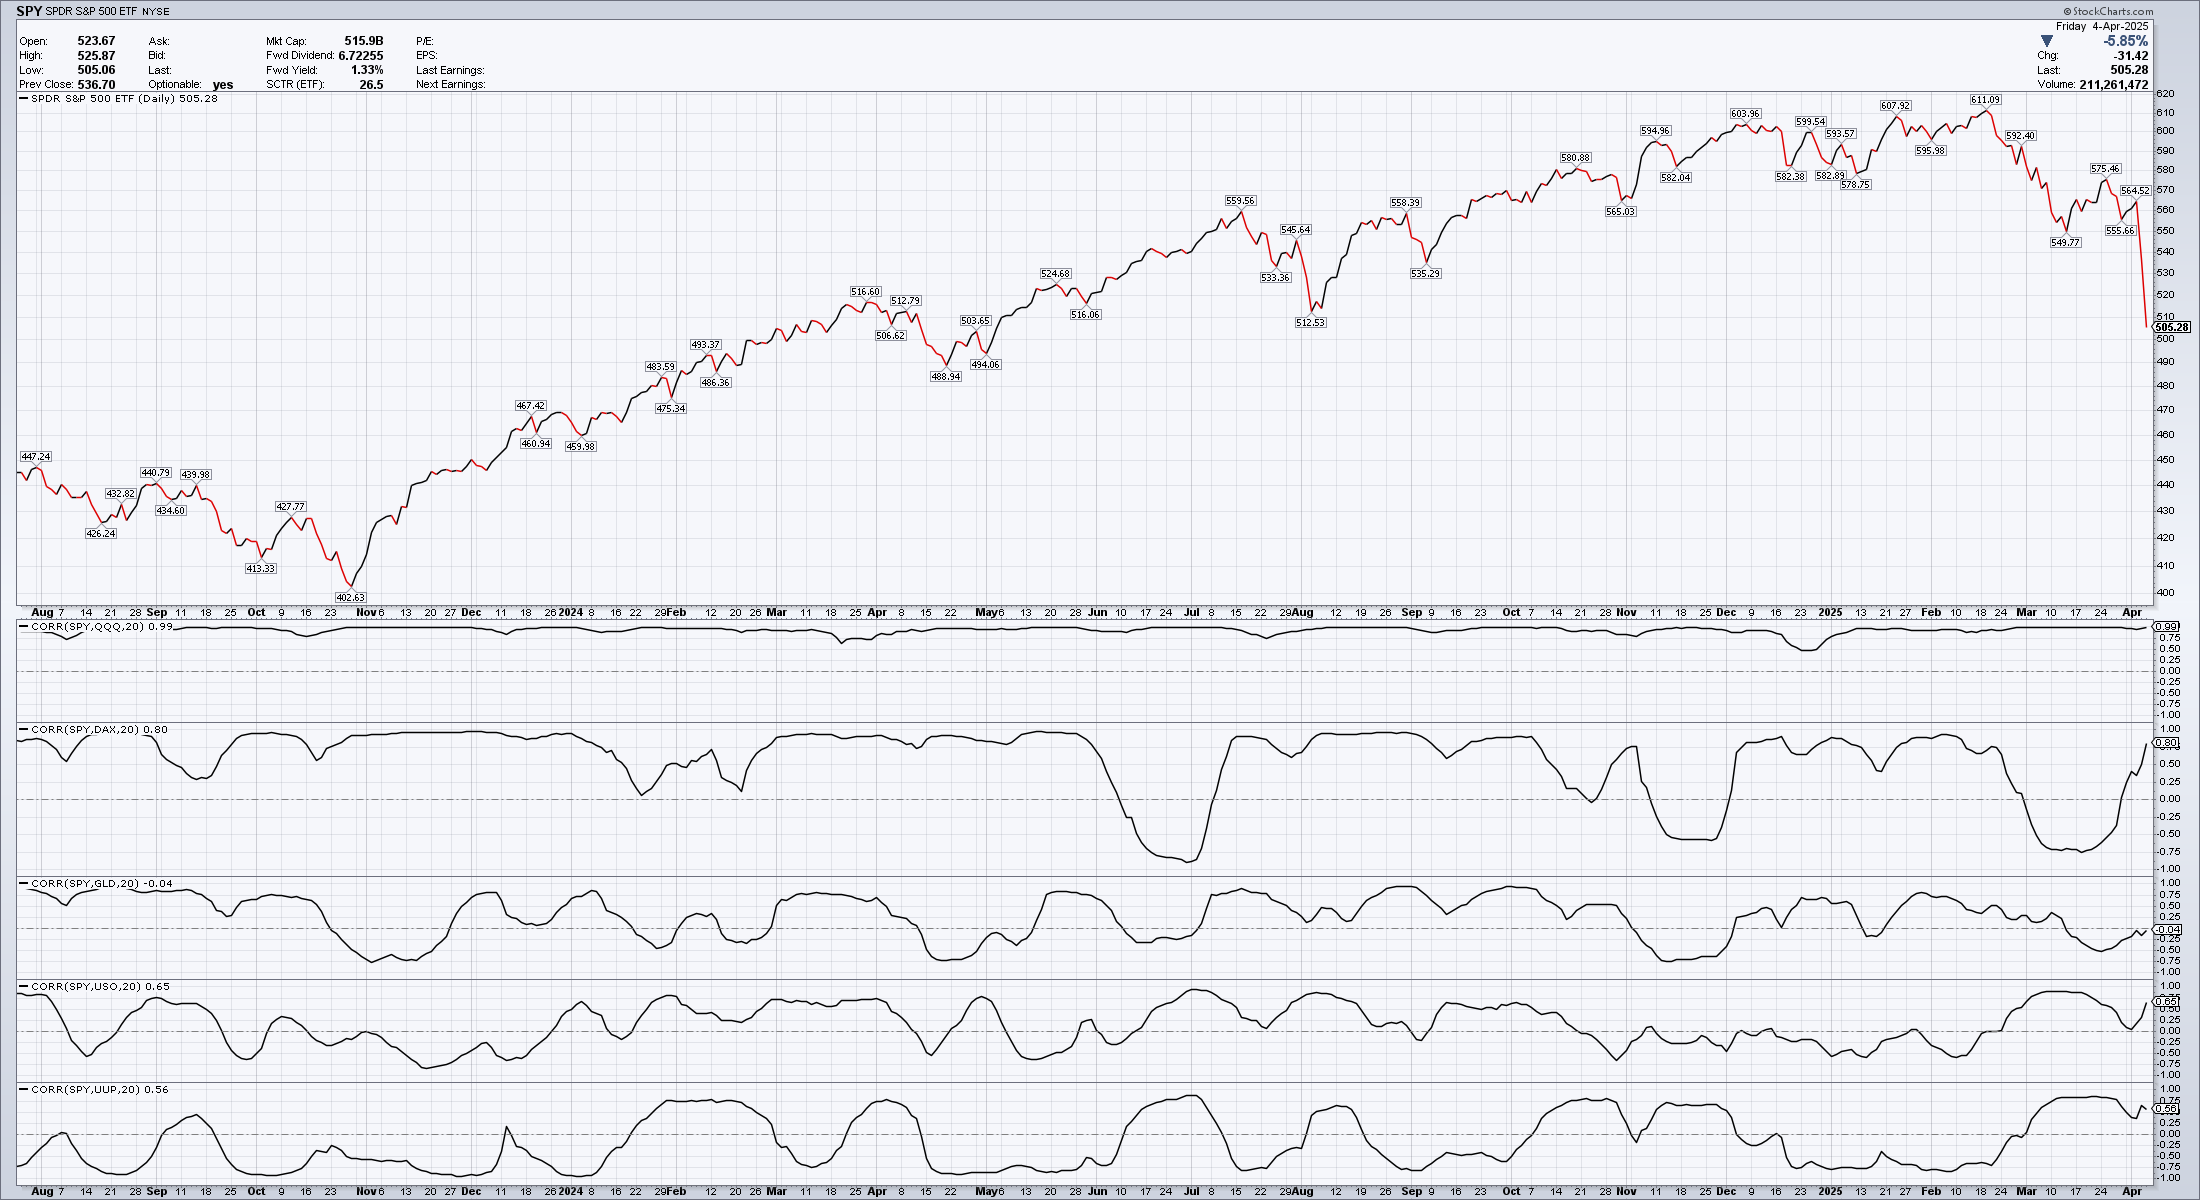
Notice how when the drop first began, the DAX (German market) was still climbing and the correlation ran very low, almost to -0.75. However, the DAX started falling this week and it correlated well with SPY. USO (oil ETF) and UUP (US dollar ETF) are both fairly correlated with SPY's movement as well.
This leads me to think that traders are betting on an economic downturn in the US and possibly abroad. In addition, there might be an expectation that oil demand will drop soon during an economic downturn and they're getting positioned early.
High yield bonds vs Treasuries
Another thing to look for is the relationship between riskier high yield bonds and low risk treasuries. When times are good and risk seems low, traders will usually reach for more high yield bonds (bonds issued by companies with a lower credit rating) than treasuries since the reward to risk ratio is better for high yield bonds.
However, when traders worry about companies being able to pay their bills, they flee high yield bonds and go to treasury bills instead. We can plot the unadjusted (no dividends included) prices for both of these togther:
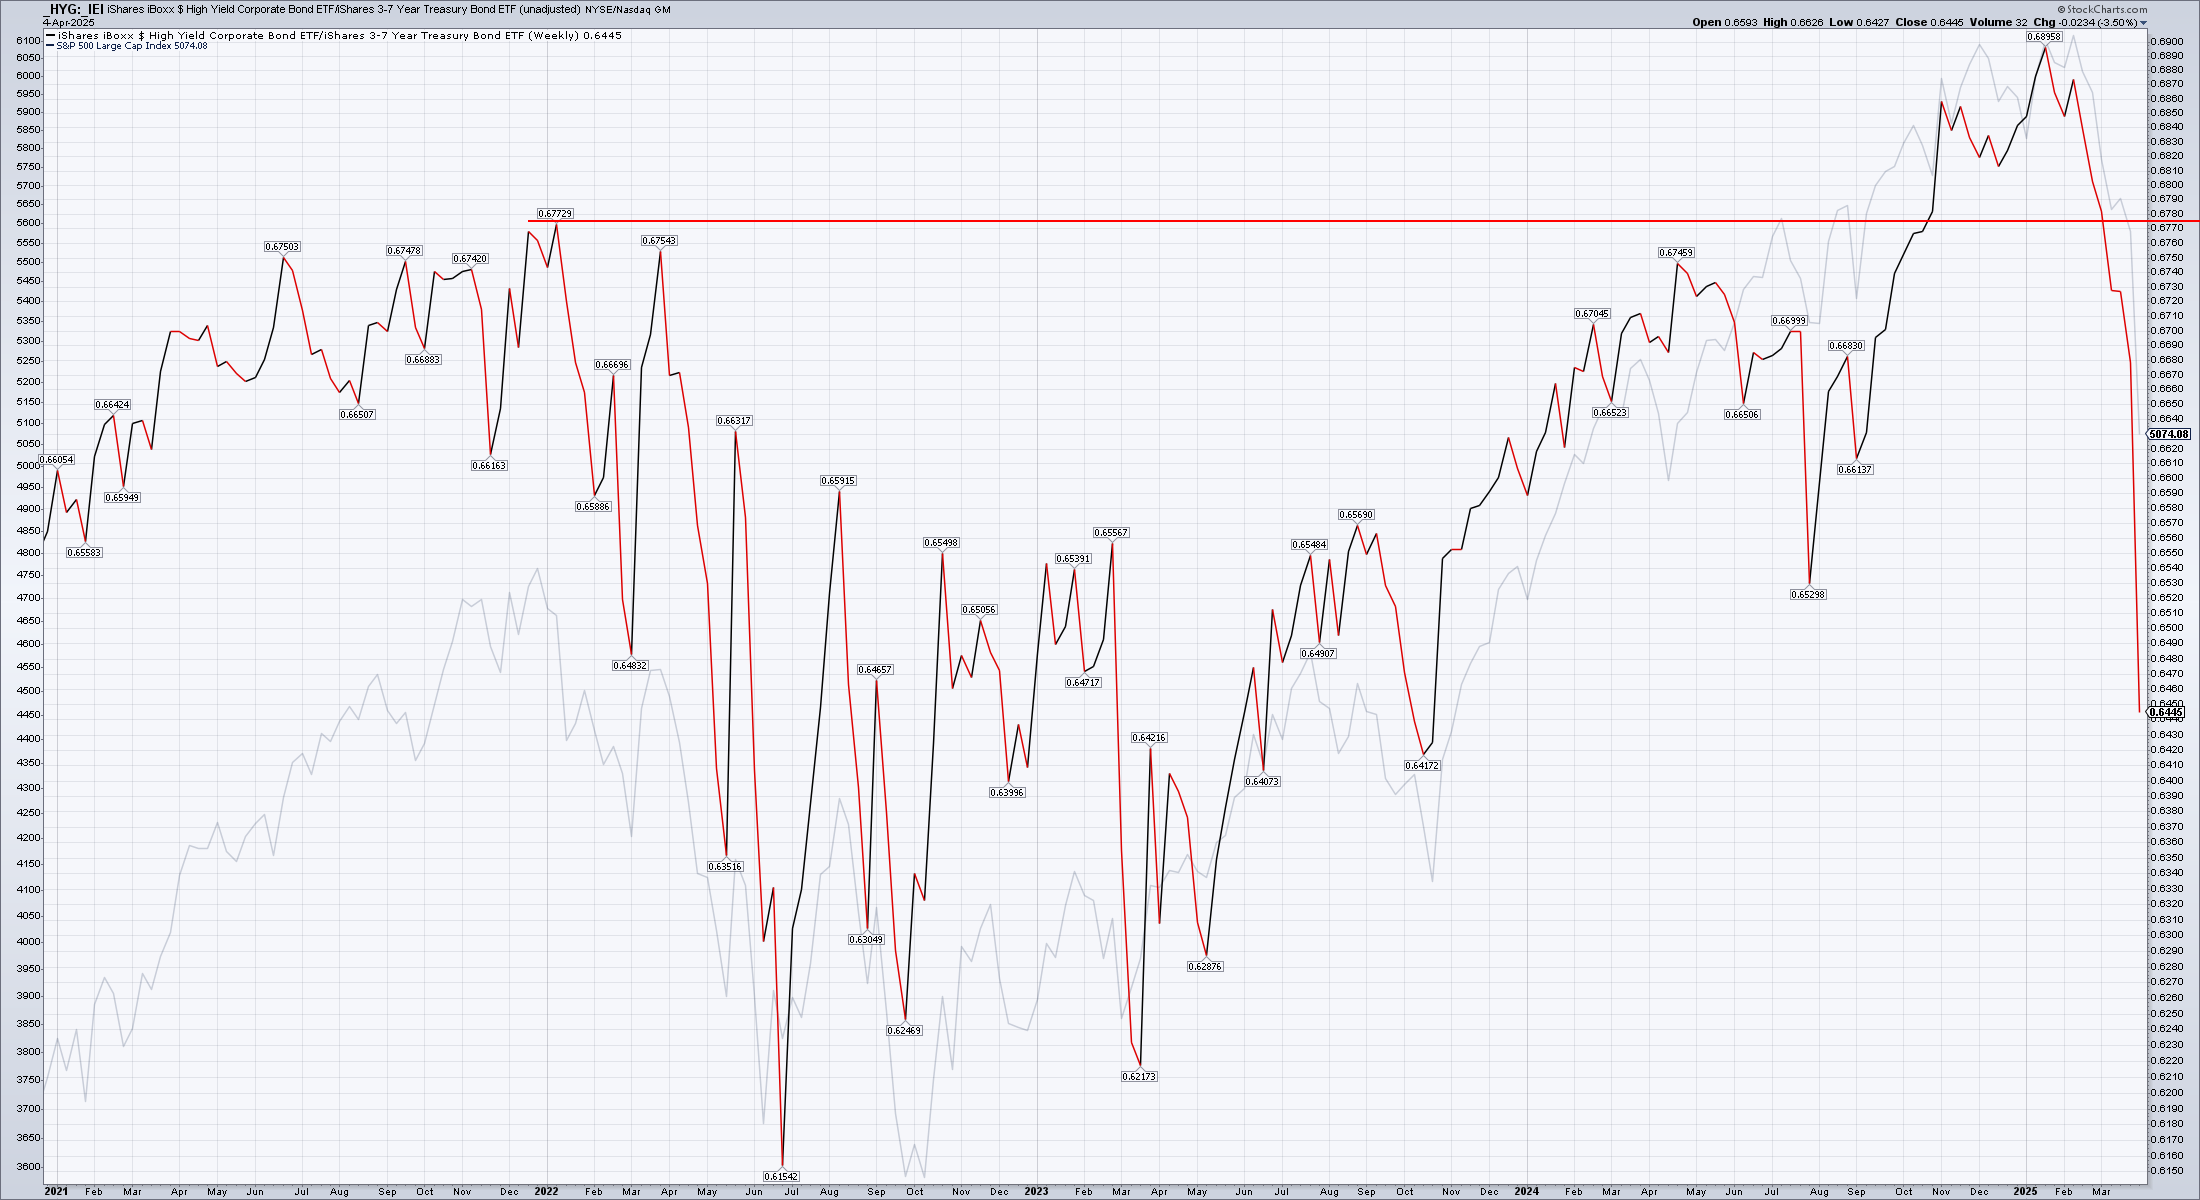
Notice how traders went for more high yield bonds in March 2023 and kept increasing those numbers until December 2024. That rally quickly fizzled as traders hit the exits and snatched up more treasury bills in 2025. This is a signal that traders are worried about potential defaults and getting paid back on their high yield bonds.
That's not a great sign of economic health.
Technology
The technology sector's strength relative to the rest of the market sits at an interesting spot right now. This is the relative strength level where we got stuck in the 2021 rally:
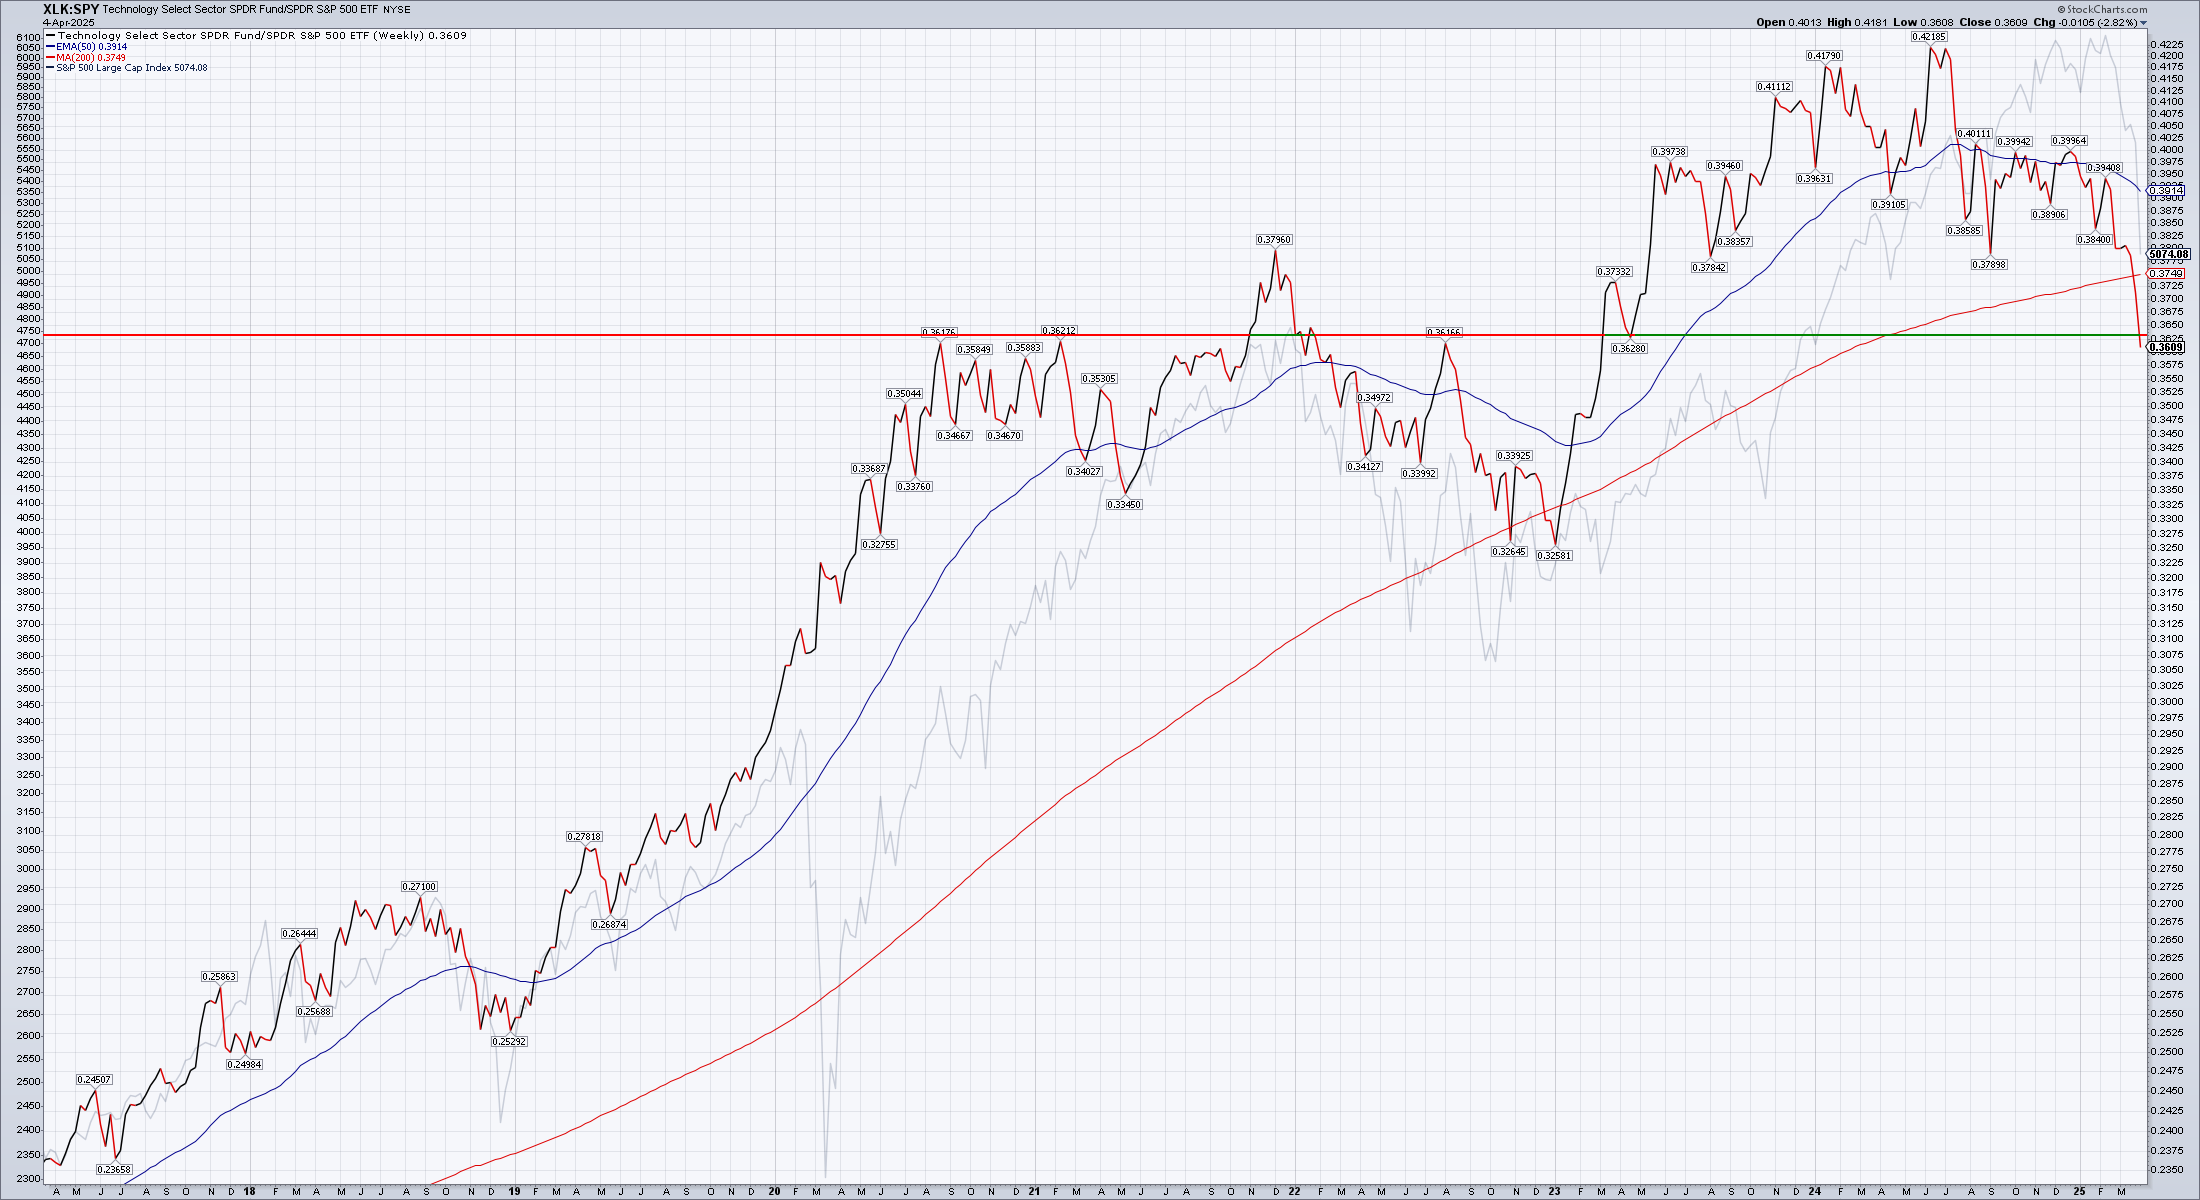
This ratio hopped over the resistance line in late 2021 as the last hurrah of the rally befoew falling off during 2022's bear market. It made a double bottom in late 2022 and hopped over the resistance line in early 2023 that kicked off a rally.
Now the ratio sits below the level of the 2021 rally top. This would be a great spot for a bounce, but I'm not sure whether we will get it.
Summary
There are plenty of things that don't look great right now for the broader economy and market. However, the S&P 500 is very near the August 2024 low. If we were to see some kind of bounce – whether it's a sustained rally or simply a bear market rally – it makes sense that it would show up somewhere around the current price. August's low in SPY was $505.48 and today's SPY close was $505.28.
Prices often come down and retest old levels, much like August came down to test a low from May 2024.
I've made a couple of very small buys today in SOXL and TGT, but again, they are very small. SOXX seems to be at a decent support area and SOXL should do well if we catch a bounce here. I don't plan to hold SOXL long term. TGT has some massive trades around $100-$104 and if it retakes those levels, there's a chance it could run higher.
Good luck to all of you and have a great weekend! 🍀 🌴
Discussion