What's new with AMD at the end of 2024?
There's a lot of buzz in the market about AMD as we wrap up 2024, but why? Let's find out why its current level is quite interesting. 🔍

The year is almost over and semiconductors have been looking great for most of the year. The SMH ETF is up over 40% in 2024 and the industry leader, NVDA, is up over 175% on the year. That's incredible! 🤯
There was a lot of buzz this week around AMD. But why? That's where we're going in this post!
All investments come with significant risks, including the loss of all capital. Please do your own research before investing, and never risk more than you are willing to lose. I hold no certifications or registrations with any financial entity.
I have open trades on AMD as of today. See the disclaimer at the end for details.
Daily AMD chart
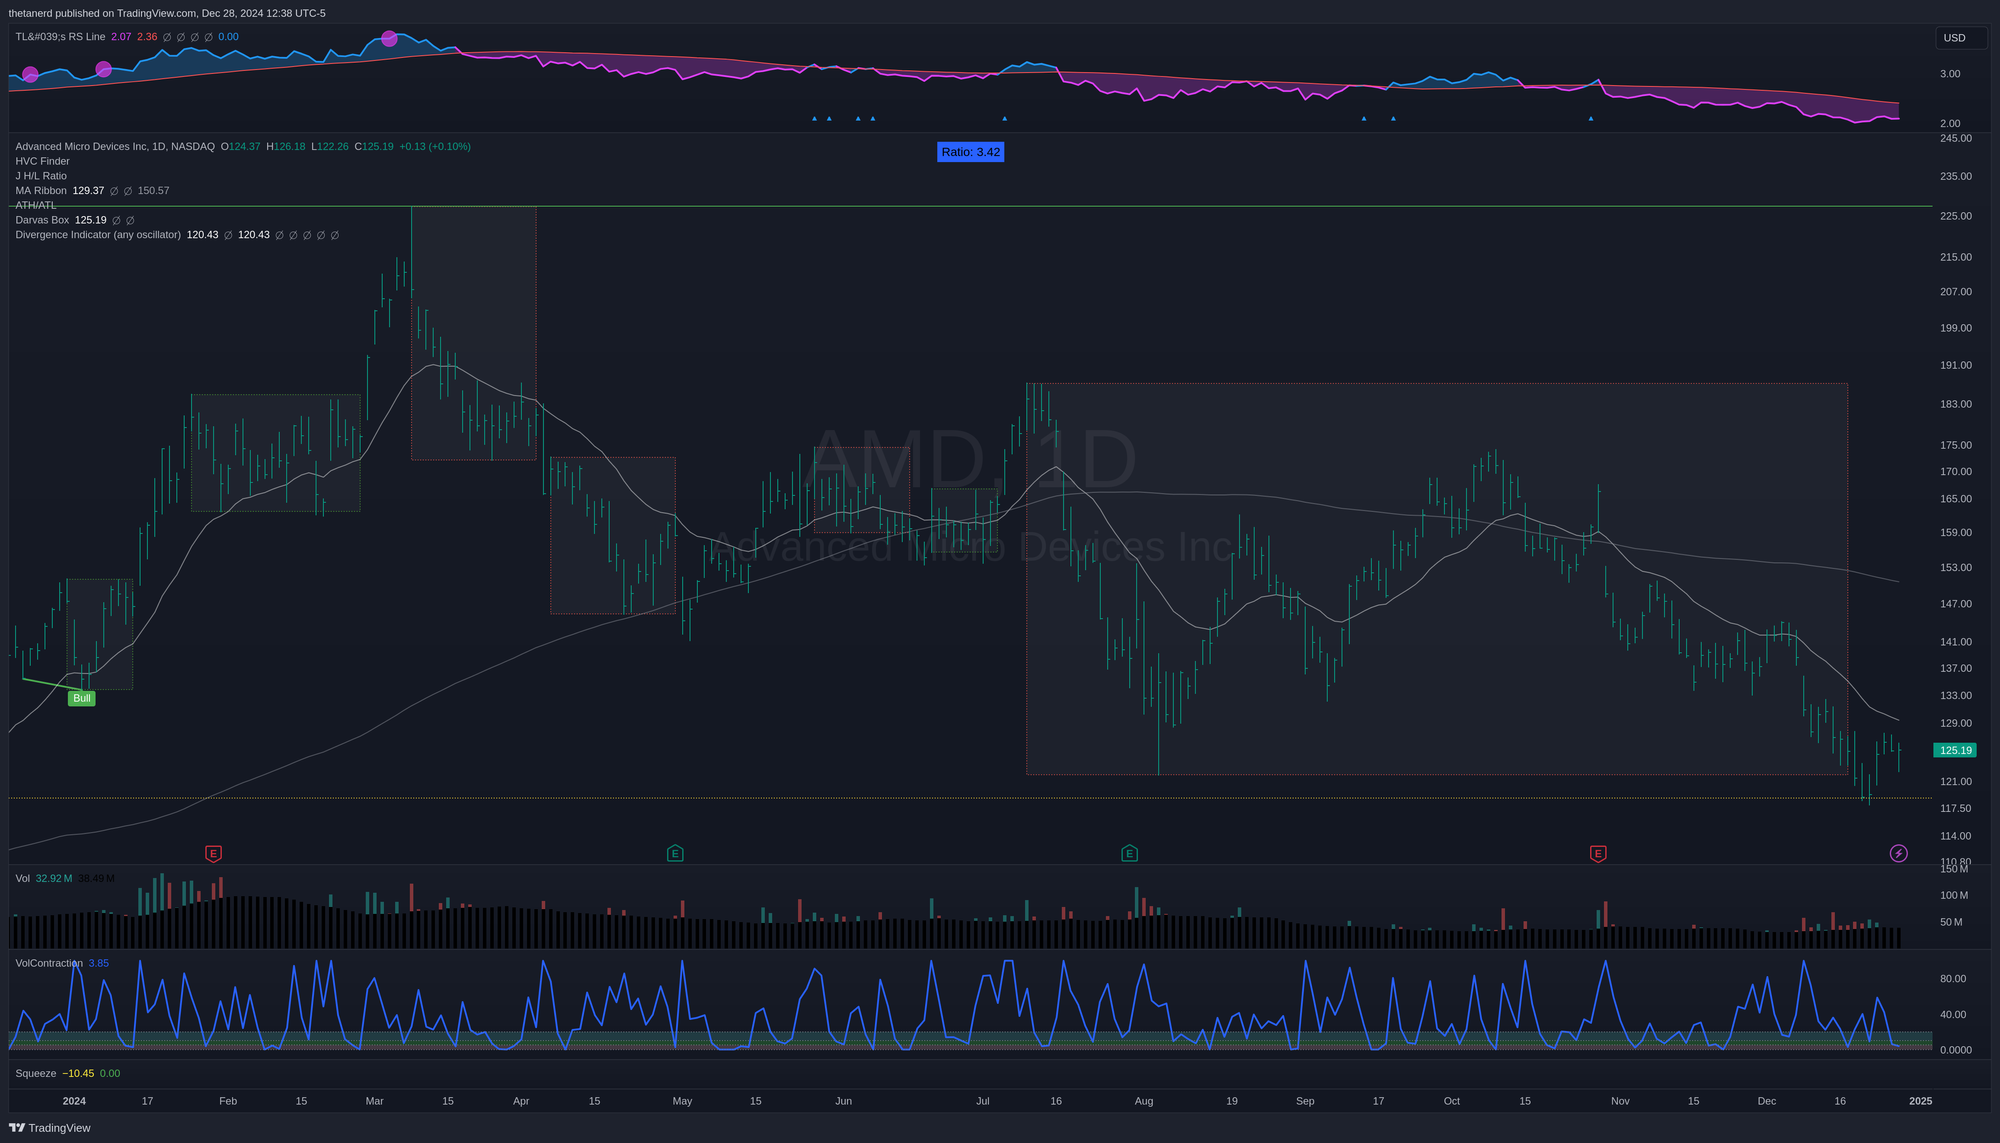
Let's start with a daily AMD chart with some indicators applied.
Starting at the top, AMD's relative strength to SPX (the S&P 500 index) remains below the moving average. That's a sign of weakness, but notice that AMD recently made a higher low relative to SPX. That's a positive development for traders who are looking for a turnaround in AMD's drift down from the lower $200s in March.
Moving into the price chart, the two moving averages shown are the 21 EMA and the 150 MA (30 weeks). The moving averages are stacked in reverse and both are tilted down. That's not a bullish sign.
The large boxes are Darvas Boxes and come from Nicolas Darvas. The boxes begin with a local high and then they grow downwards until a low is reached. From there, you wait to see whether price comes out of the top or bottom of the box. Price recently broke down below the lower end of the box and that's a bearish sign.

However, you can see on the chart that the price landed on a yellow dashed line. That's a high volume close from 2021 (see my last post about high volume closes) around $118.77. That's likely an area where large institutions and funds were making trades. Notice how the price bounced around that level and the average volume increased. Something has made traders much more interested in AMD lately.
Are they going long on AMD, hoping for a bounce? Are they going short, betting that AMD is going lower? Are they betting on a bullish turn in semiconductors in general?
Let's see if we can find more details to support a hypothesis.
AMD vs semiconductors in general
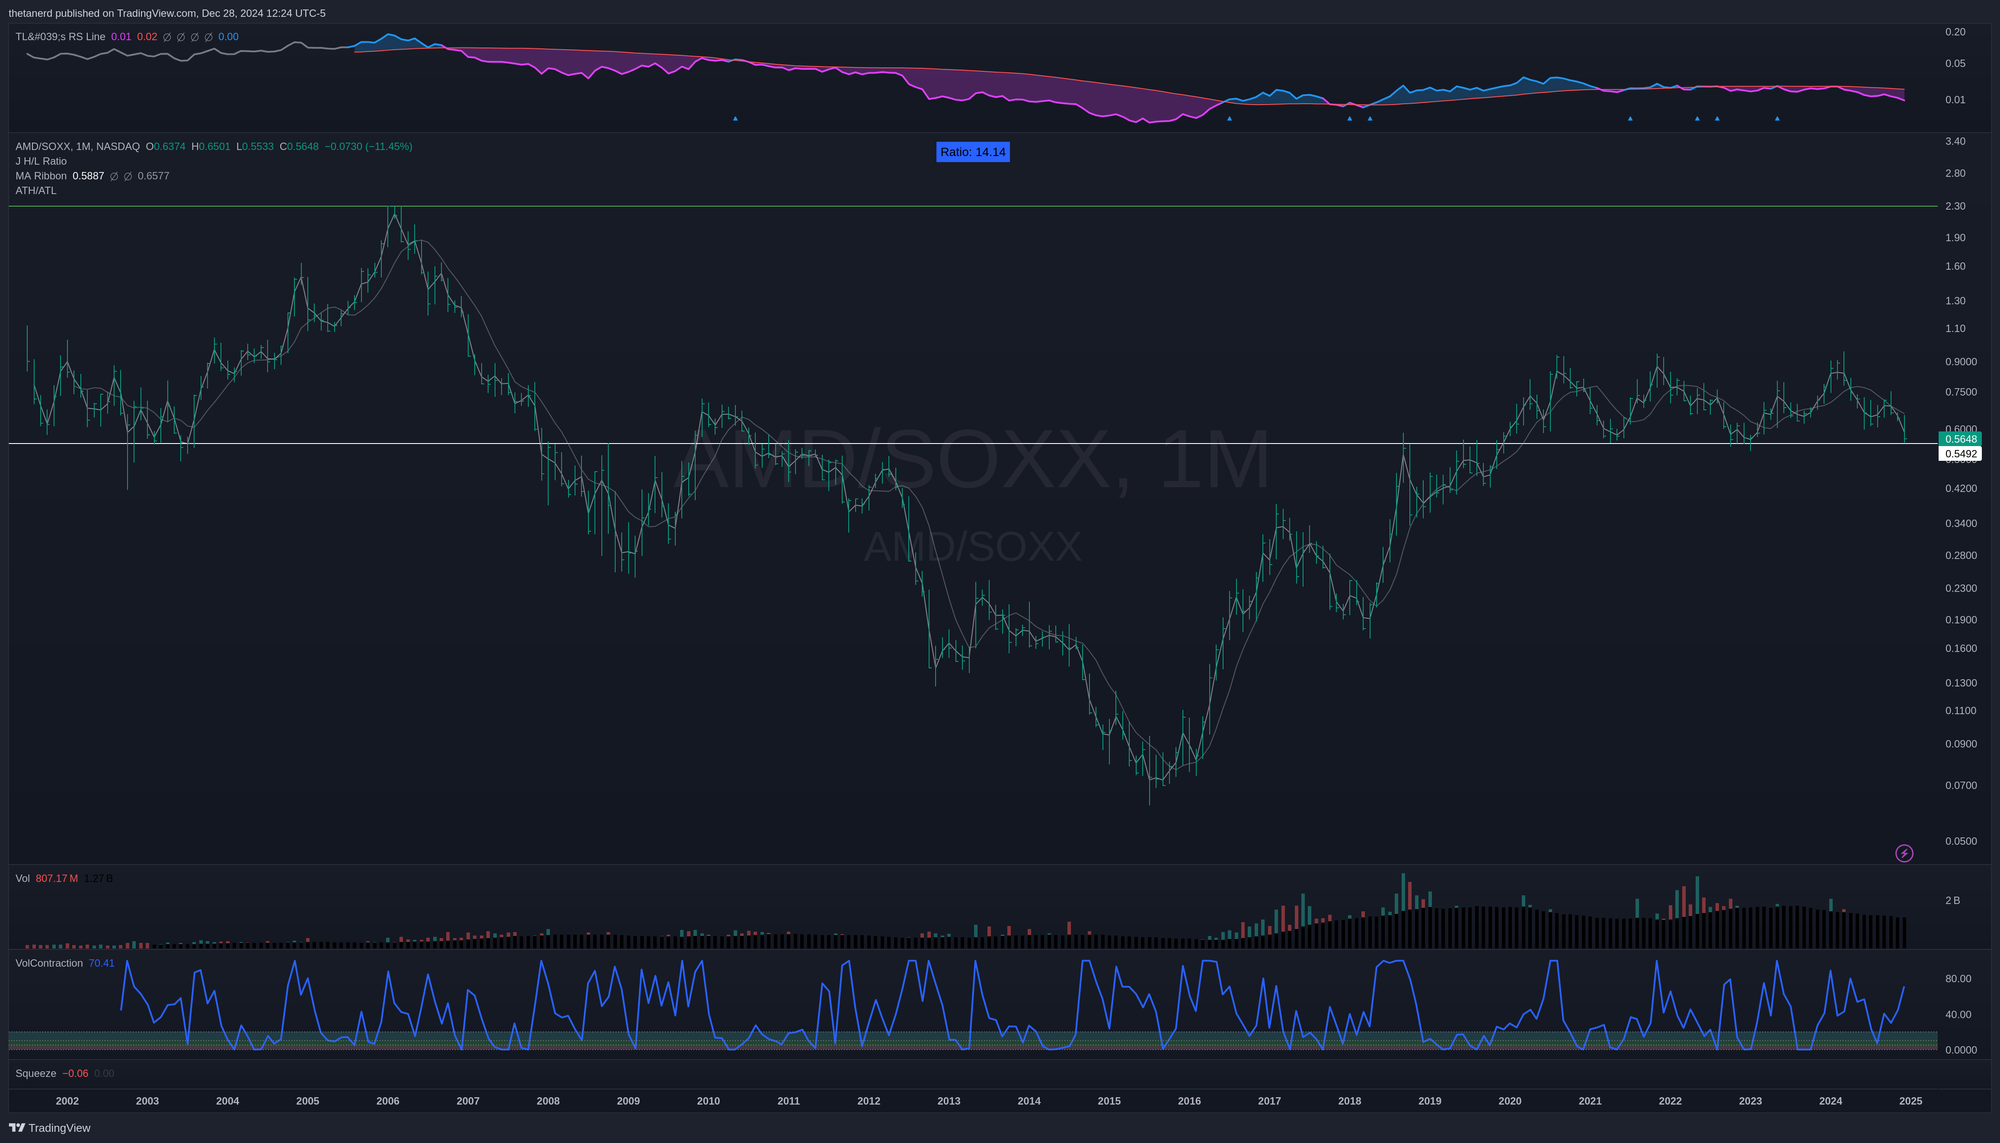
Now we can take AMD's price and divide it by the price of SOXX, a large semiconductor ETF:

This level looks even more interesting now. AMD bounced on this level way back in 2003 before falling through it with multiple retests from below from 2008 to 2012. It came back up to retest it in late 2018 before finally getting over it in 2020.
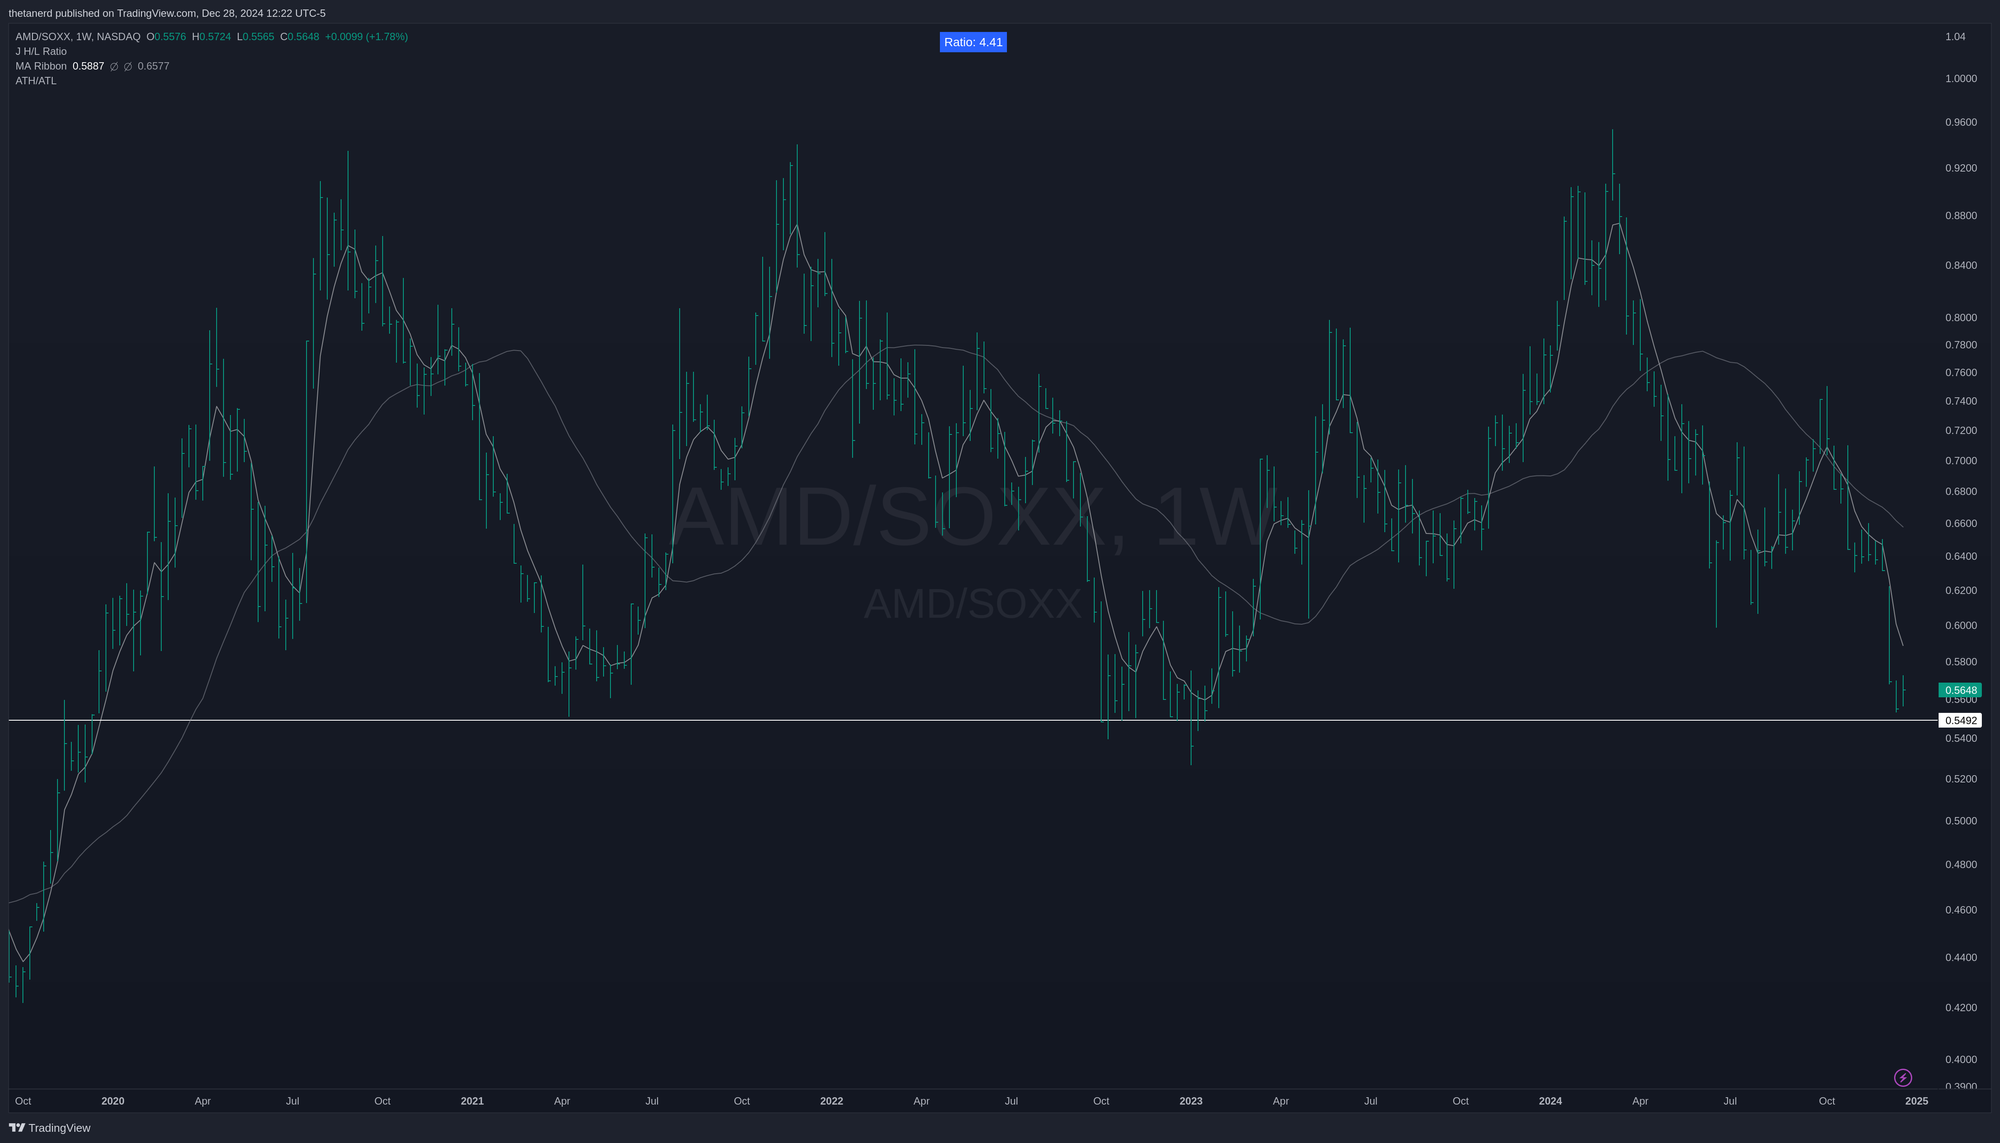
Let's switch to a weekly and zoom in on this relationship a bit more:

AMD has revisited this level three times in the last several years and has bounced up from it each time. Some might look at this chart and see a head and shoulders pattern. I can definitely see that, but it's a little rough and these can be challenging to pick out on a relative chart.
Thesis
Here's what I'm thinking about:
- AMD has retraced $109.40 from the March highs and that's about 48%. There's no reason it can't retrace further, but that's a substantial correction. This might be a point where shorts begin to look for other targets, especially as AMD retests some areas of significant strength from the past.
- AMD returned to a very high volume close from 2021 around $119 where the volume was over 350% above the average volume. That's significant because it is an area where institutions were quite interested in AMD in the past.
- The relative chart of AMD to SOXX shows a significant relative strength level which has been both resistance and support in the past.
- AMD's volatility (in price action, not implied volatility from the options market) has contracted almost to the maximum. It sits at 3.85 right now and anything below 20 is good for an entry. However, volatility contraction doesn't suggest whether the next move is up or down.
In short, AMD is at a tremendously interesting level from multiple vantage points, semiconductors have pulled into a very tight chart pattern, and AMD's shorts since March are sitting on some very nice profits. Although AMD is showing some signs of a turnaround, it's definitely a high risk play for now until we get some confirmation that AMD, or the semiconductor industry in general, is gaining some strength.
I am short several $115 puts for AMD in February, but I am watching the $118.77 level very closely for signs of weakness. If AMD breaks below that level with significant volume, institutions might know something more worrisome about AMD's prospects than I do. That would be a good time to exit the trade.
Good luck to all of you this week. I hope that 2025 is a great year for you and your family. 🍀


Discussion