Where did vanna go?

Vanna fell off 50-60% on most stocks I'm watching. What other tools do we have in the toolbox to make some good predictions? 🧰

My first observation this morning is that vanna strength fell off like a rock. Although the curves and strikes from my post yesterday haven't changed much for TSLA and AMD, the notional value for vanna has plummeted.
AMD's tallest vanna bar was around $100M but it now stands at under $40M. TSLA's tallest is below $350M. These have dropped 50-60%.
With vanna being less of a factor right now along with dwindling gamma, what else can we examine to get an idea of where the market is headed?
All investments come with significant risks, including the loss of all capital. Please do your own research before investing, and never risk more than you are willing to lose. I hold no certifications or registrations with any financial entity.
Let's dig in our toolbox and see what else we have.
VIX
Premiums on VIX shifted a bit yesterday and shifted enough to show up on the five day chart:
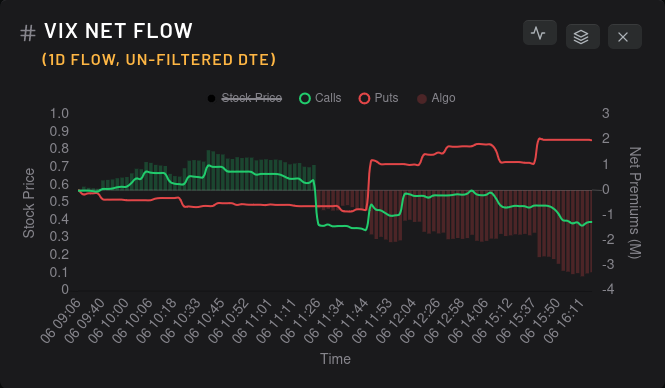
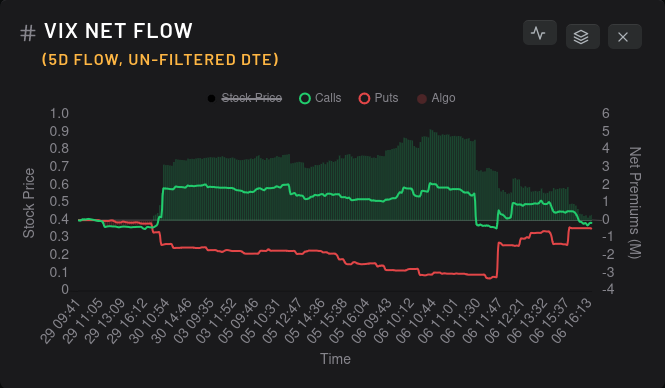
Put premiums increased and call premiums decreased. That suggests that traders are much less bullish on increasing volatility right now and the five day chart shows that we've almost hit equilibrium on options flow for now.
I take this as a generally bullish sign for the market.
TSLA
TSLA's bullish vanna curve has weakened significantly but it still should add some buying pressure from dealers as volatility comes down. TSLA earnings are coming up on 7/19 so I doubt we will see any significant reductions in volatility before then.
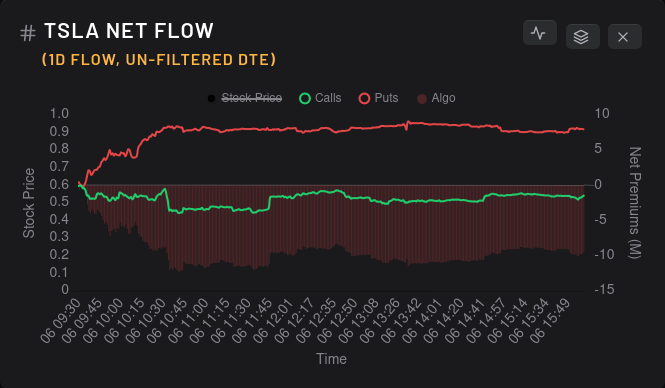
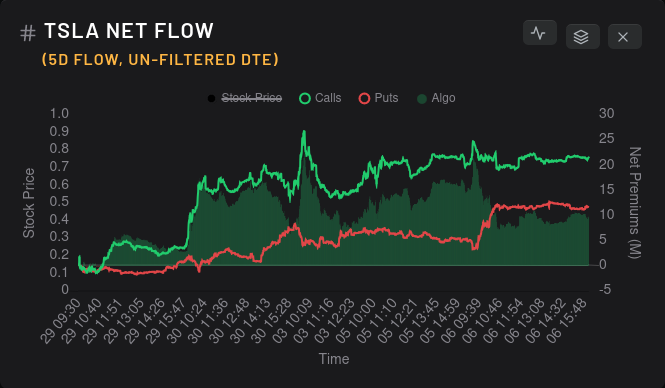
Options flow for TSLA shows increased put buying (possibly buying back sold puts) and call volume hasn't moved much.

Looking at raw dealer greeks for TSLA, we see that dealers are short and that implies that market participants are leaning bullish with their options contracts. However, TSLA backtests best with a 15 day momentum applied:

I don't like this. Buying TSLA when the 15 day momentum is green does not backtest well at all. Sure, past performance doesn't dictate future performance, but this is not a bullish sign for me. How about digging into dealer open interest per expiration?
The first thing I notice here is the x-axis. There's not much dealer deltas there. This makes it really difficult to predict price action because nobody has really made up their mind yet on where the price might go. This x-axis was up in the 5-8M range back in April and May! The September expiration looks pretty good, but then again, the magnitude is rather small.
AMD
How has AMD's flow been lately?
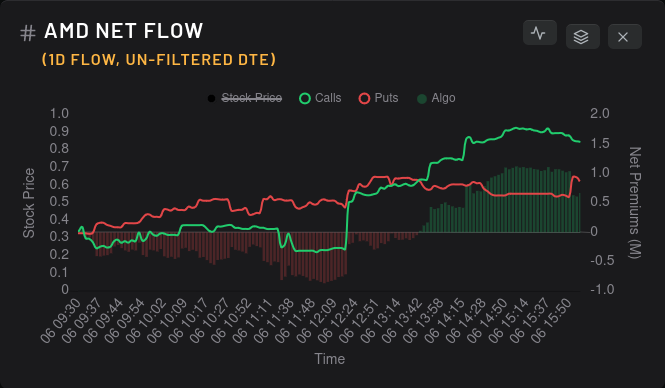
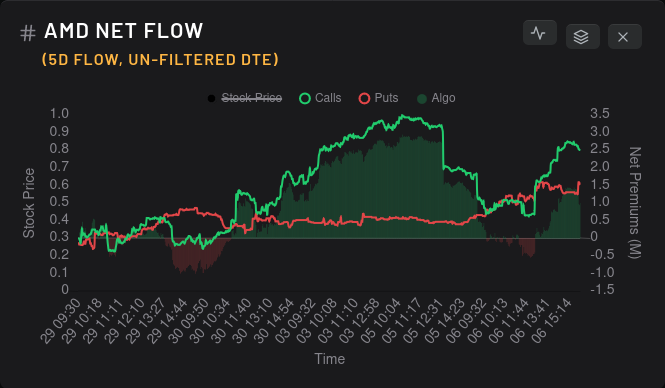
AMD had some mixed flows yesterday and lost steam on the bullish push over the last five days. Its vanna curve is slightly less bullish than TSLA's but it's suffering from the same vanna weakness.
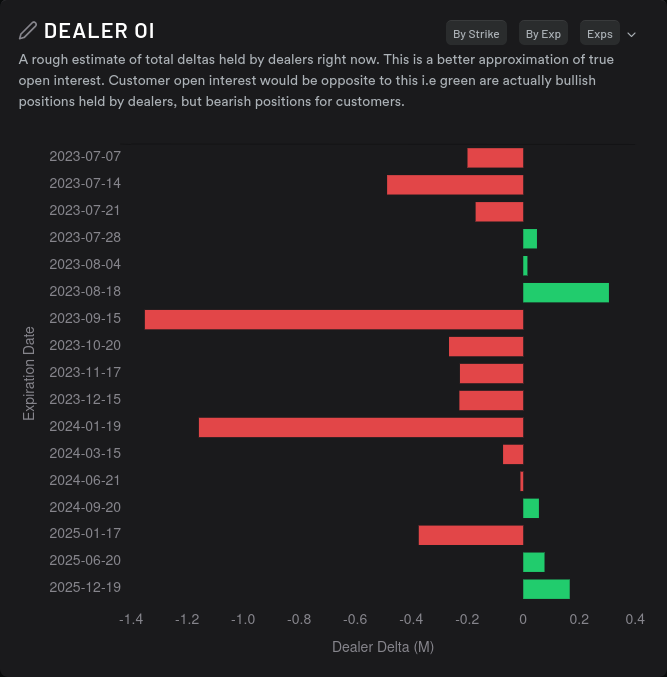
How about dealer greeks?

Slightly short doesn't look great. AMD is also another stock that backtests really well on a 15 day momentum basis, so let's have a look at that:

Ouch. This is not a good setup for bullish traders. Buying and holding AMD since July 2021 gives a 19.8% return but buying AMD when the 15 day momentum is red and selling when it's green returned over 130%:

AMD's price distribution is also showing potential for a downward move of up to 2.4%:

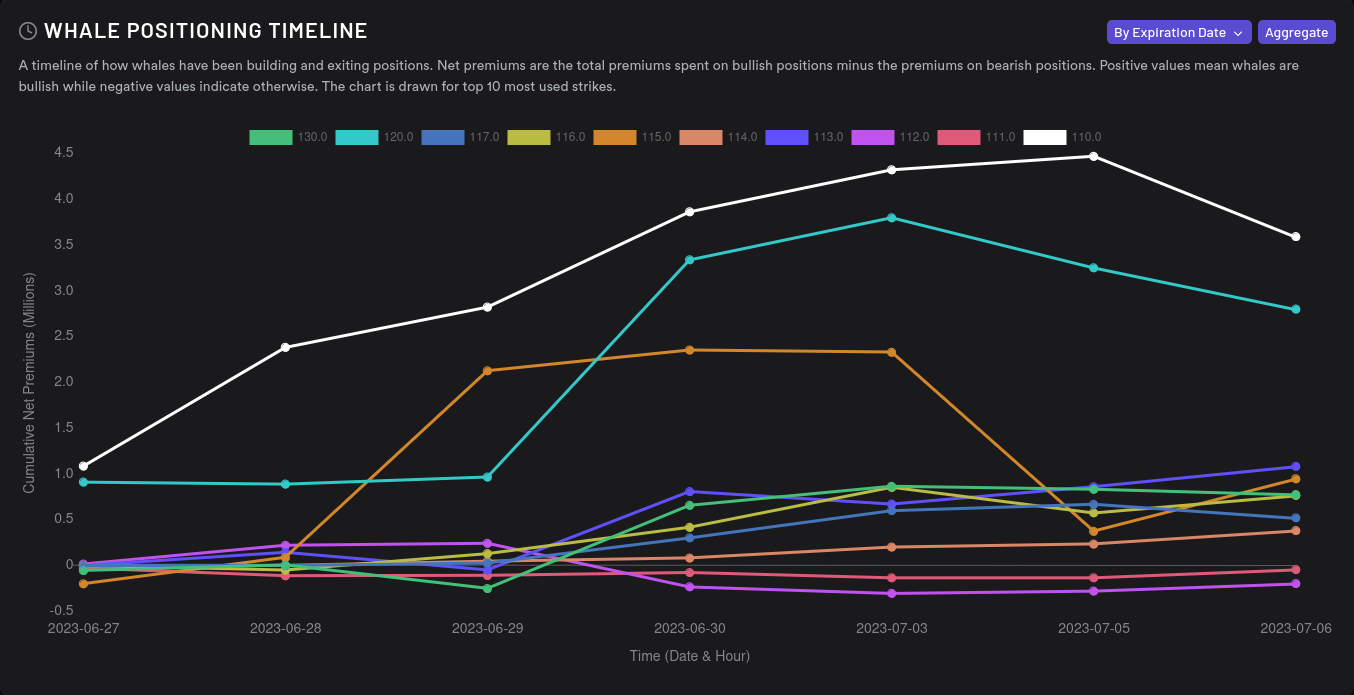
Big options traders are pulling back on their $110 and $120 bets, too:
Thesis
In addition to the flow data shown above, technical analysis indicators are showing some weakness, especially in the short term. AMD's indicators are weakening faster than TSLA's, but it's something worth noting. The Fed should let us know about interest rates on July 26th and there's plenty of focus on that.
My deltas on AMD and TSLA are very bullish right now and I'm looking for opportunities to sell some covered calls for the 7/21 expiration. I've made decent profits on both and I'd be willing to sell shares if the price reaches some of my targets.
For AMD, I'm looking to sell calls in the $118-$125 range. We know there's a liqudity problem at $130 but we recently failed to clear the $118-$120 zone that served as support back in June.
For TSLA, we have liquidity issues around $276. Sure, we cleared above there this week, but we found ourselves right back there yesterday. That also corresponds to about 70% RSI. As a reminder, the 50 and 200 day moving averages sit at $210 and $194 respectively. I'm looking at selling TSLA calls around $280-$285.
Good luck out there! 🍀
Discussion