Where is the risk on TSLA?

TSLA looks to be taking the ride down to some levels we haven't seen in a while. Is there more risk to the upside or the downside in the coming weeks? 🤔

Good morning and happy Monday! TSLA is having a rough time lately after a challenging earnings call and an array of EV competitors approaching it from many directions. Add on some negative sentiment around consumers for EVs and the fear quickly shows up on the stock chart.
All investments come with significant risks, including the loss of all capital. Please do your own research before investing, and never risk more than you are willing to lose. I hold no certifications or registrations with any financial entity.
Let's get a look at TSLA to see if there's more risk to the upside or the downside. 📊
Performance
There was once a time where TSLA was the stock market darling, but it's difficult to find a good time frame for it lately. TSLA is red on all time frames except the one year:
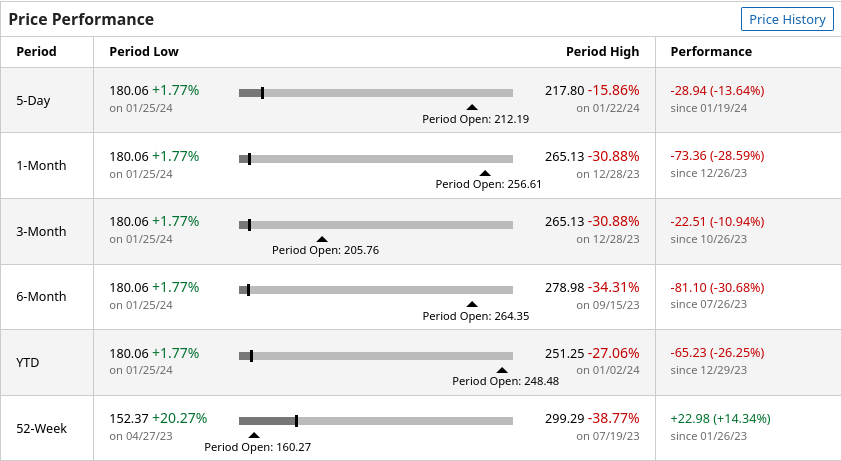
If you purchased TSLA a year ago, you'd still be up 14%, but you would have watched the price run from $101 to $299, and then back down to the $180s.
Long term
I've been watching a steady downwards trend on TSLA since hitting the highs around $414.50 in November 2021. Things became ugly at the beginning of 2023 with a drop below $102. That was followed by another three attempts to break the trend line. All three of those attempts failed.
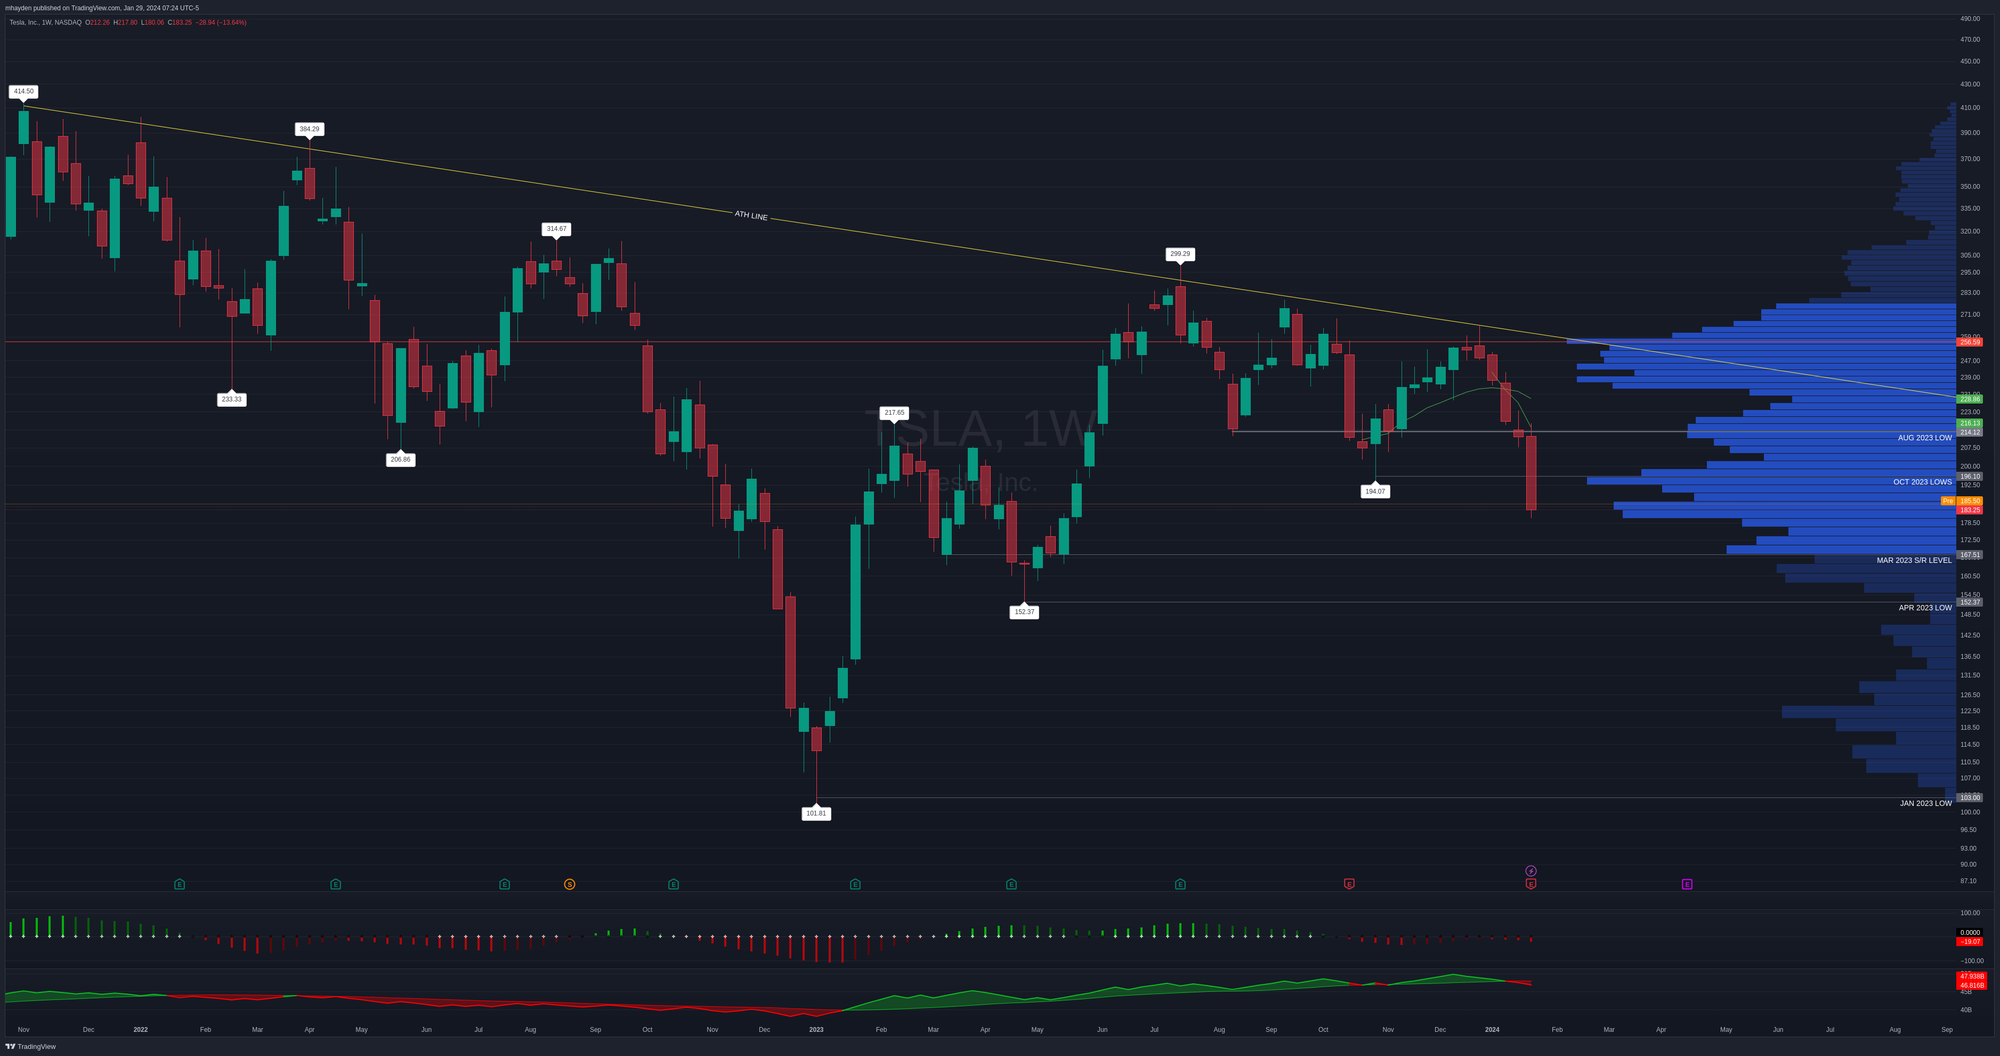
Now TSLA seems to be running away from the trend line quickly with volume supporting the move. However, since the all time high, the highest volume area is still at $256.59. The volume profile suggests that a drop below $180 doesn't have much volume to slow the price as it moves down.
There are some support levels around $167 and $152. If we lose those, we might be looking at $122 or $102 as the next stops. That would be an incredible drop for TSLA, but then again, TSLA has had a meteoric rise in various places.
Shorter term
I'll drop down to a daily chart here since the October 2023 earnings call. I've added green volume weighted average price (VWAP) lines since that earnings call, the most recent one, and the beginning of 2024.
First off, TSLA has fallen through all of the VWAP lines I can draw. That suggests that those people who were holding TSLA on those dates are seeing losses in their accounts. It's also a sign of significant weakness for me.
The volume profile suggests that $235 is the highest volume area since October's earnings with a big volume gap in the $220's. We've broken the lows from August 2023 and October 2023. The momentum from the TTM squeeze indicator is trending down strongly and the on balance volume (OBV) indicator suggests that volume is confirming this move down.
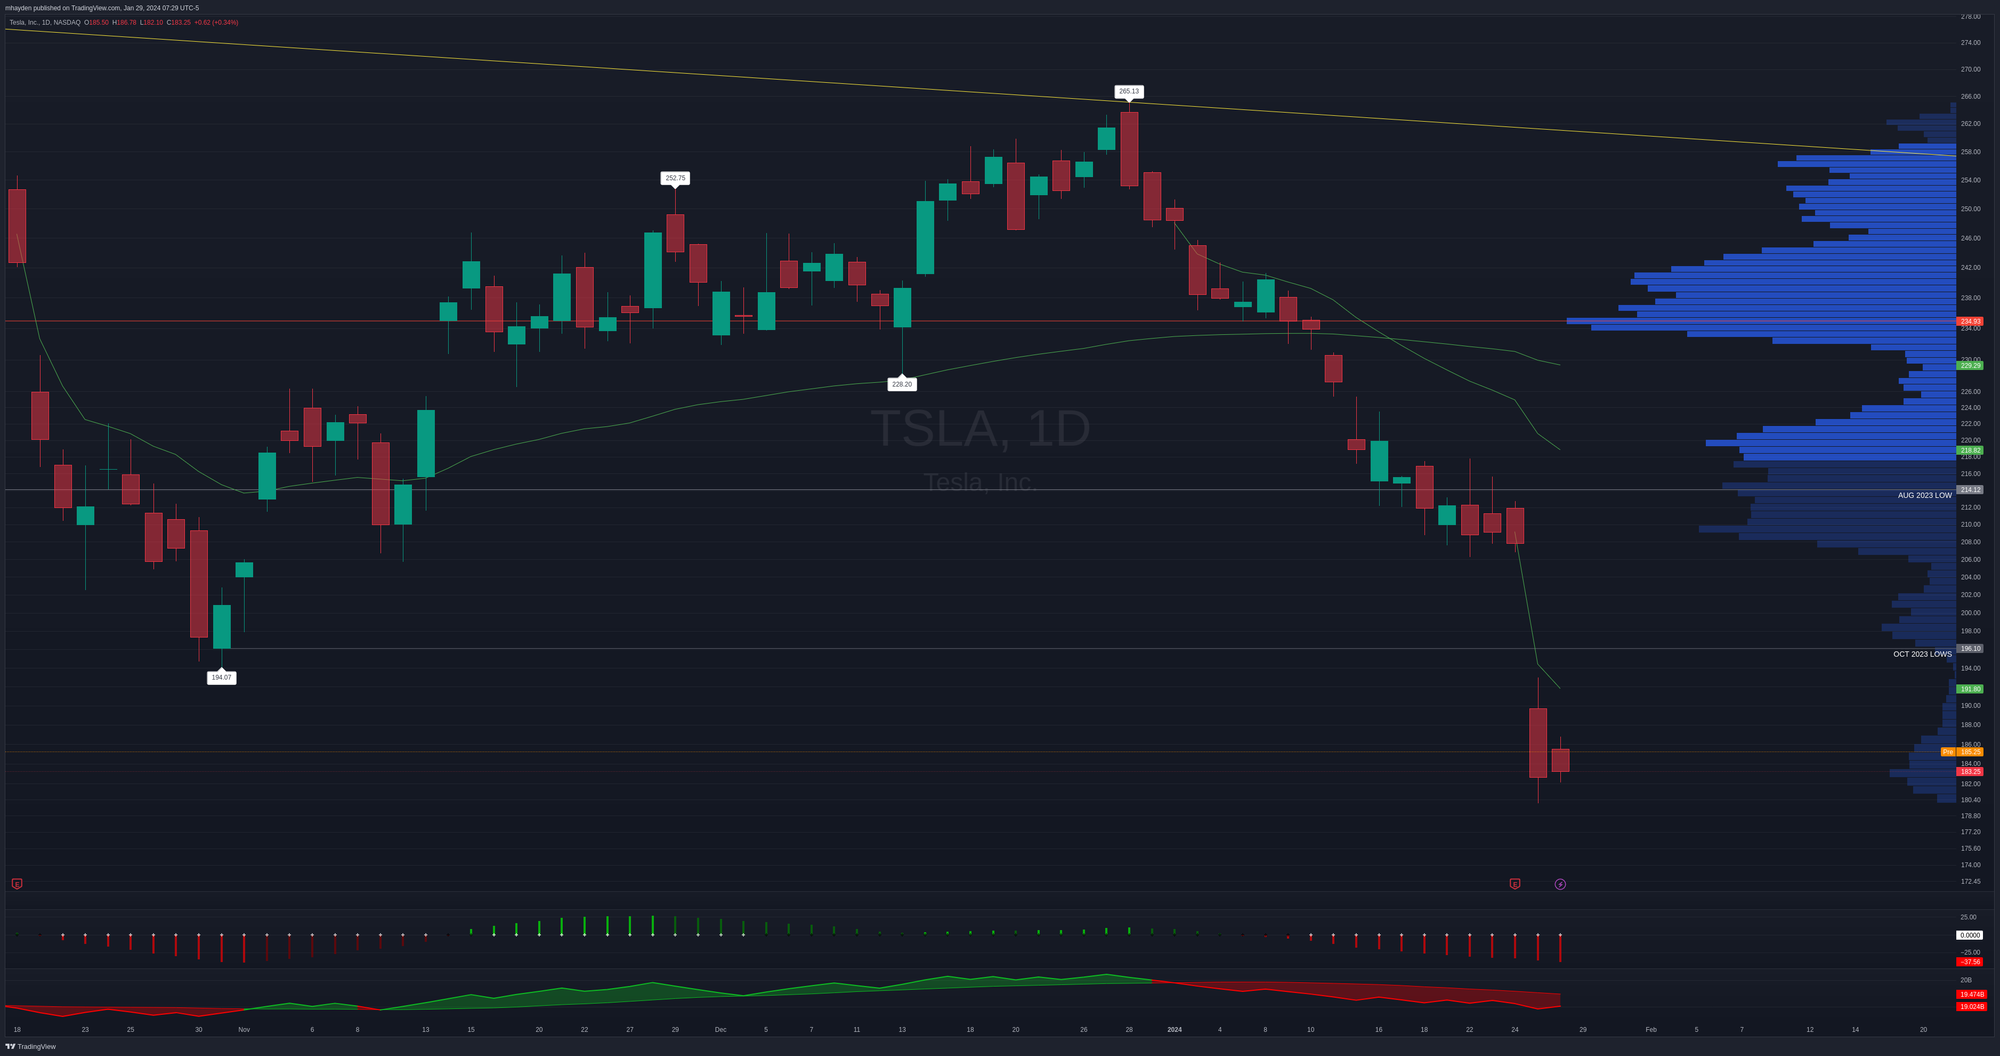
This chart suggests to me that future price movement presents a risk to the downside. However, if I look for optimism, I'd find it in Friday's inside trading day. Friday's high is lower than Thursday's, but the low is higher. I'd need to see more bars to confirm it, but inside bars suggest consolidation to me.
Institutional trades
Trades by institutions can give us an idea of where they're interested in making trades. We can see the trade times, sizes, and price levels, but it's up to us to guess the directionality of the trades are being made.
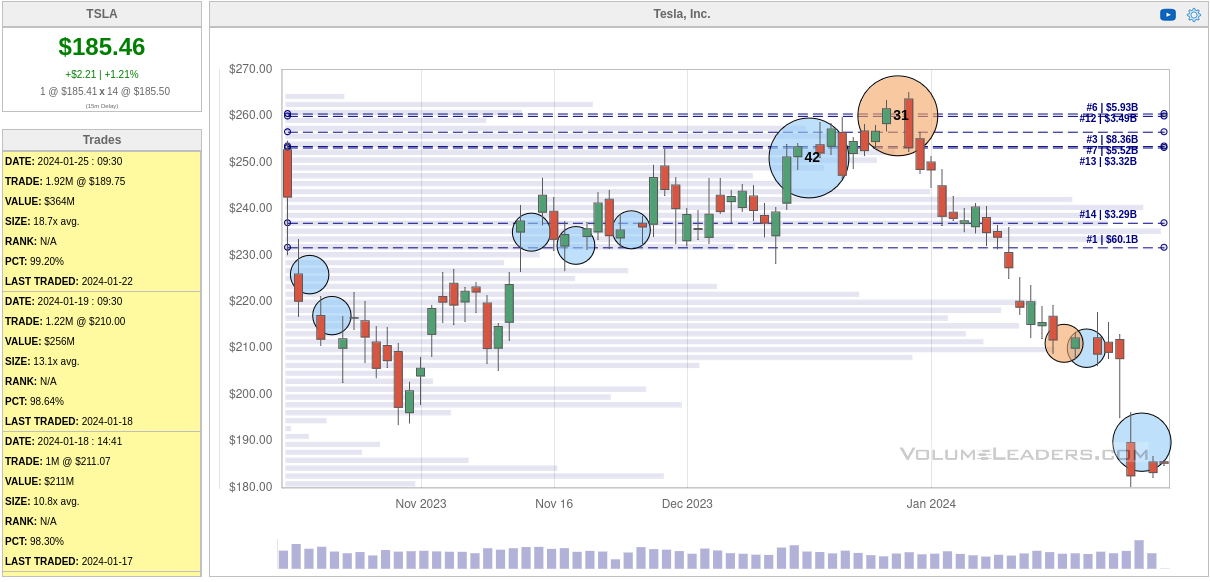
Just as TSLA hit that downward trend line around $265, we saw the 31st biggest trade ever made in TSLA. It was 3.8M shares right at $260 via a dark pool trade. That came in just after the 42nd biggest trade in TSLA at $250.95 for over 3.6M shares.
Normally, I see institutions quietly try to pick up shares during a consolidation period, much like they did in November. Note the smaller blue circles during the consolidation period. These are big trades, but they're relatively small for institutions.
Most recently, TSLA saw 1.9M shares traded after earnings around $189.75 per share. I'm not quite sute that this could mean yet, so let's zoom out a bit and see what we can find on a 52-week chart:
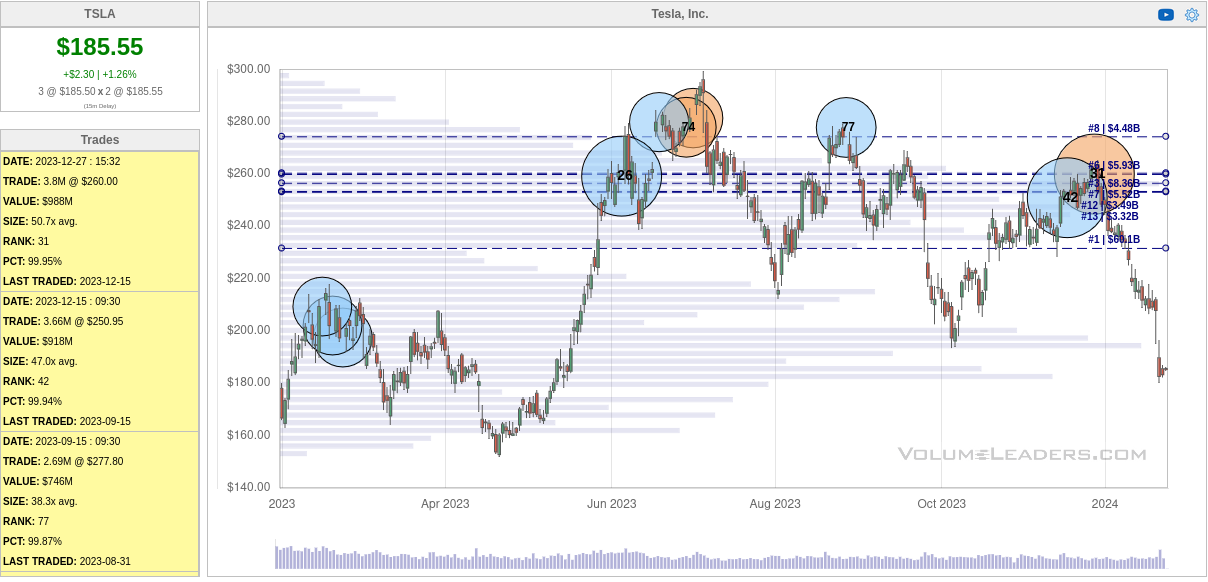
Ah! Look left and you'll find some big trades around this level from early 2023! Three trades were made with over 2M shares each from $209 to $197. The big question here is whether these institutions are looking at this as a buying opportunity on a level where they traded in the past, or if they're looking for the exit before another move lower.
So that most recent TSLA trade was a lit exchange trade (not a dark pool), so we might be able to locate it on a chart. It was done at 10:30AM Eastern Time. Let's drop to a 5 minute chart from Friday and see what was happening then:
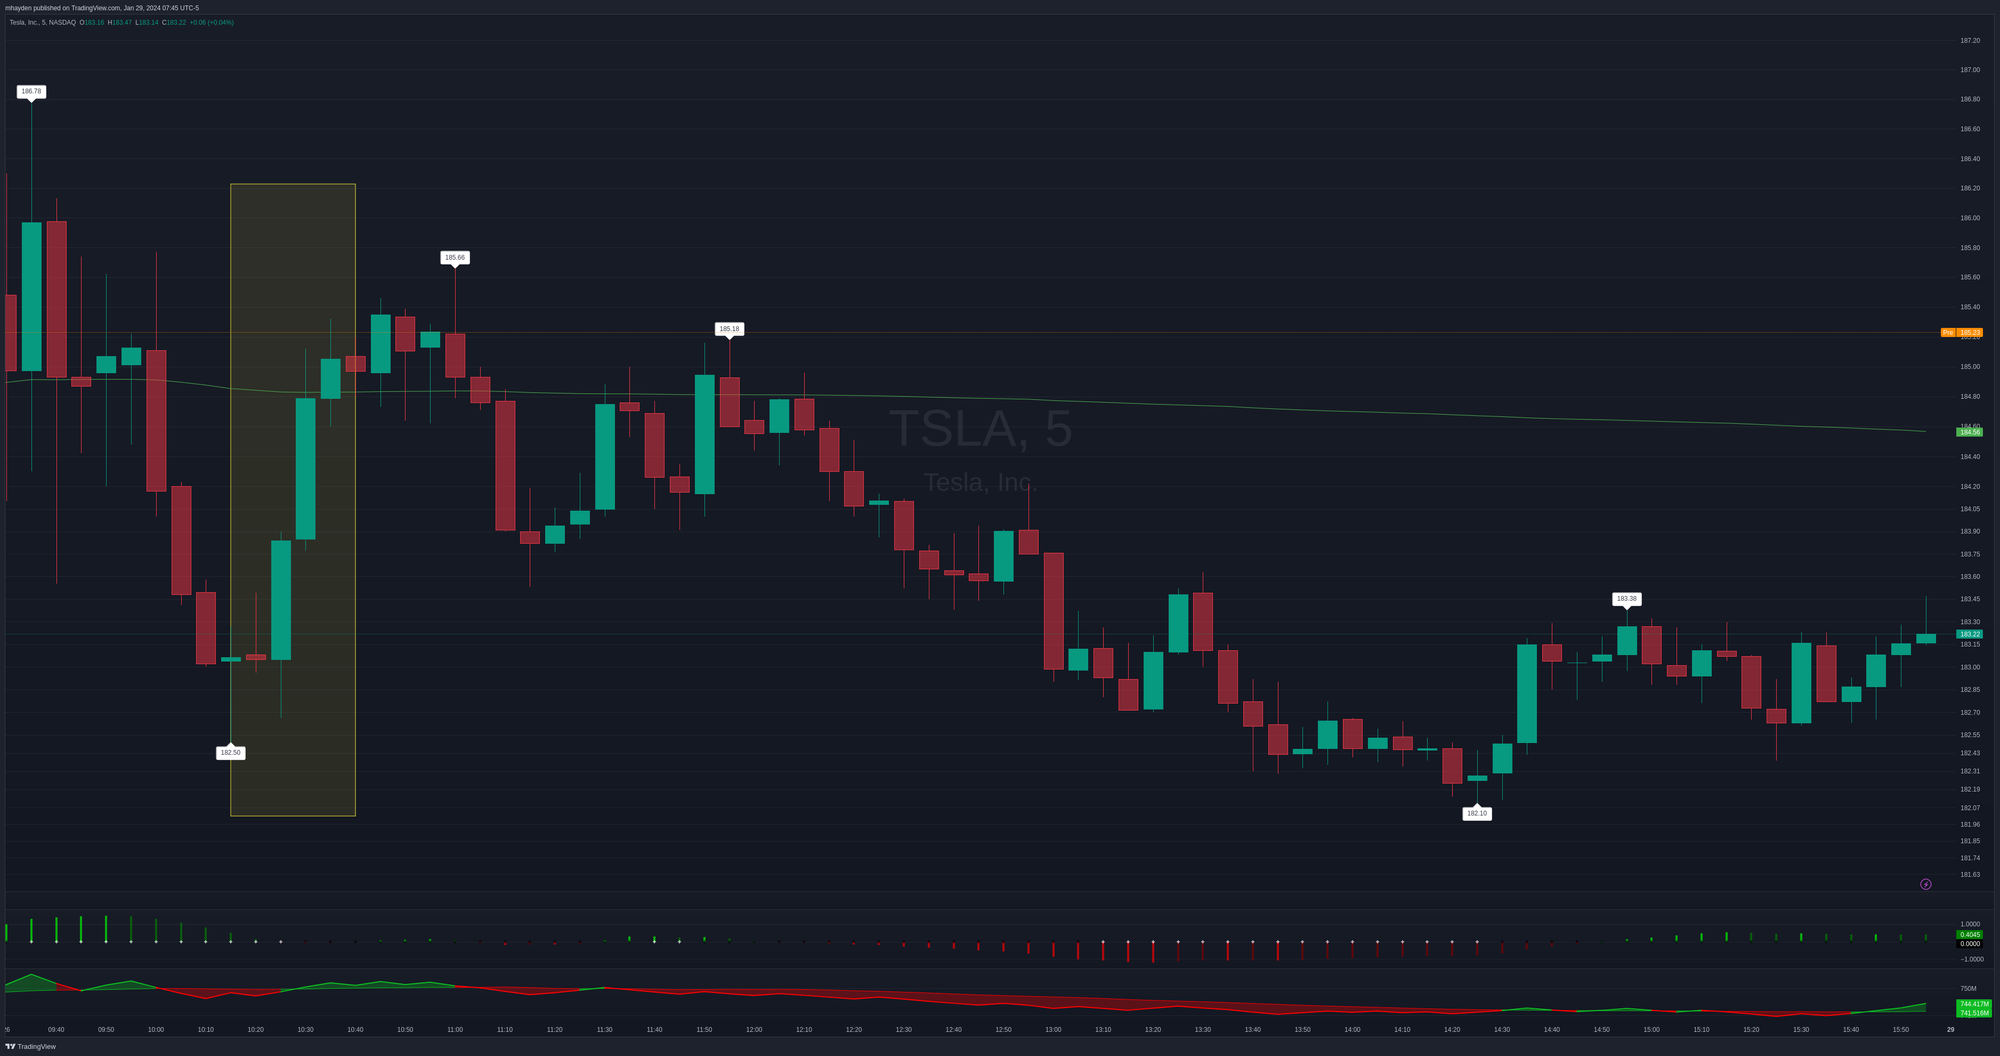
That looks pretty clear like a buy to me based on the candlesticks and the move in the OBV indicator. 🤔
Thesis
This is one of those scenarios where you could make plenty of money betting on the next move, or you could find yourself catching a falling knife. That's when you think you're making a great bet on a falling stock only to find that it falls further after you make your contrarian trade. 🔪
That downward trend line from the all time highs seems to be a strong one that TSLA can't find a way to climb over. However, we have more levels below it that might slow down an upward rise. $200-$210 is a low volume area which could be an area of resistance, or it could be a spot where TSLA could gap up in pre/post market trading.
Guessing the bottom is a risky business for sure. There are signs that we might be finding a footing in the $180s, but I'm not sure I want to throw more money after that trade right now.
I'm still holding a short $185 put for March 15th and it's not looking too good since the earnings call. I don't plan to add onto this trade or exit it just yet because I like this level. If we drop further and the loss widens, I might consider turning it into a short strangle to capture some additional premium.
Good luck to everyone today! 🍀
Discussion