Where's the floor for SPY?

Where will SPY stop it's fall? Let's check the data to find out.

Happy Thursday and welcome back. I took a break yesterday because the work week has been pretty busy and long story short: I needed a break. 😉
I'm really interested to know where SPY might find a floor after its recent dip. Many seems to think that $420 is that level while others think yesterday's price action suggests we're turning a corner.
All investments come with significant risks, including the loss of all capital. Please do your own research before investing, and never risk more than you are willing to lose. I hold no certifications or registrations with any financial entity.
Let's dig into the data to find out.
Options flow
Tradytics has a great chart for tracking net flow. Here's what we had for the overall market yesterday:
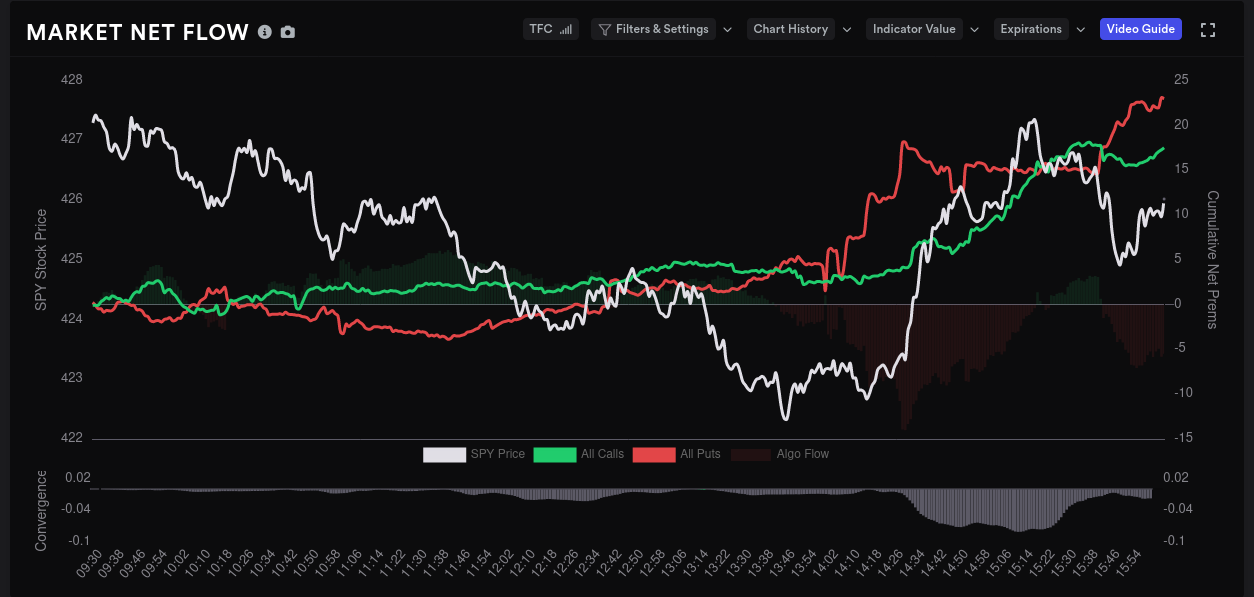
This includes SPY and everything else. It's basically a look across the options flow across the entire market. There are three main lines:
- White: SPY's price
- Green: Call premiums (higher premium means calls likely being bought)
- Red: Put premiums (higher premium means puts likely being bought)
At the bottom, there's a mostly gray chart that shows you confluence within the market. This indicates when options flow is moving in the same direction as price. We didn't see much of that yesterday.
If we check the MNF chart for this week so far, we see that confluence was difficult to come by yesterday, but we had some earlier in the week, especially on Monday:
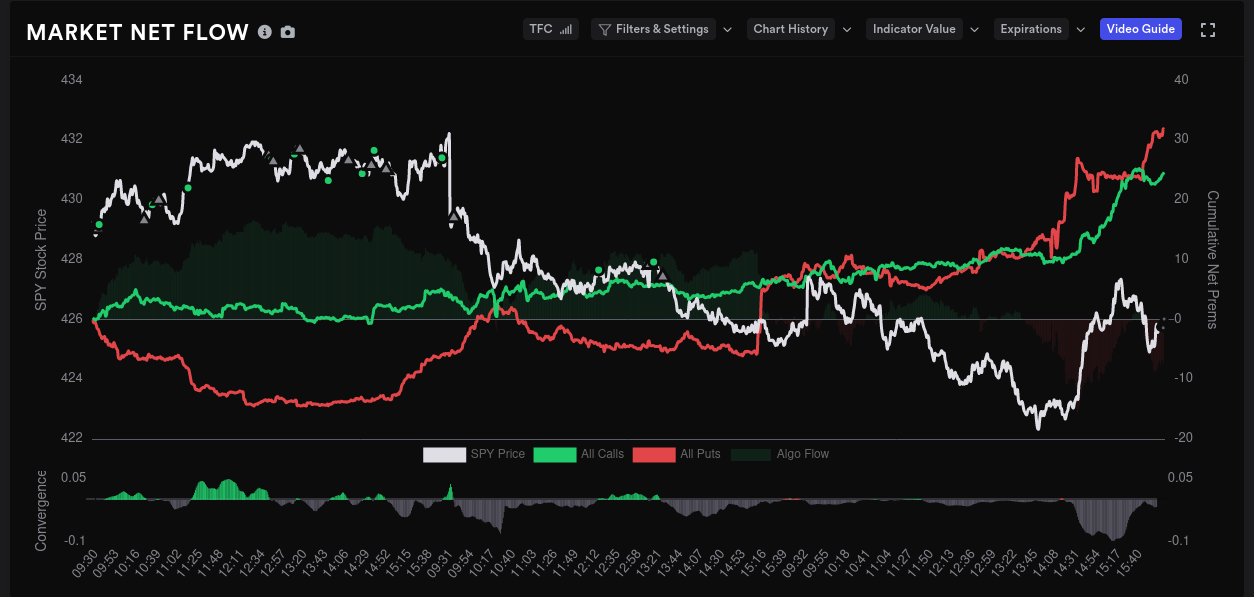
Both of these charts show me that there's a ton of disagreement on where the market is headed this week and traders are lining up a lot of bets and hedges to prepare.
Dealer positioning
SPY is notoriously hard to track with options flow because there's tons of hedging in play. Keep that in mind as we review dealer data. 😉
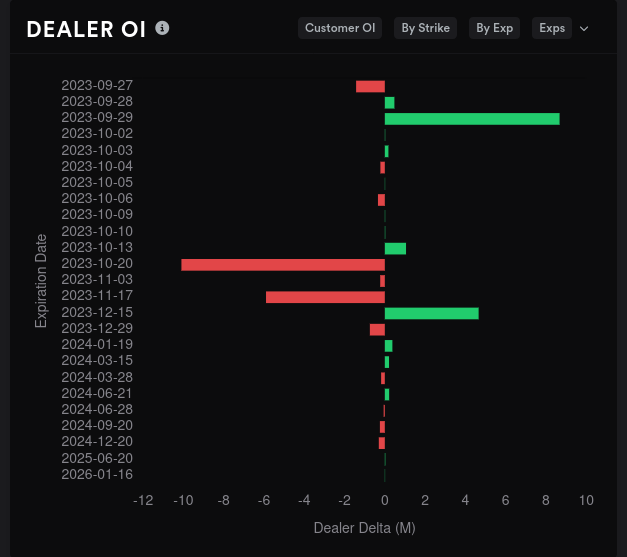
First up, let's examine dealer delta buildup. This is an estimation of how contracts are piling up on dealers based on what customers are trading in the market. Green on this chart indicates that dealers are sitting on the long side of trades. That suggests that customers are sitting on the short side. (Same goes in reverse: red bars mean dealers are short and customers are likely long.)
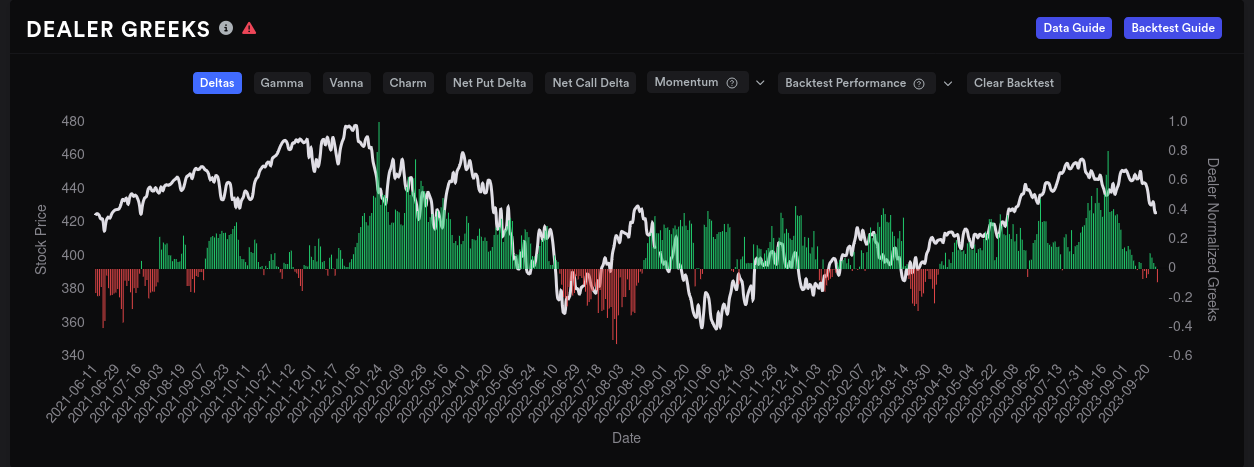
Dealer deltas are currently short for dealers and that's a flip from what we've seen the rest of the week. This suggests that more customers in the market have taken on bullish positions. This chart works better for some tickers than others, so it's a good idea to check a backtest:
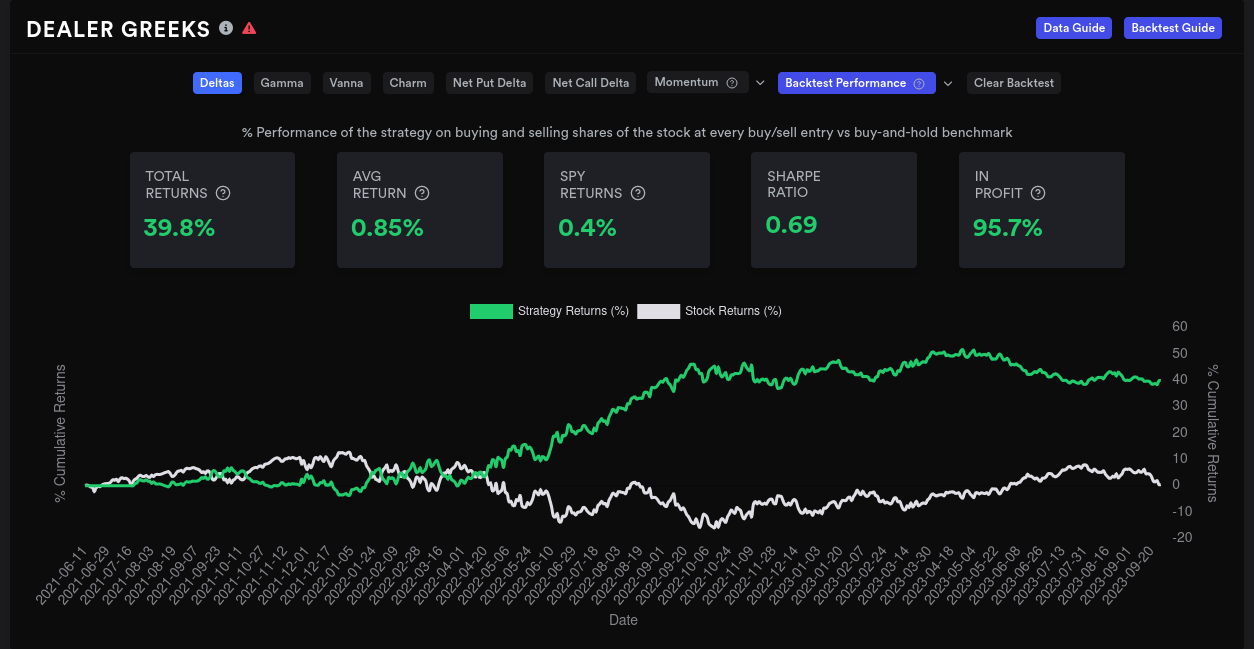
Past returns don't dictate future returns. However, this signal does have a pretty good return on SPY since 2021.
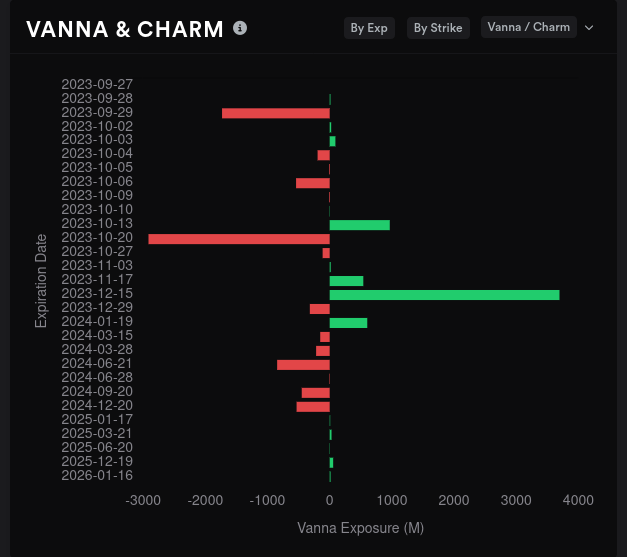
Dealer OI suggests a bearish 9/29 expiration with some bullishness potentially returning on 10/20. Vanna is negative for both expirations as it stands now and that will put a damper on SPY's upward moves even if IV contracts.
Gamma exposure
Aggregate GEX suggests that $425-$428 is a magnet for price action and SPY might have difficulty going below $420-$424 due to resistance across that area. We also have some other decent magnets for price scattered from $430-$440 with some resistance levels in between. SPY and SPX have had some bullish action around $440/4,400 over the last two weeks.
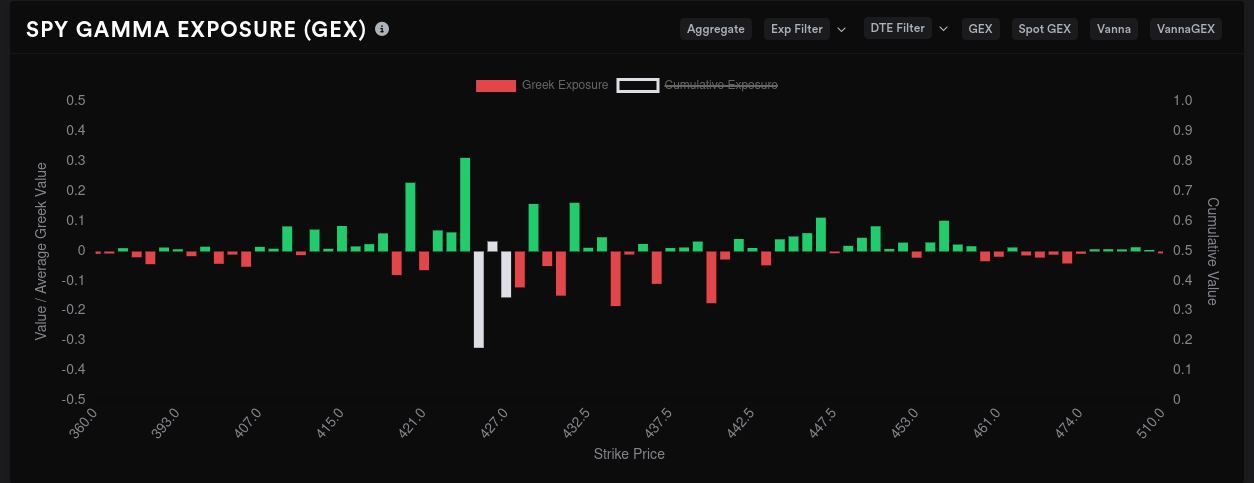
This Friday, 9/29, suggests that our current price is where we are going to stay. However, there's a ton of negative GEX scattered above the current price that seems decently strong until around $447. I highly doubt that we get into the $440's by Friday, but this chart suggests to me that going much lower from here before Friday is unlikely.

There's a ton of GEX expiring on 10/20 and the biggest level is exactly where we are sitting today: $425. Nothing here suggests a rally to me, but I do like seeing a region of strong resistance to the downside from $410-$424. That's re-assuring and makes me think that $420 might be right as our bounce area.

Whales
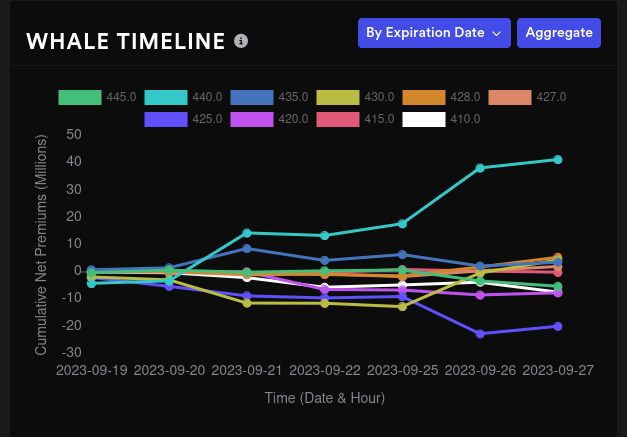
Traders with deep pockets are going bullish on $440 for 10/20. The previously bearish leaning $420 is leaning less bearish as well. Keep in mind that these could be hedges! This also leads me to think $420 is our stopping point.
Chart
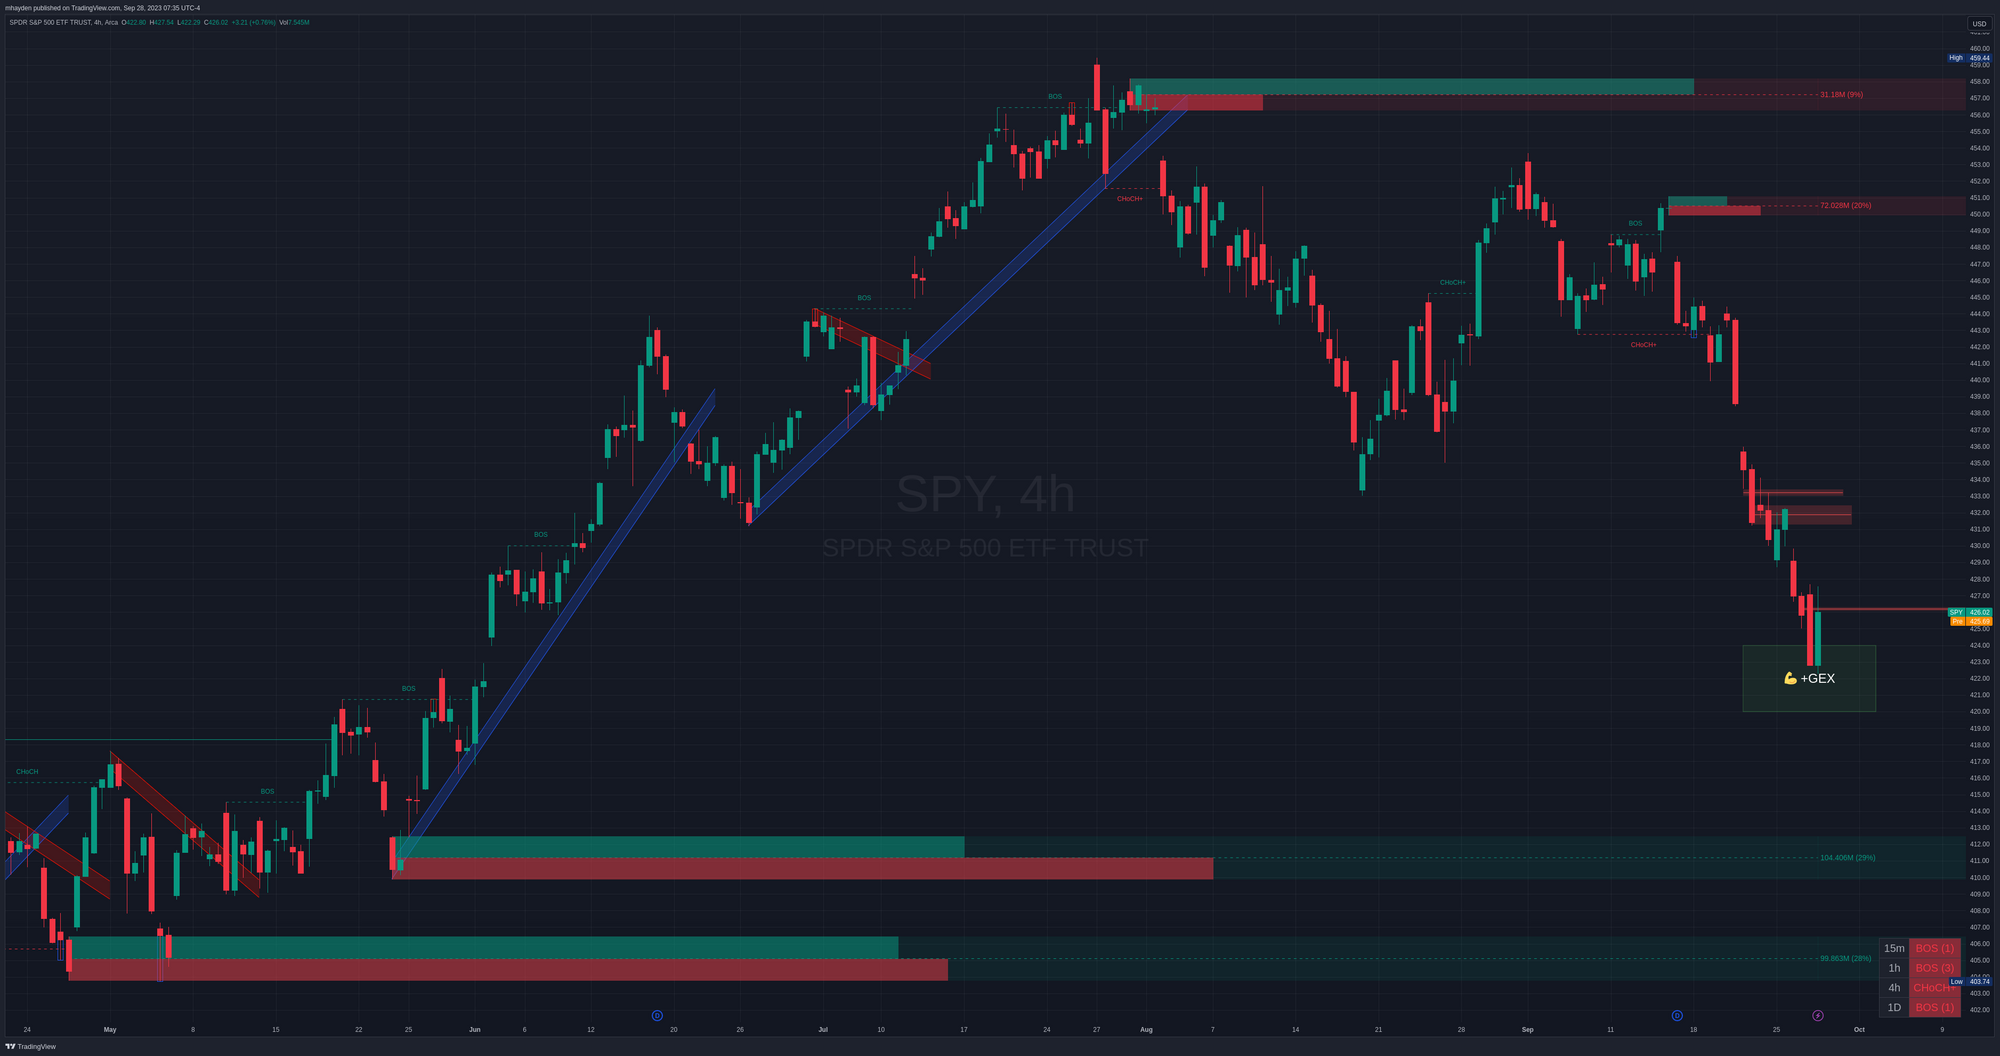
This four hour SPY chart is pretty busy, so let's break it down.
First, I've added a box where I saw positive GEX resistance from $420-$424 just to make things easier. You'll notice that the first half of yesterday plunged into that zone and seemed to bounce back out by the end of the day. That bounce ran right up to a small fair value gap (FVG) at $426 and stalled out. Our next FVGs sit $432 and $433. (Note: I have my FVG timeframe set to 15 minutes.)
So the question remains: does this tell us where we go next?
If we're headed up, I'd like to see SPY push through $426 and test that $432-$433 area. On a shorter timeframe, I'd also be okay with it dropping to the GEX zone for a retest before heading up a bit. We still have that big gap in the upper $430's to deal with at some point. 👀
What if we're headed down? That's not going to be great. There are two big order blocks from $410-$412 and $404-$406 from April and June, but the first order block is mostly bearish. The second one has a fairly even split. I'd really have to wait and see what price action does around those areas before making a call.
Thesis
I've already gone ahead and sold a $420 put on XSP to make a bet on this $420 region holding. That's a risky trade at this point, especially with lots of question marks in the economy around the government shutdown, potential interest rate hikes, and the increase in fuel prices.
Good luck to everyone today. 🍀
Remember your position sizing and avoid overtrading to make up from a loss. Losses are really good teachers if you're ready to listen to the lessons. 😉
Discussion