All vanna Friday for 10/20

Join me for a Friday vanna-rama where I dig into vanna data for SPY, SPX, AMD, and TSLA. 🎊

Happy Friday! 🌄
Last week's vanna roundup was popular, so I decided to bring it back this week. You might call it a vanna-rama or just a fantastic (vantastic?) post, but today I'll focus solely on vanna.
All investments come with significant risks, including the loss of all capital. Please do your own research before investing, and never risk more than you are willing to lose. I hold no certifications or registrations with any financial entity.
Let's go!
Wait, why vanna?
I feel like vanna gives me an edge for two main reasons:
- I can identify potential boundaries for trades based on big vanna levels on either side of price.
- If I have an idea of the aggregate vanna profile of a stock or ETF along with a good estimate of where the VIX might be going, I can make an educated guess on where the price will go based on a change in implied volatility (IV).
Remember that vanna is simply a measurement of how much deltas change when IV changes. This is important because dealers in the market must keep a close watch on the deltas of their contracts (among other things) and the moves they make at certain levels become slightly more predictable.
Vanna also doesn't swing around too much outside of binary events, such as earnings. I get all of my vanna charts from Volland.
Volatility check
VIX has been on the rise lately and it closed yesterday above 20. During last week's charts and coffee post, I mentioned that a close over 20 was concerning and a close over 25 was very concerning. We haven't visited these levels since 2022's slide.
TLT is also approaching some incredible lows. 10 and 20 year treasury yields are hitting record levels as well. The ratio of XLP to SPX is also growing after bouncing off a discount zone.
The world is also embroiled in multiple conflicts that are not easy to solve.
My bet on volatility for the next month or two is that we will be at higher levels than we're accustomed to in 2023. This is bearish for stocks with a positive vanna curve.
SPY and SPX
These two tickers give me a good idea of where the overall market might be going. It's difficult for stocks to move up, even on good news, if the indexes are headed down.
If we look at SPY's curve, we're positive on both extremes, but we have a negative dip right in front of the price. This suggests that even if we get an IV crunch, moving up might be challenging.
Our top end runs out around $440 and we have stops on the way down at $421, $410, and $400. This did look a lot more negative above price earlier in the week and I've watched the $440 level grow quite a bit.
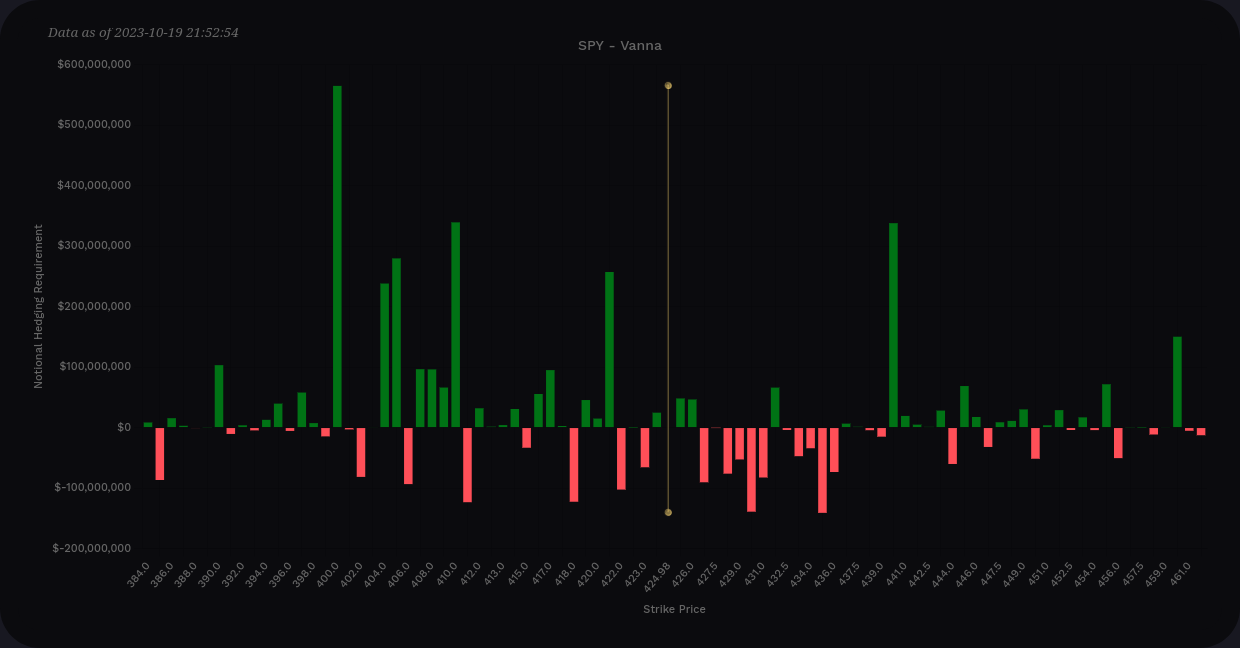
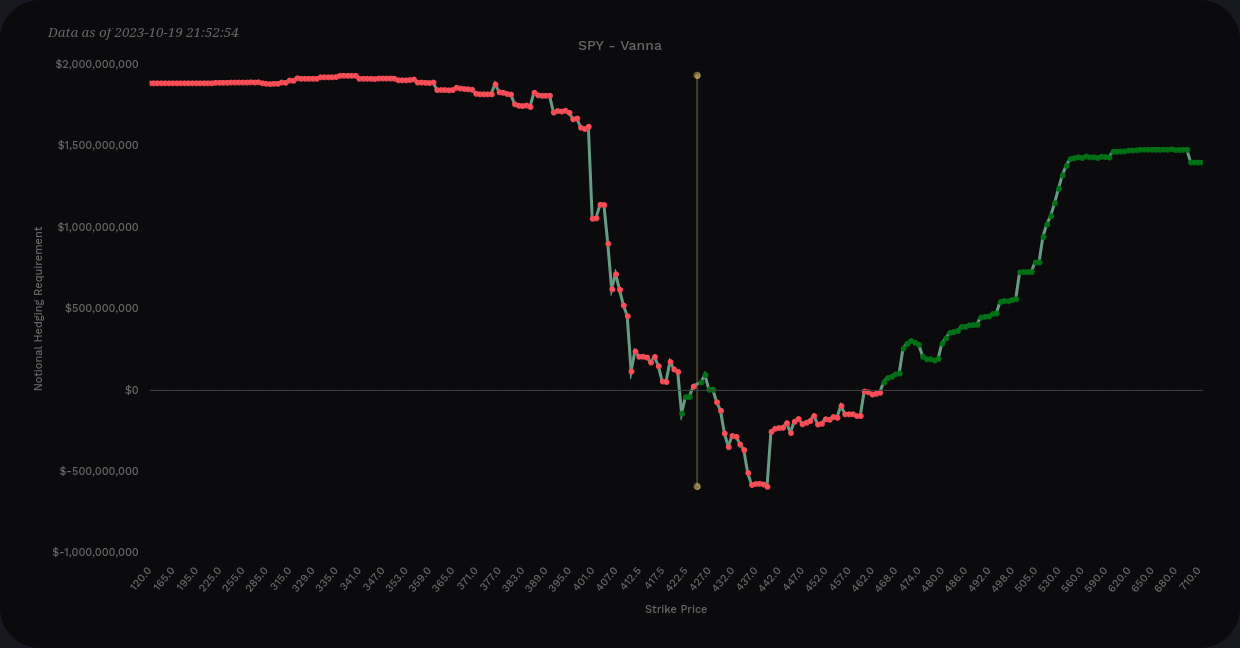
Vanna for SPY
SPX has lots of different hedging characteristics and it's a good one to examine as well. Again, we're positive on both ends of the curve with a negative drop in front of the current price.
4300 looks like a big stop sign here as it's a huge negative vanna level. However, as price approaches a vanna level, the effects of vanna drop. Vanna's effects are strongest at 0.15-0.35 delta. Therefore, if we move up onto 4300, its effects run to zero and we need to look at other levels.
4400 is a clear leader on the positive vanna lines. What concerns me here is that the lines to the downside look a bit small in comparison. We have stops on the way down at 4250, 4150, and 4055, but they're relatively small. This leads me to think that an IV crunch takes us towards 4400, but IV expansion could push us as low as 4055.
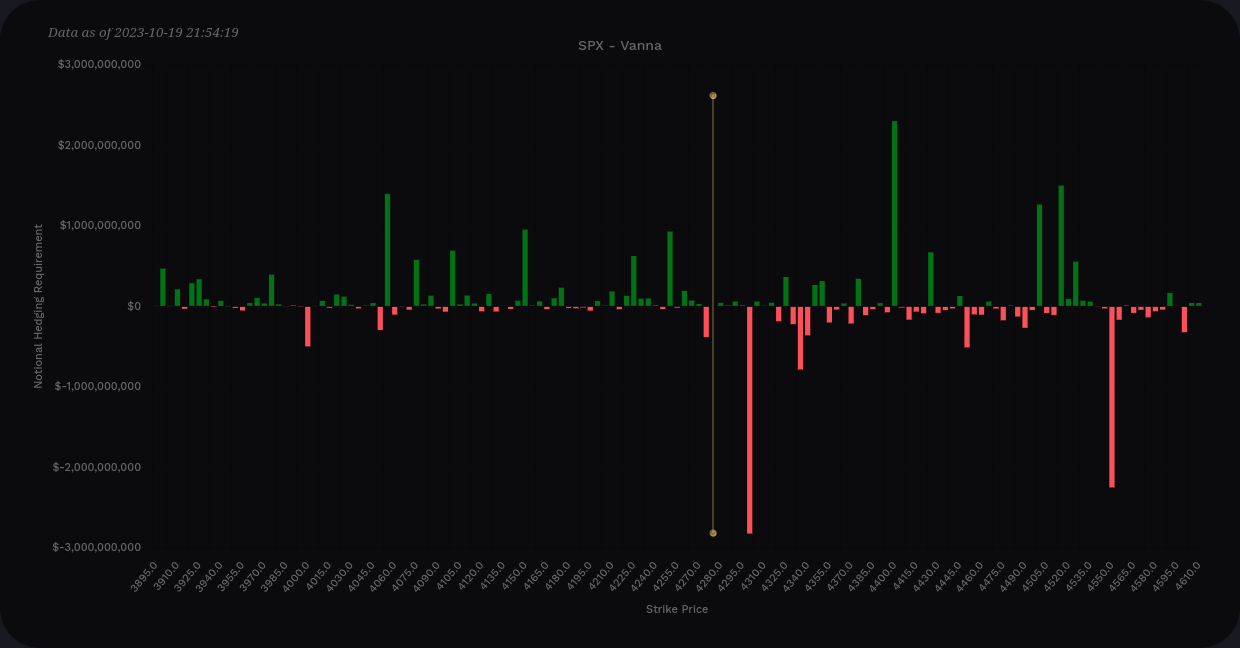
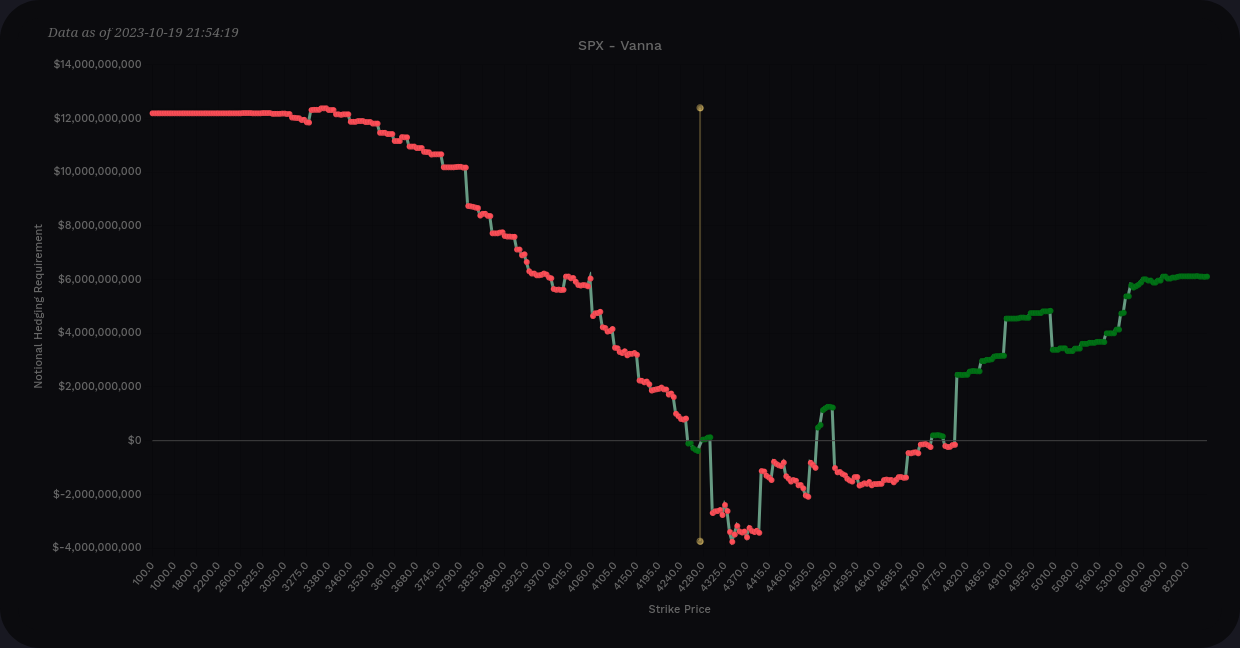
Vanna for SPX
Most of the people on the Volland Discord argue that the SPX data is much more representative of what will really happen. This makes me think that 4055-4400 is our likely trading range for a while.
AMD
AMD had a weird look mid-week where it the curve was quite high on the left and very negative on the right. That has improved quite a bit, but the clear strike to hit is $110. $90 and $115 show up as minor targets on the bar chart.
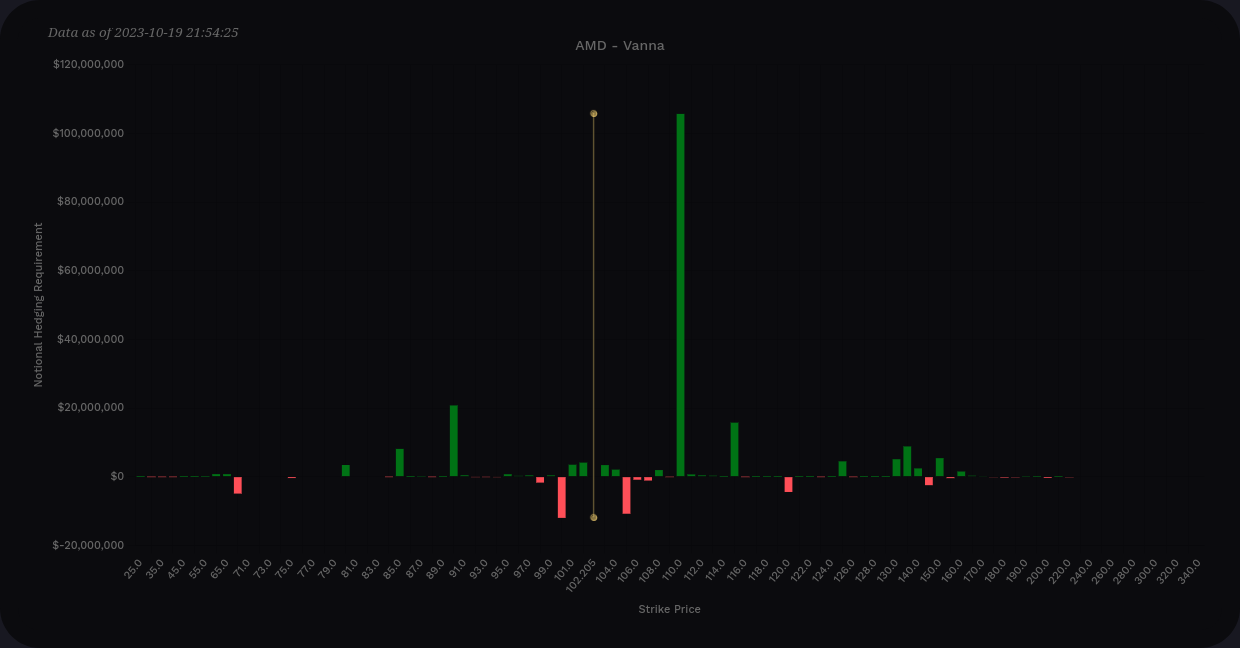
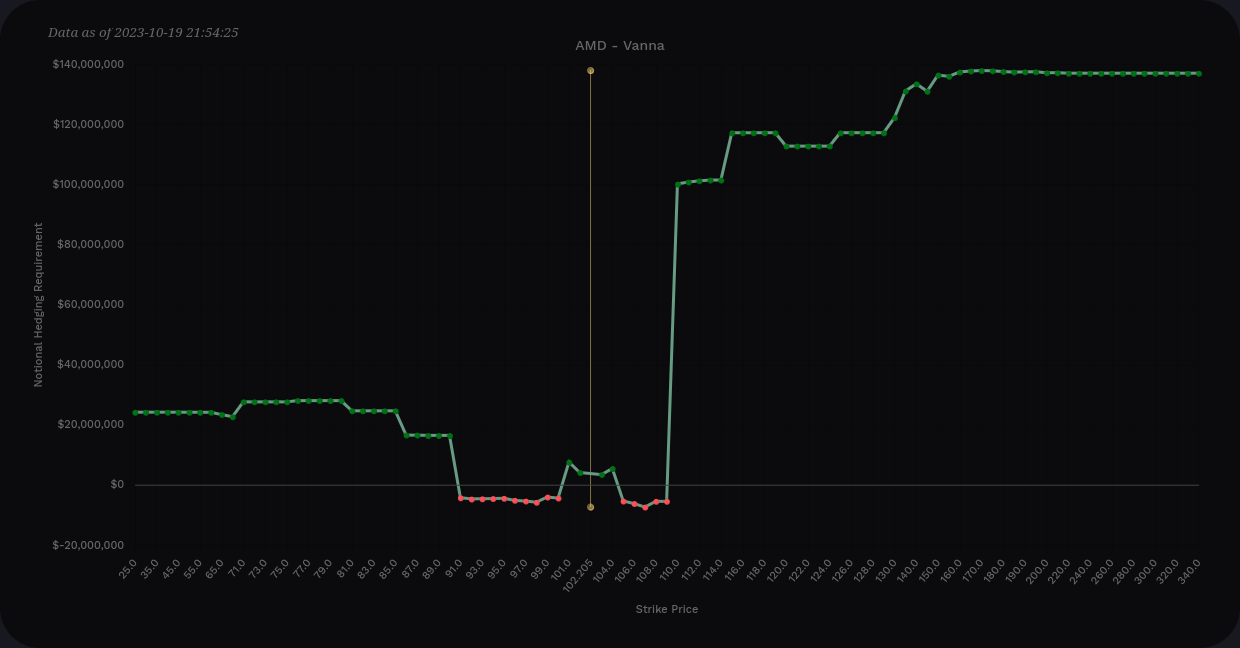
Vanna for AMD
AMD has earnings on 10/31. 🎃 TSMC had a fairly decent earnings report and AMD recovered a bit from that news. If the semiconductor sector remains quiet and IV remains steady or contracts, AMD could approach $110 but I can't find much evidence that it will go higher.
However, if IV increases, there isn't much to slow AMD on the downside. $90 might be a speed bump there, but there's not much vanna on that strike.
TSLA
Earnings were rough on TSLA's price and it had a massive $250 positive bar on the vanna chart before earnings and that slid down to $220. Today it slid further to $215. 📉
TSLA's vanna is very negative overall and I haven't seen it this negative in quite some time. This chart leads me to think that $215-$220 will likely be where TSLA gets stuck for a while. An IV crunch isn't likely to move price up by much.
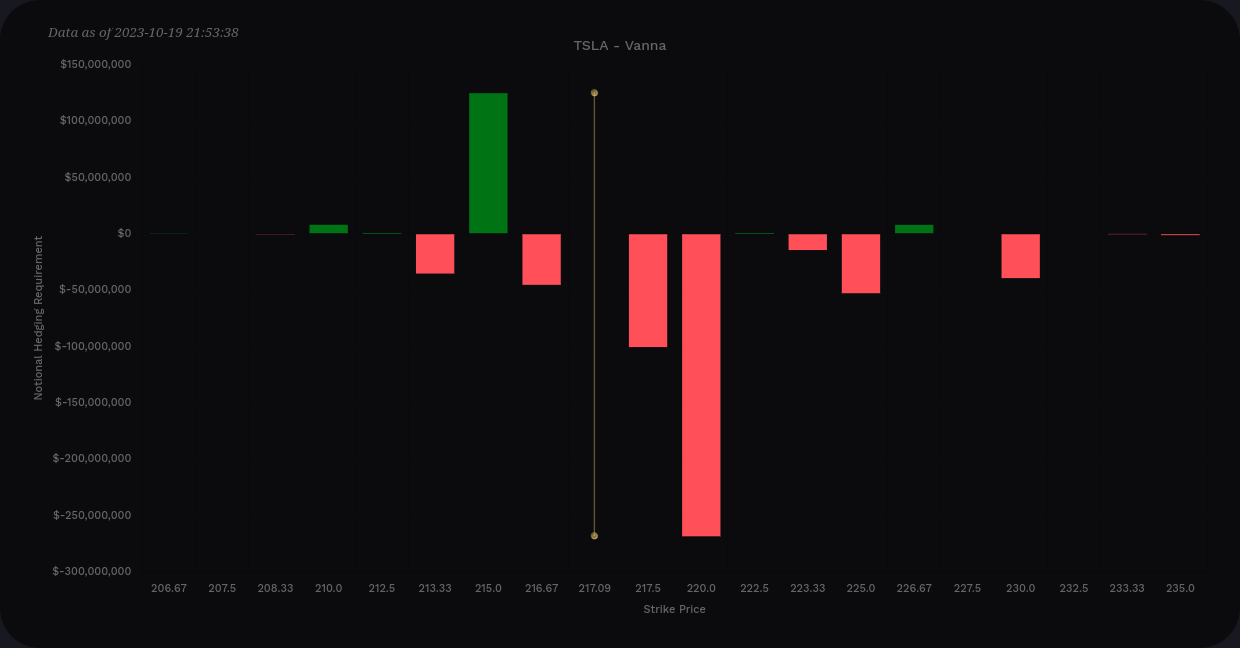
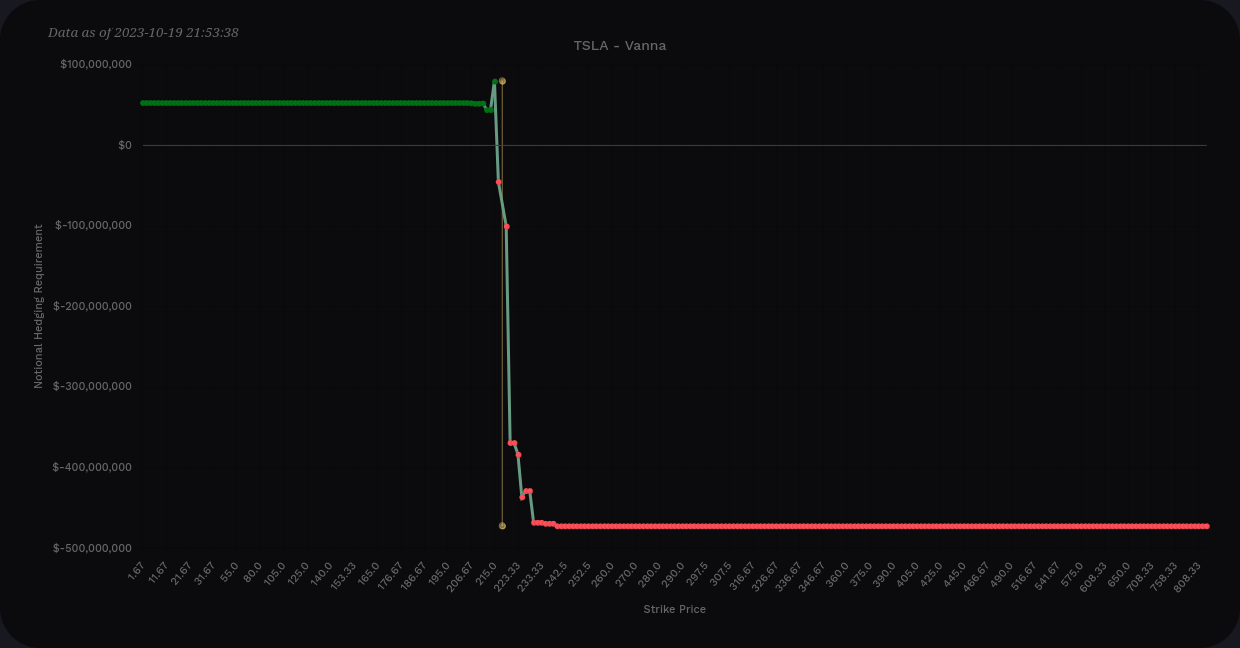
Vanna for TSLA
Thesis
TSLA looks the worst out of the group by far. AMD shows some promise to $110, but not much further than that. If their earnings significantly change traders' perceptions of the company, we could see bigger vanna levels above or below the price.
SPX looks like it's set up for bullish moves to 4400 but those likely won't happen unless we get an IV crunch of some sort. Go check out charts for JNK, HYG, TLT, and the VIX. You'll likely see a pattern that shows there is plenty of fear in the market. Most of the charts I'm seeing have a very "risk-off" look.
Cem Karsan thinks we might see some favorable conditions return on or before November 3rd, so that's a little positivity injected into your day. 🌈
Good luck to everyone today and have a great weekend. ☘️
Discussion