Checking in on AMD for 9/25

Where will AMD stop heading lower? Let's dig into the data as we approach AMD's 10/31 earnings. 🎃

Happy Monday! 🌄 Go back and review the Charts and Coffee post from yesterday to get my take on this week's charts for SPY, AMD, and TSLA. But it's time to look at AMD's options data for this week.
The 9/29 expiration has looked a little unusual over the past several weeks as I've seen quite a bit of volume on that expiration data for a while. It seemed like traders were skipping the monthly 9/15 OPEX and betting on 9/29. We have GDP estimates this week and PCE (Personal Consumption Expenditures Price Index) data as well.
Some traders might also be betting on bearish seasonality to end as as we finish the week. Either way, 9/29 is something special. ✨
All investments come with significant risks, including the loss of all capital. Please do your own research before investing, and never risk more than you are willing to lose. I hold no certifications or registrations with any financial entity.
Let's get into the data.
Options flow
Overall flow gives me an idea of trading momentum. Sure, flow can change quickly, but the overall momentum can give hints to the direction that the market is heading in general.
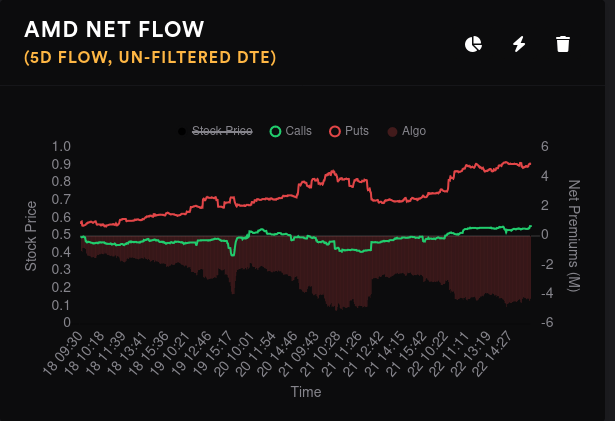
AMD comes in with bearish flows on a one and five day chart. However, notice that the gap on the five day chart between the lines is about 3-4M, which is relatively small for AMD. So yes, it is bearish overall, but not by a large margin.
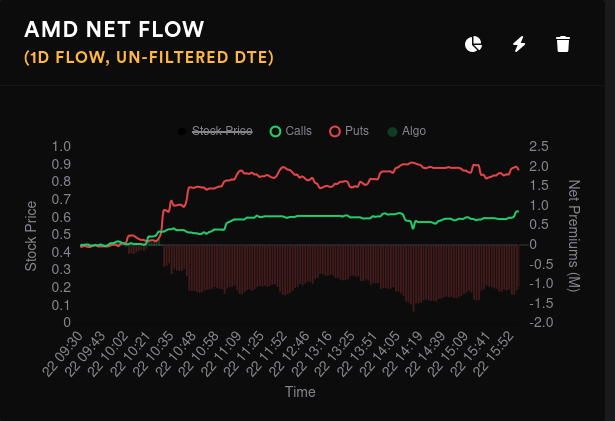
Customer calls on a daily basis have flip flopped since June 16th with a bearish turn over the past five days.

Customer puts are creeping up over the past week. There was a bunch of sold puts through July/August that flipped aggressively to the bearish side on August 21.

So we have customer calls and puts going more bearish in tandem. That's definitely a tilt to the downside.
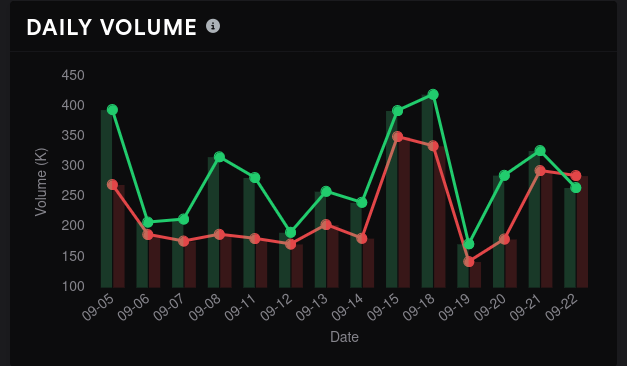
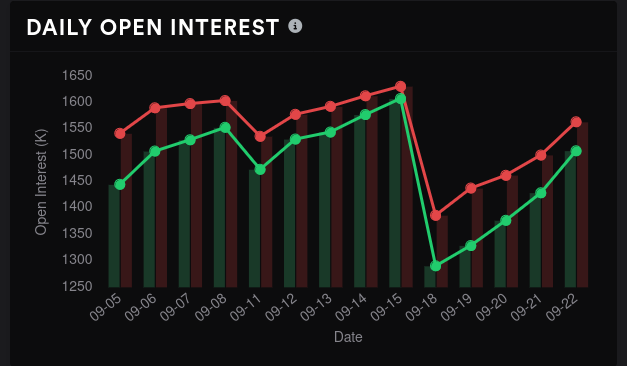
Options volume is relatively high and put volume surpassed call volume on Friday. That's rare for AMD. Open interest has increased over the past week which leads me to think AMD is about to make a large move.
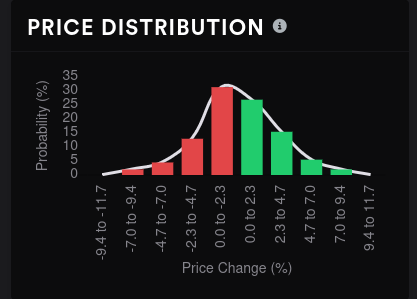
Options are also priced for a downward move of 0-2.3%:
Vanna
Positive vanna with contracting implied volatility (IV) is a bullish trader's best friend. AMD's aggregate vanna curve is positive at the extremes, but we have two decently sized negative vanna levels blocking our path to $110, the largest positive level. $90 has jumped significantly over the past week or two.
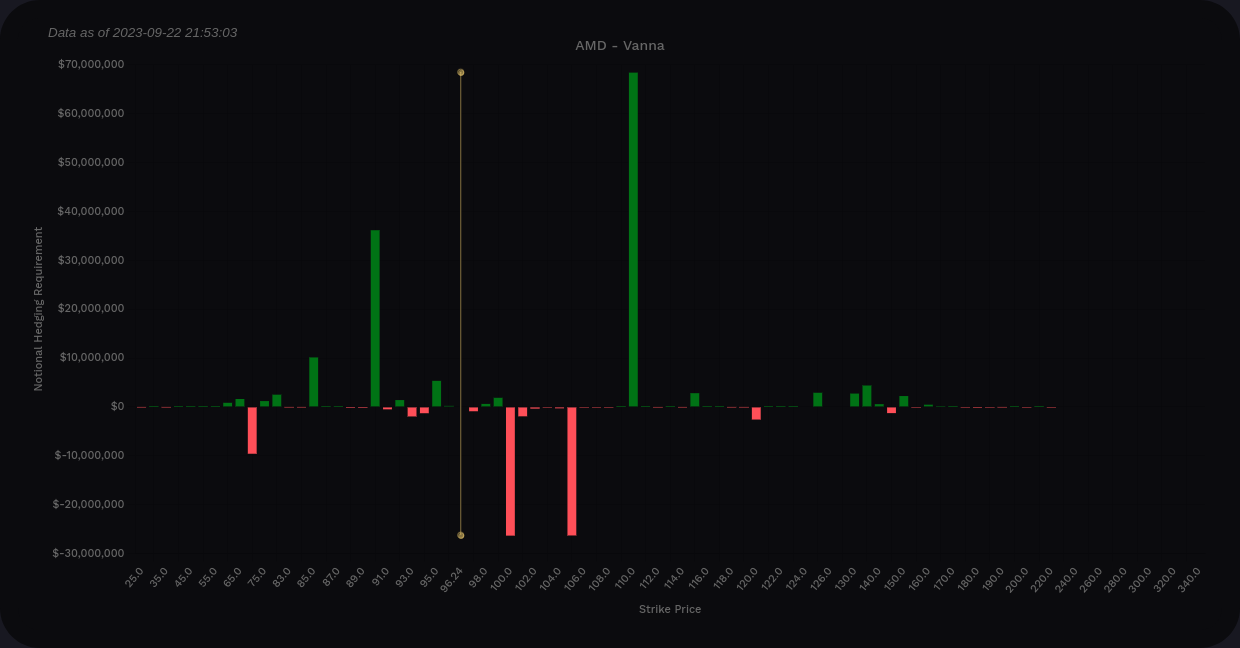
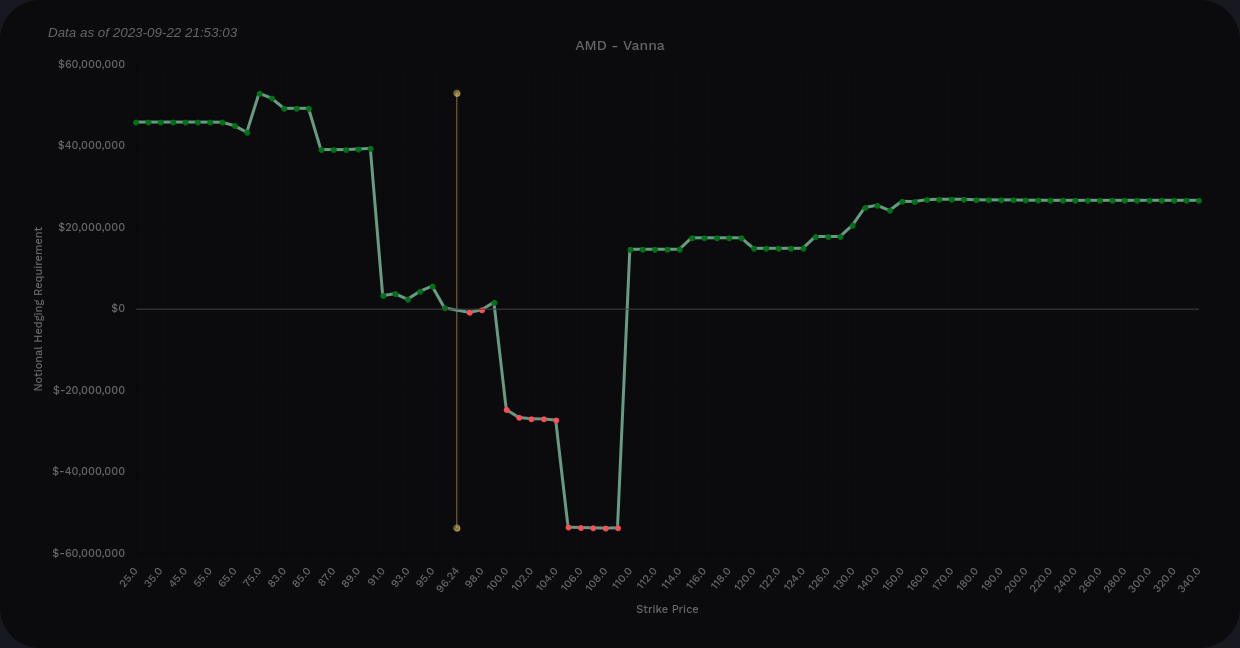
These charts lead me to believe that AMD does have some bullish pressure to $110, but something needs to happen with these $100 and $105 levels.
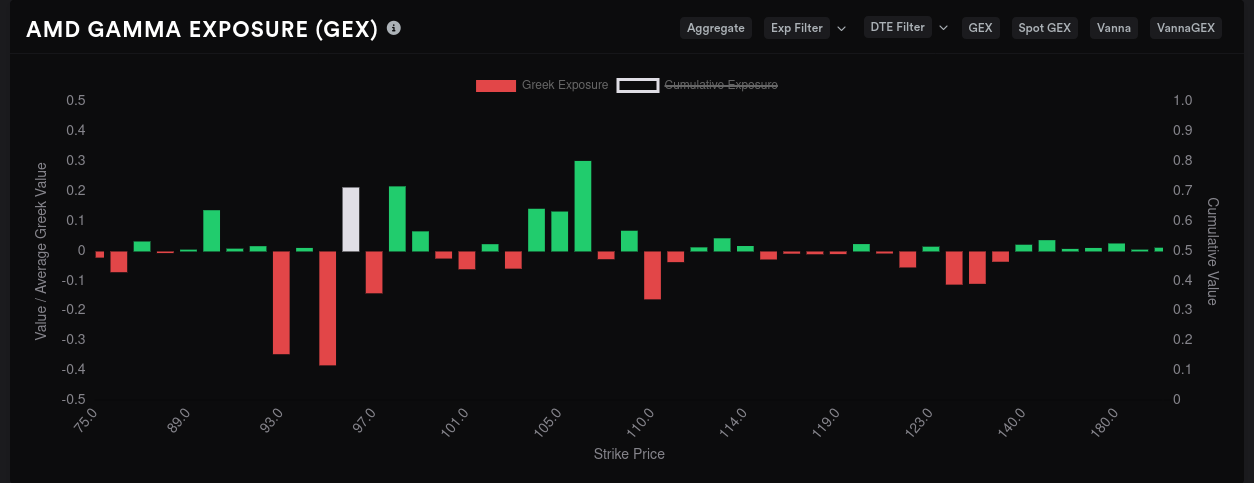
Gamma Exposure
AMD has the most GEX expiring just after earnings on 11/17. Behind that, 9/29 and 10/20 are also big expirations.

Aggregate GEX across all expirations suggests price will hang around $93 and $95.
9/29's data suggests a possible move to $102-$103. $98 is a secondary target.
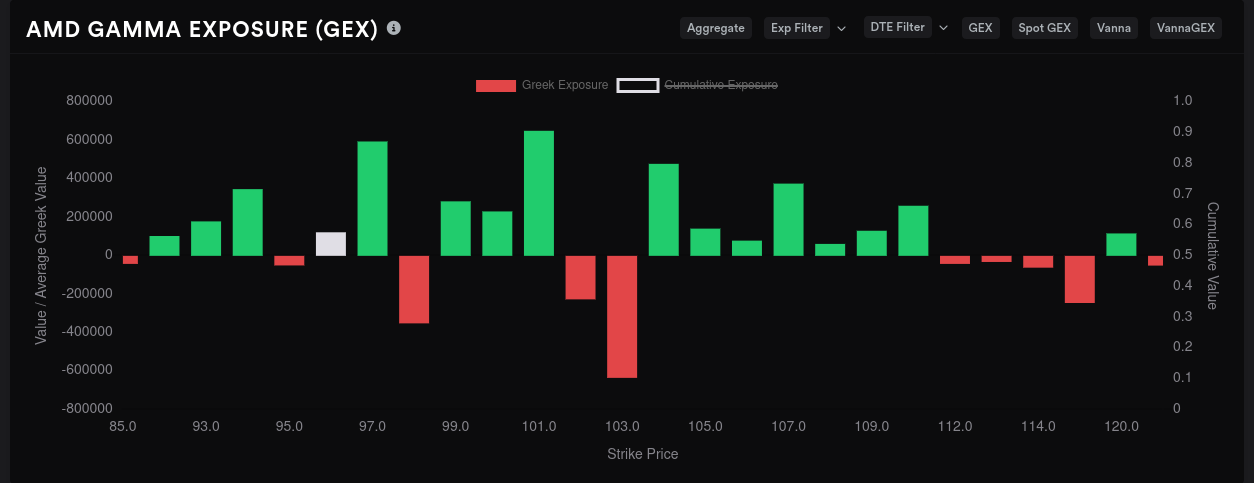
10/20 offers a clear price magnet at $95.
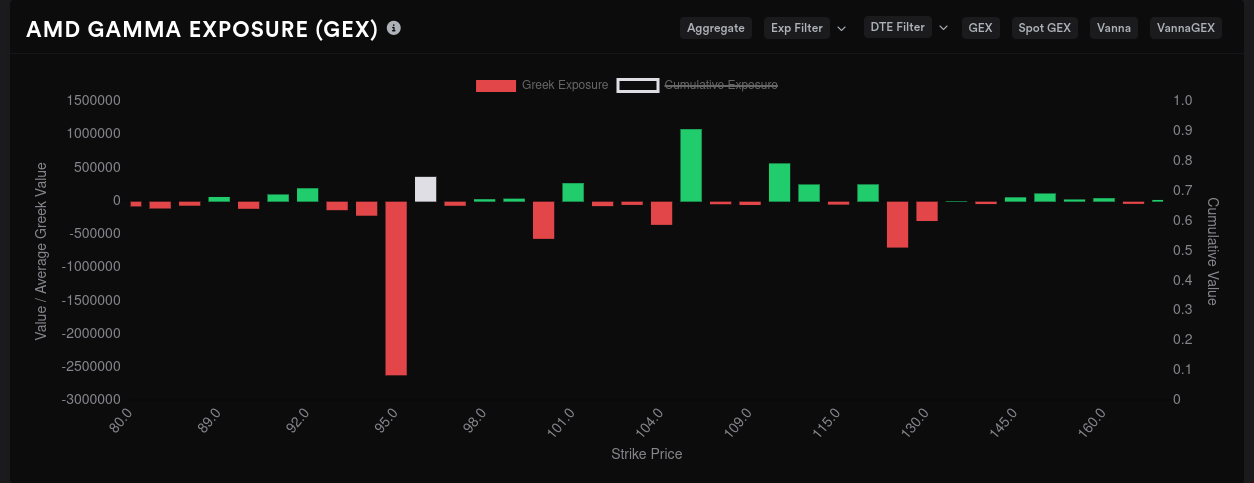
11/17 had some exciting GEX targets around $125 and $130 for a while, but now that negative gamma spread downward to $95, $110 (remember vanna here!), and $120-$135.

Remember that 11/17 is after AMD's 10/31 earnings call and anything can happen with earnings. 🎃
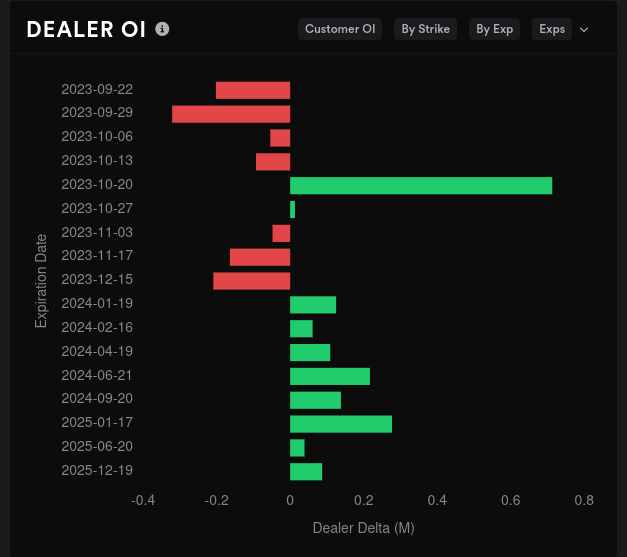
Dealer positioning
Dealer delta buildup momentum is almost even right now. It's difficult to tell which way market participants are leaning here, but dealers have gradually become less short over the past two weeks. That leads me to think that customers have gradually become more bearish.

If we look at open interest from the dealer's perspective, we're slightly bullish until we reach 10/20, which is a very bearish expiration. Nothing really sticks out here othehr than 10/20. Traders aren't willing to take on a big position on either side yet.
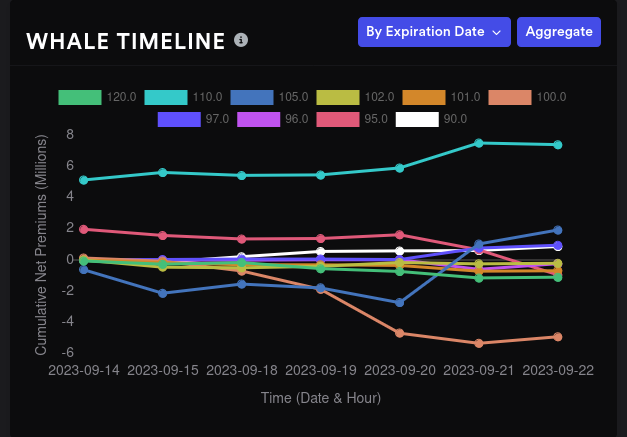
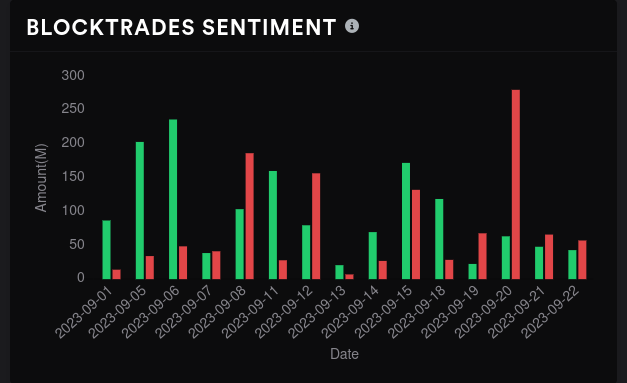
Whales
On the aggregate, big options traders went bullish on $110 long ago and are still holding those contracts. $100 went bearish last Wednesday and held there. $105 flipped bearish to bullish last week as well.
How do we square these? It's possible that big options traders are expecting AMD to make a pop off a support level before going lower. AMD has a lot of support levels in the $90's.
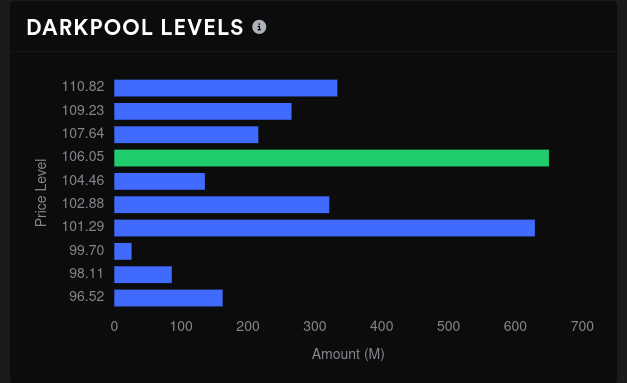
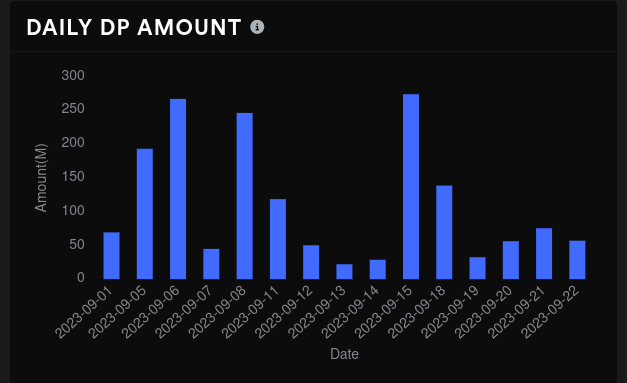
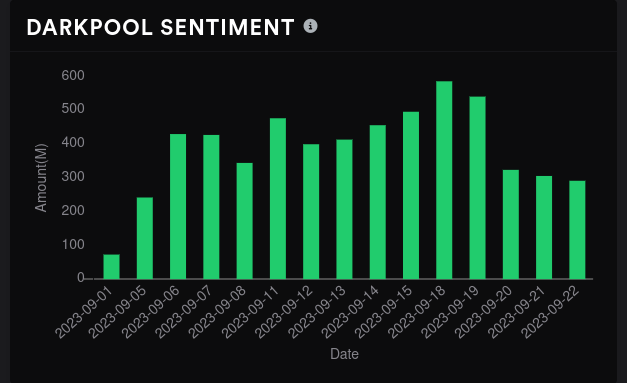
Dark pool trades
AMD's dark pool sentiment remains bullish even after a big spike in bearish trades last Wednesday as AMD fell. Volume for AMD was quite low last week after Monday. The biggest volume level remains at $106, but the $101 level gained a lot of volume
Remember that AMD made a gap from $99-$100 last week as it moved down and that gap shows up here on the dark pool levels, too.
Thesis
AMD has moved down decently, but I'd argue that there's enough data to support a bullish pop of some sort that might be short lived:
- AMD has plenty of support levels in the $90-$100 range from moving averages and VWAP lines. The 200MA is at $95.16.
- GEX and vanna show the end of the line around $90-$93 for a correction.
- AMD's highest dark pool volume is at $101 and $106. The highest volume on the chart since the recent high is around $110.
- $110 is a level where whales are making bets and it's the vanna price target if IV were to contract a lot.
- AMD's current price on the daily is below the Bollinger band entirely.
There's also a possibility that we continue trading in a sideways or slightly downward trend until earnings. $95 shows up as a big GEX level for all expirations through 11/17.
My cost basis is around $93.05 after getting assigned on some puts last Friday. I still have a short $100 put for 10/20 that doesn't look too good right now, but there's plenty of time left on it. I could sell some covered calls if AMD decides to pop off one of these support levels this week but I'd need to see the price action first.
A good range for AMD right now seems like $95-$110. $110 feels a little out of reach at least through 10/20, but things look to open up after that. If you want to be more conservative, going bullish from $90-$95 might be a better option.
Good luck to everyone out there today. 🍀
Discussion