AMD analysis for December 11
AMD went on an absolutely amazing run recently, but where is it headed now? 🤔

Good morning from chilly Texas! 👋 If you missed my Charts & Coffee from yesterday, go back and have a look. I'm always having a difficult time looking at the longer term picture and yesterday was a deep look into some monthly charts.
All investments come with significant risks, including the loss of all capital. Please do your own research before investing, and never risk more than you are willing to lose. I hold no certifications or registrations with any financial entity.
With AMD on a continued rise, what will happen next? 🤔
Vanna
AMD's vanna has stretched out with some great positive levels over the past two weeks.
(Volland has some issues this morning with live data so I'm using the very last data from Friday which should be the latest available data.)
The curve has plenty of positive vanna ahead of the price, which is great for bullish trades, but I really wish we could see the negative gamma disappear below the price. This doesn't look bearish for me, but it could look better. I'm wondering if this week's OPEX will shave off some of that negative vanna.
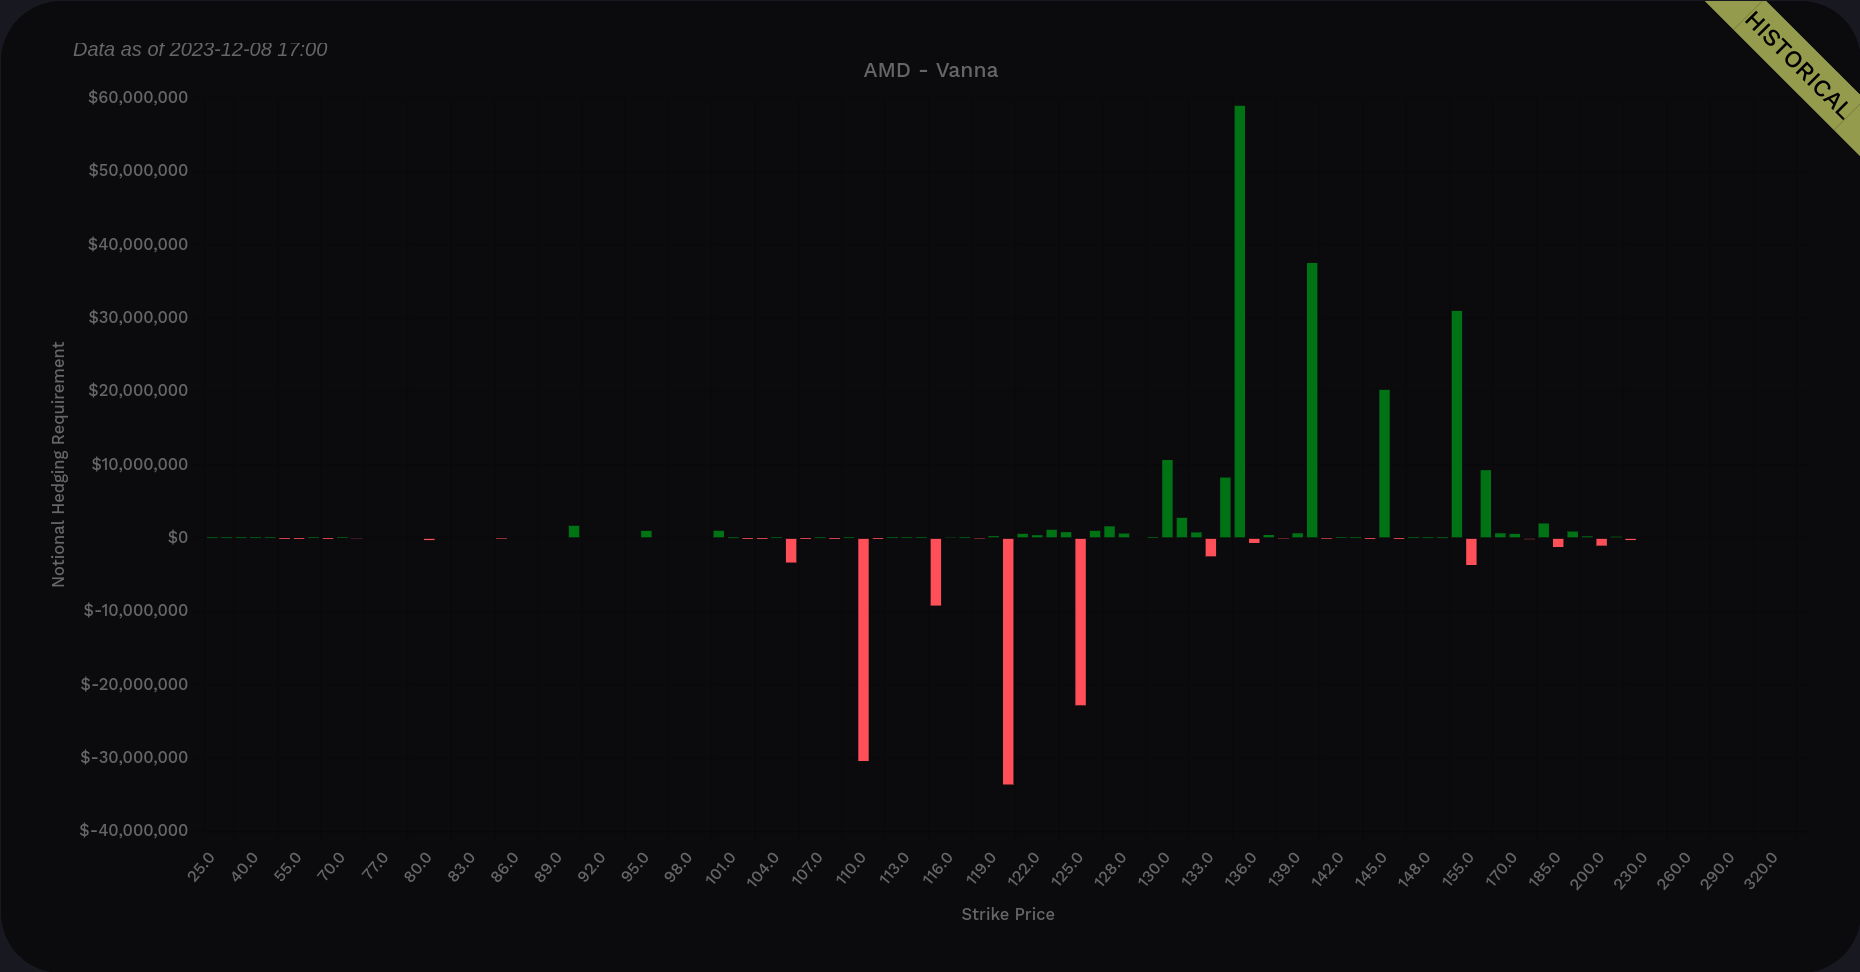
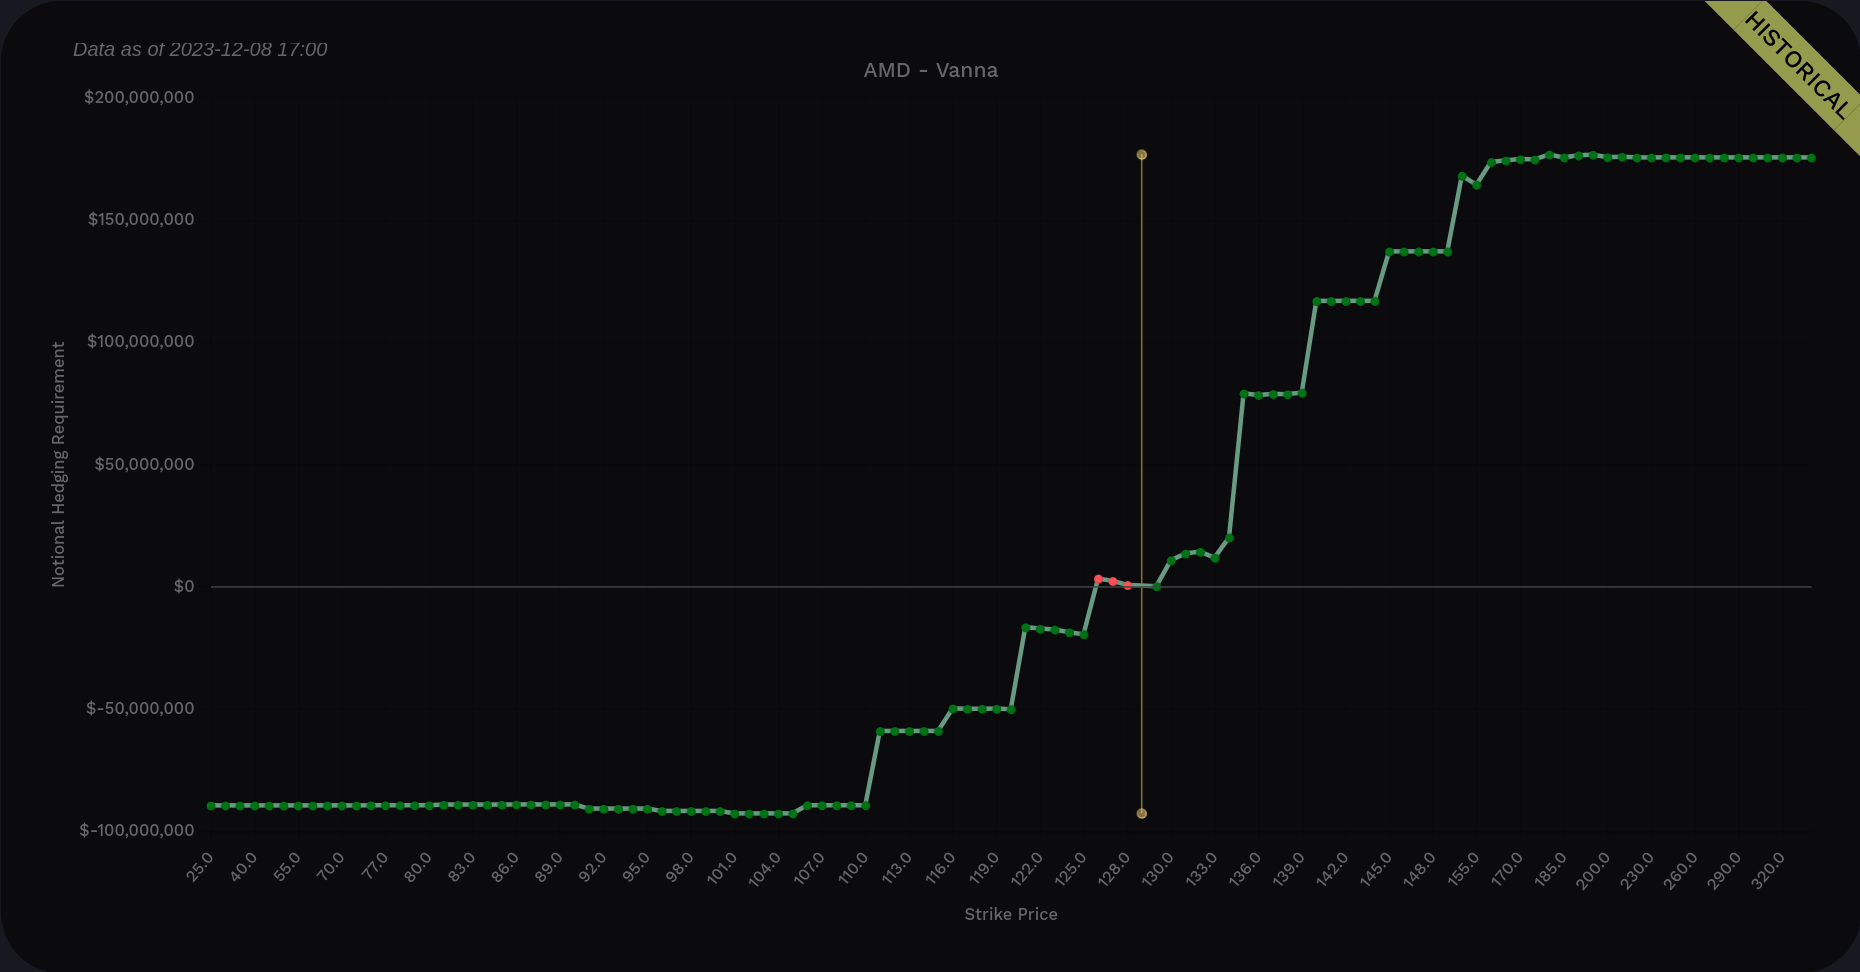
AMD vanna data from Volland across all expiration dates
As far as the bars go, we have strong positive vanna to $150 with more developing at $160. As a reminder, $164.46 is AMD's all time high and it was touched in November 2021. $135 is the tallest bar and is our likely target in the short term.
What if we exclude 12/8 and 12/15?

It looks like that negative vanna is here to stay with us past OPEX.
Gamma
Volland's delta-adjusted gamma suggests we have our strongest selling pressure around $135 and it gradually reduces from there. $120 and $125 show up as dealer buying levels with a very localized effect.

Institutional trades
Volume Leaders was loading pages this morning, but the charts were blank. I'll have to check in on this later. 🤷♂️
Charts
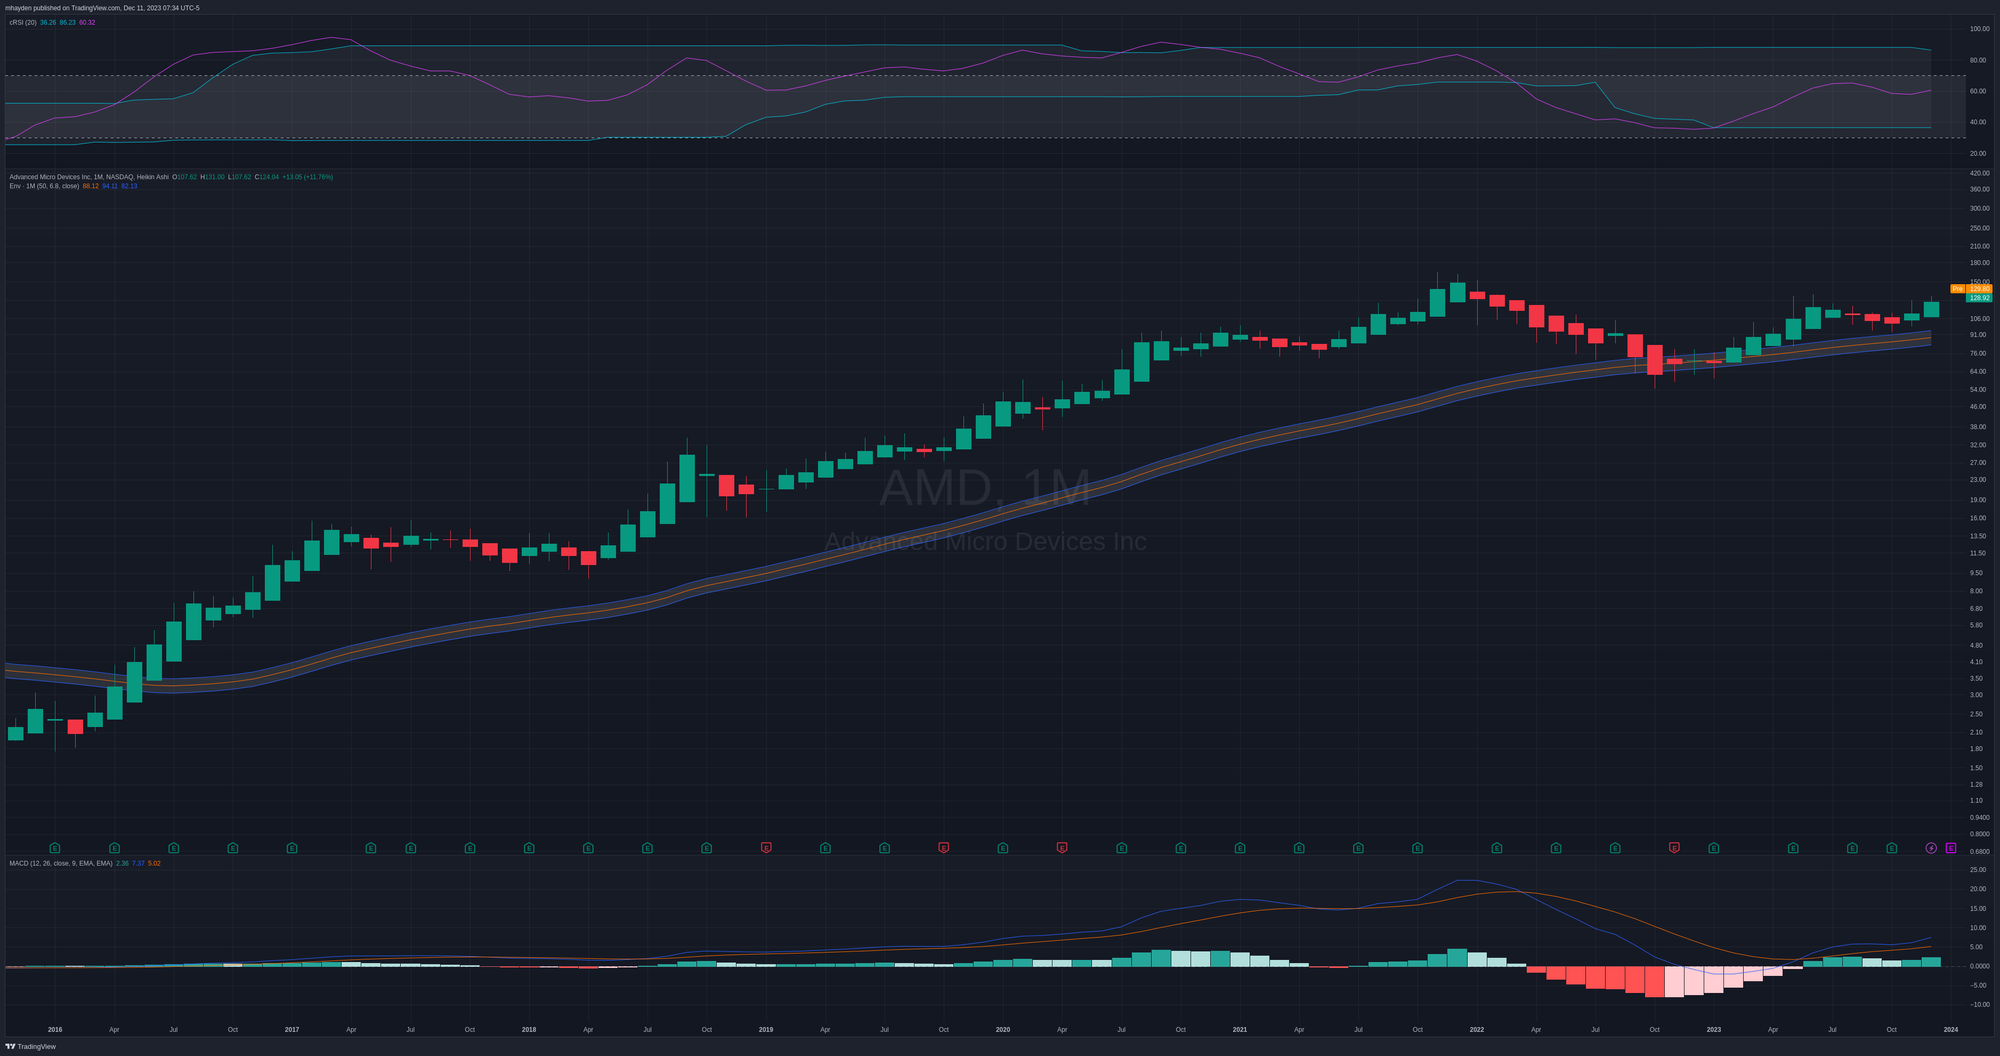
Let's start by zooming all the way out to a monthly chart and overlaying a 50-month moving average with a 6.8% envelope around it (one of Chris Ciovacco's favorite long term metrics). Let's break this down:
- MACD is positive with the fast line above the slow line and a growing histogram 🐂
- RSI sits about halfway up its channel with room to move in either direction. 🐂
- AMD revisited the 50-month line in the middle of 2022 and has lifted off once more. 🐂
- AMD has its first bullish monthly candle with no bottom wick. It would be nice to complete this candle and catch another one right after. 🤞
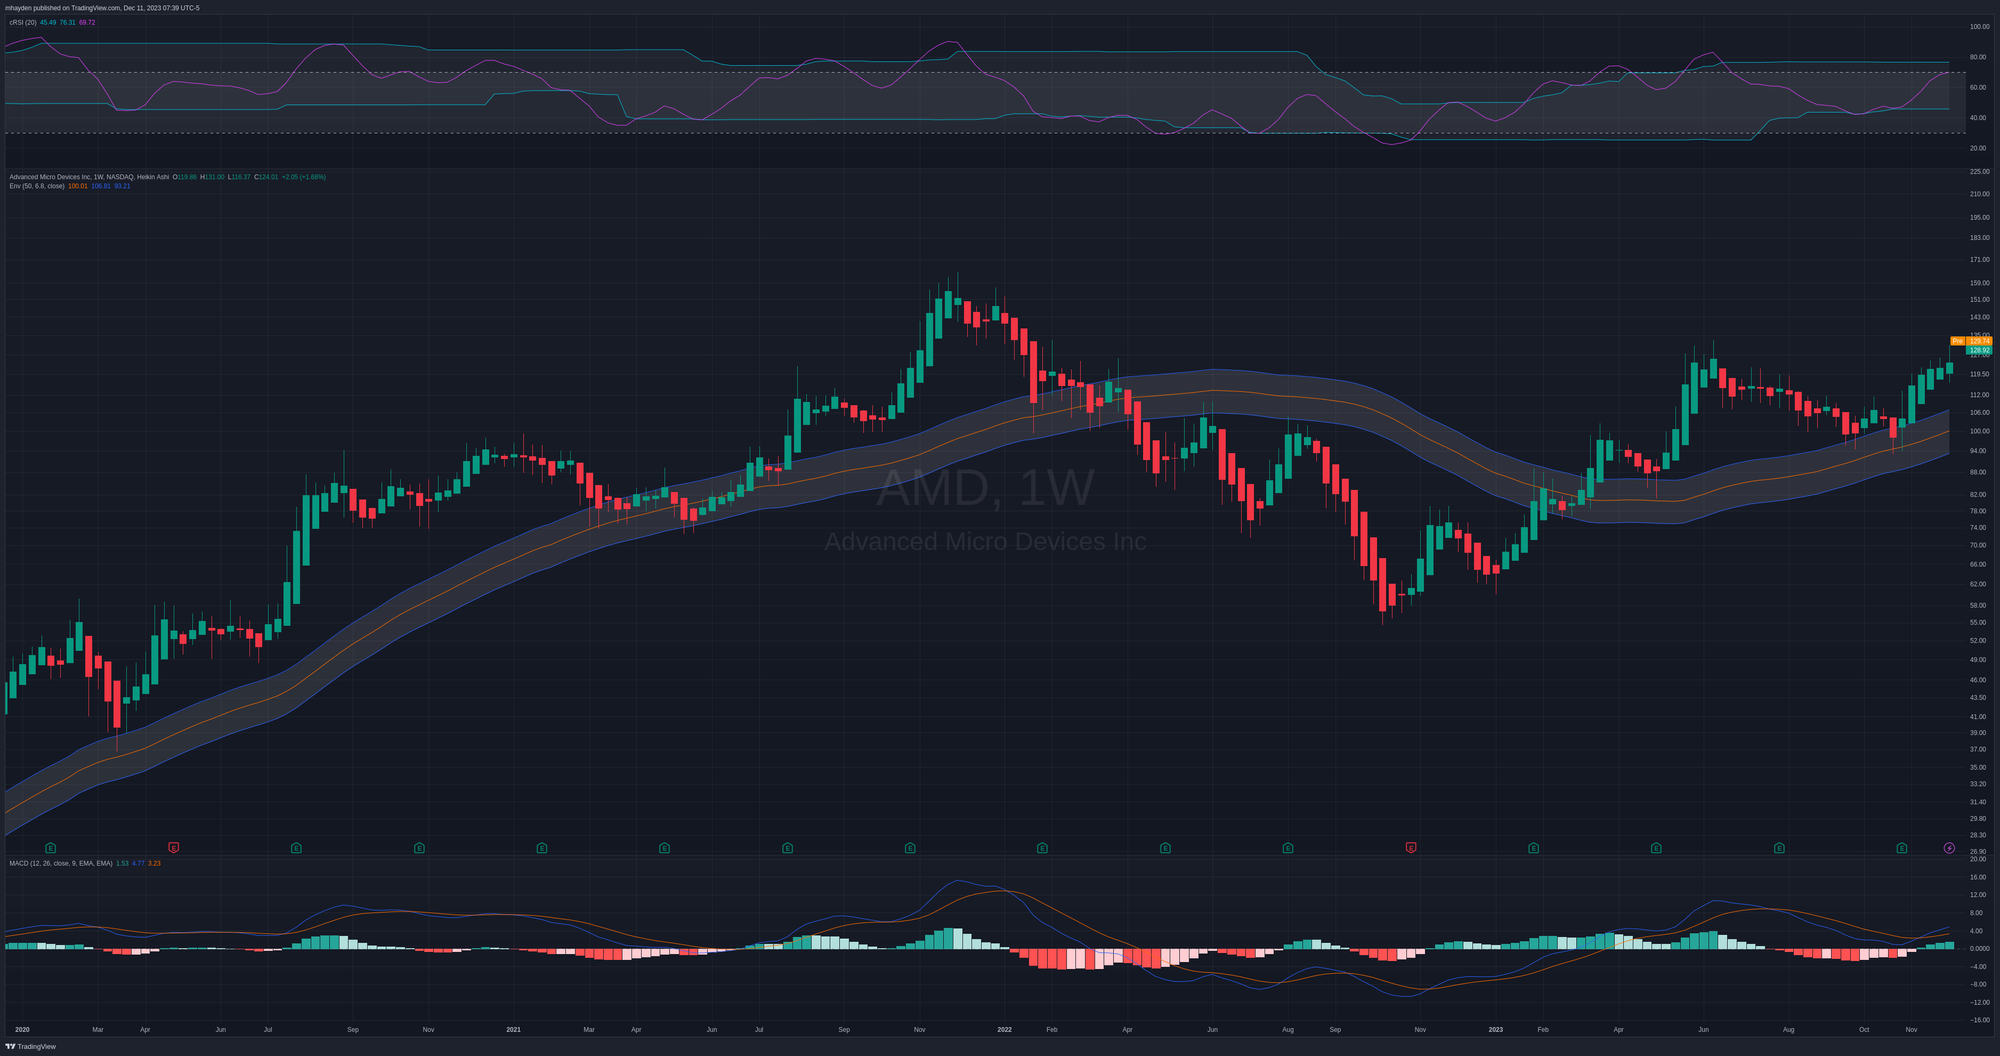
AMD's weekly chart looks a bit different. MACD still looks strong and is strengthening. AMD lifted off the 50-week moving average envelope with some bullish Heikin Ashi candles but last week formed a doji (indecision). RSI is pretty high in the channel at 69% and the top of the channel is at 76%.
This chart says to me: "AMD is strong but we might need some consolidation time before running higher."
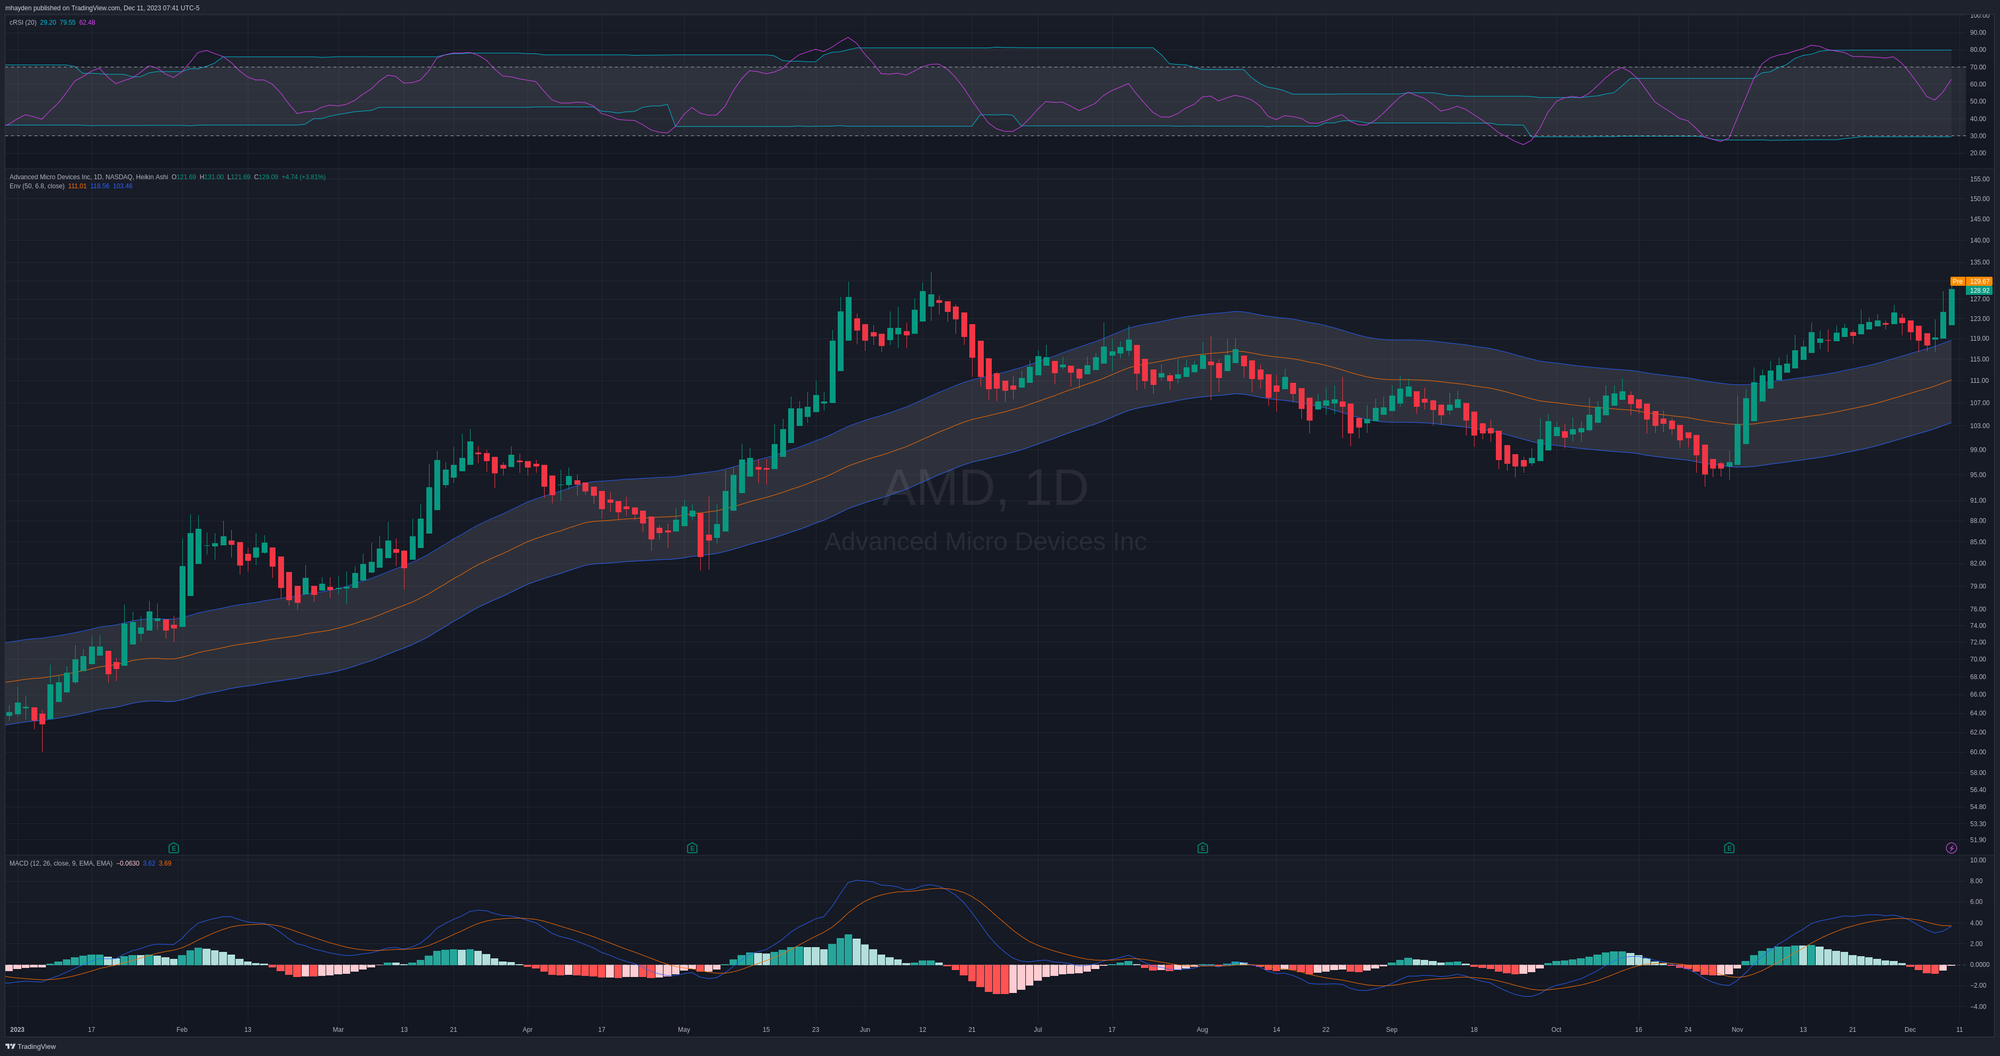
The daily chart for 2023 tells a similar story. We busted out of the top of the 50-day envelope and we're using the top of the envelope as support. A MACD bullish cross looks to be underway and the RSI still has some room to climb.
Thesis
AMD shows some incredible strength recently that appears on all time frames. Vanna has marched forward in a bullish manner over the past two weeks. AMD does seem to be running slightly warm but doesn't look overbought to me yet. I'd love to see a consolidation before a move higher and a move to $160 would be fantastic. Support comes in via the chart, vanna, and gamma around $120-125.
I'm holding far too many AMD shares right now that I picked up during the summer by selling puts and getting assigned. All of my shares are covered going into 12/15 and I'm very likely to be assigned on all of them. However, with my cost basis in the $80's, I'm not too worried about locking in some profits before the holidays. 😉
If AMD starts to consolidate, I might look to sell some puts in the $120-$125 area.
Good luck to everyone today! 🍀


Discussion