AMD stock and options analysis for December 4th

AMD finally broke the $120 curse, but where is it going now? 🤔

Happy Monday! 🌅 I'm back this morning with another look at one of my favorite stocks: AMD. It seems like it finally broke free of the $120 curse but I'm not sure how long it will hold that level.
All investments come with significant risks, including the loss of all capital. Please do your own research before investing, and never risk more than you are willing to lose. I hold no certifications or registrations with any financial entity.
Let's dig into the data and see what's there.
Vanna
AMD ticks many of the bullish vanna boxes here. The curve shows a steep upwards curve on the right side which should be a magnet for price if implied volatility remains calm or drops. However, I'd really like to see more positive vanna below price.
As we saw from yesterday's Charts & Coffee, there's a strong downward move underway in VIX futures which suggests volatility has more room to crunch. AMD's curve suggests that a move like that will pull AMD's price upwards.
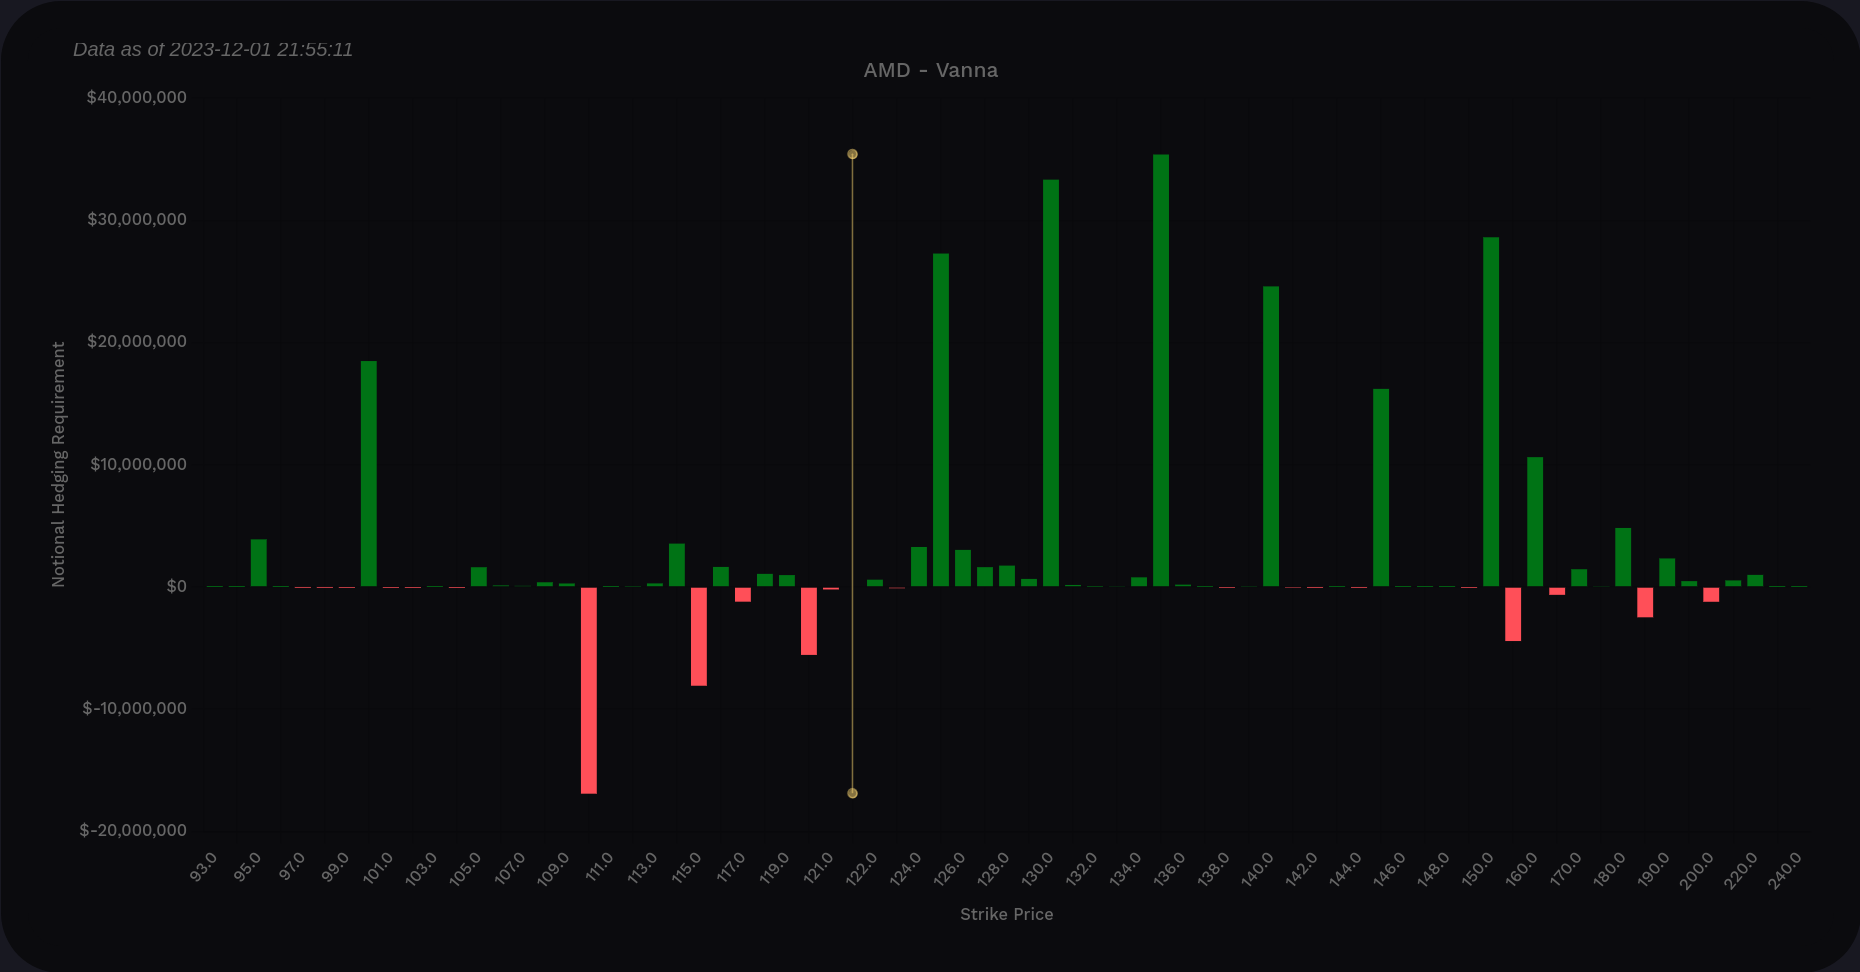
If we go up, where do we go? There are targets from $125 through $150 on the $5 increments. It looks like we recently tapped the $125 and slid backwards a little (more on that in the charts later).
If we head down, we might get some help at $110 and $100. $110 is a bit special thanks to a weekly VWAP line and $100 is a huge psychological level.
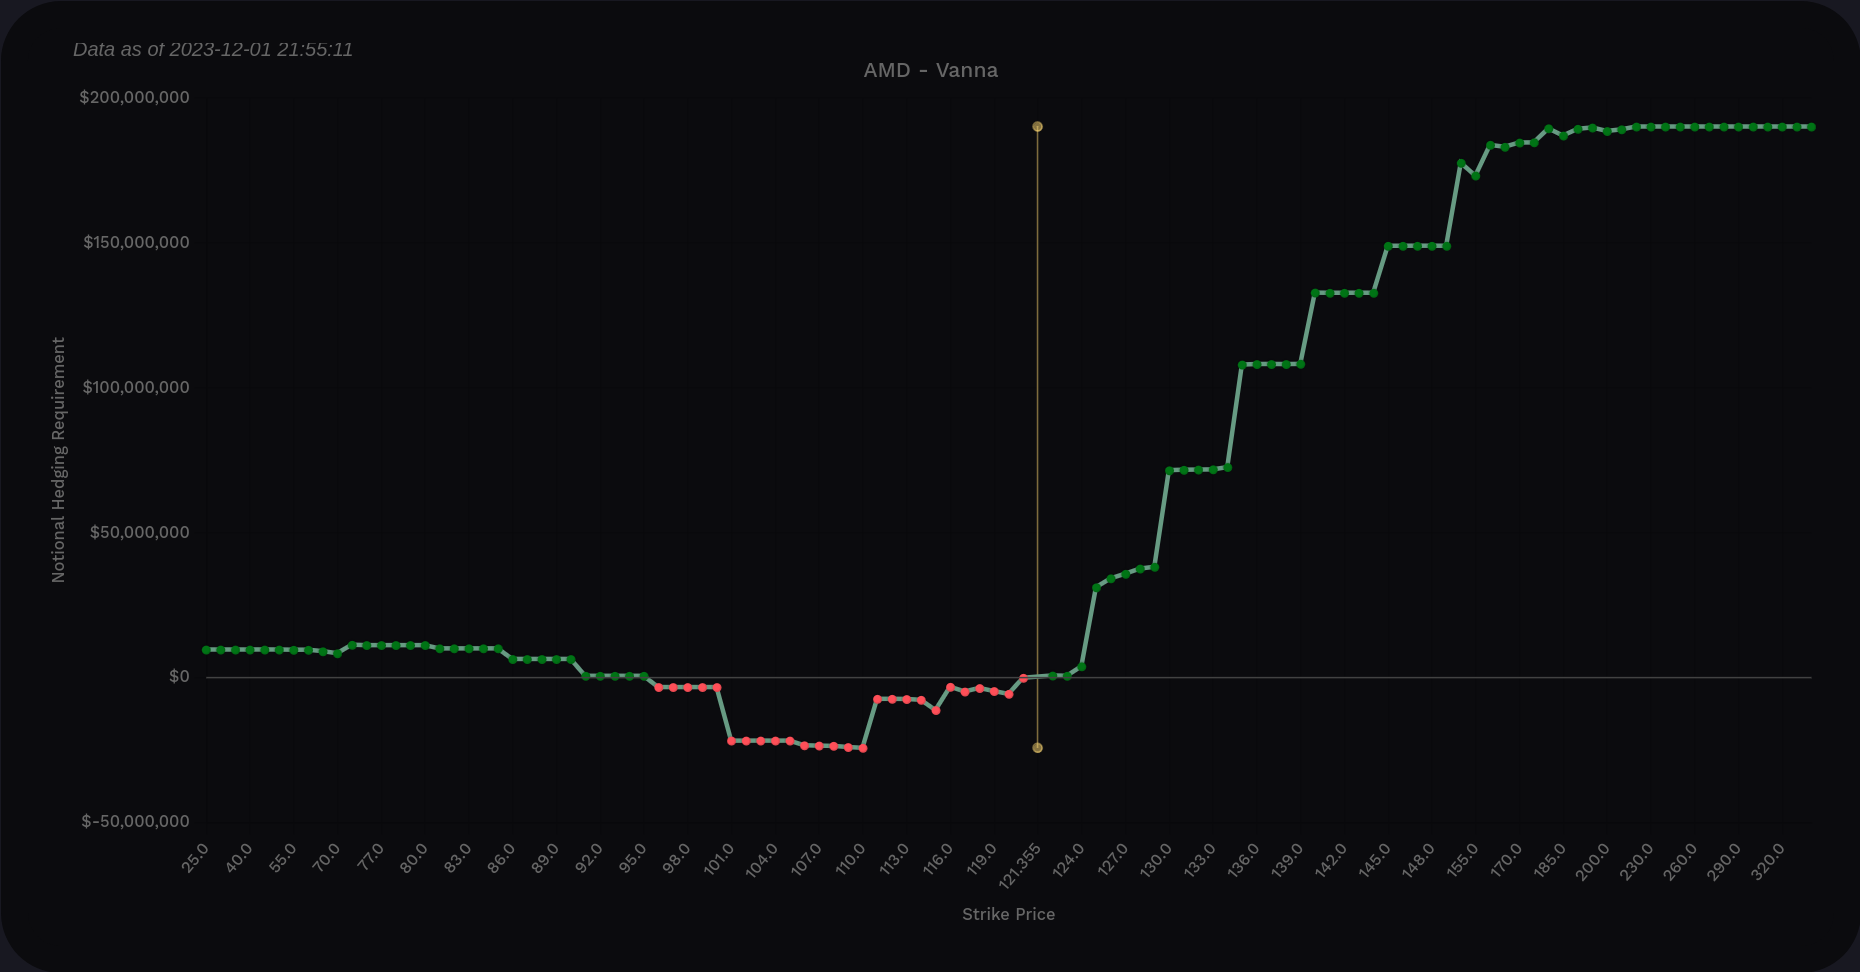
Most of my trades are focused around 1/19 and the chart doesn't look much different for January:
We have a little less vanna above $130 and our negative vanna below the price is smaller. Everything else looks the same.
Gamma
Volland's delta-adjusted gamma (DAG) makes things easier by flipping the gamma above price so you can view the chart as "green means dealers buy, red means dealers sell."
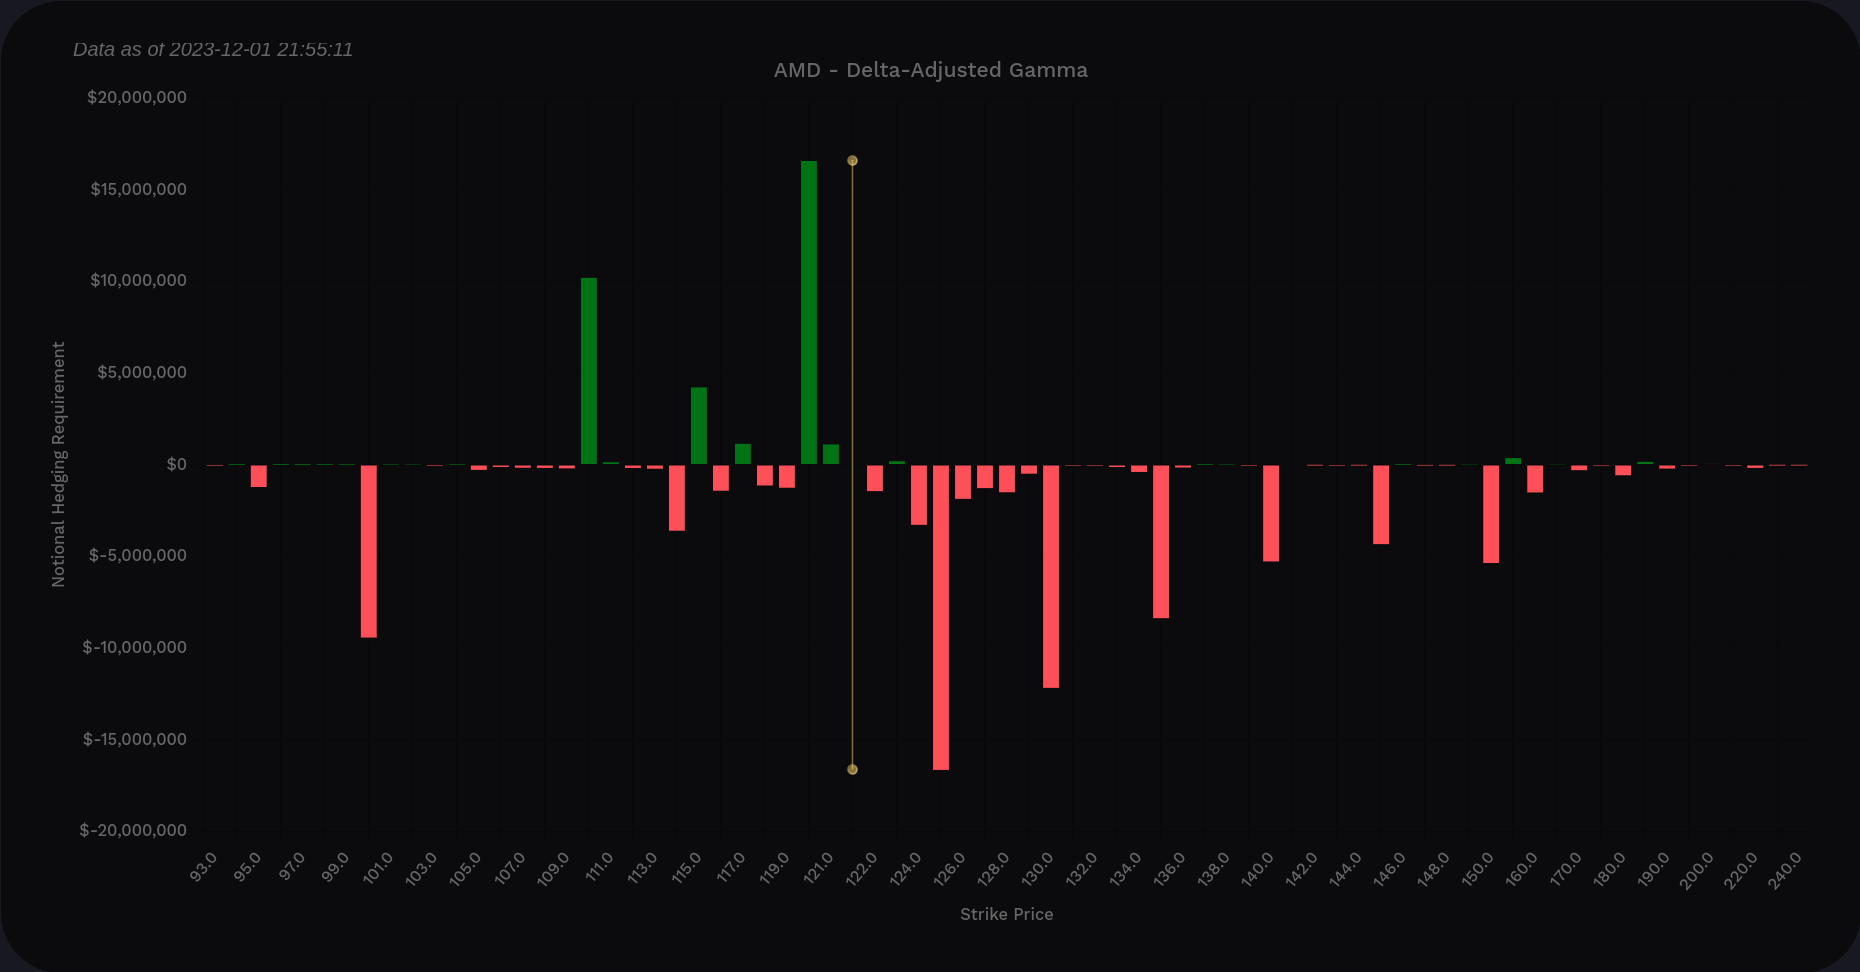
We see that $120 is likely to be repellent for price moves down and we may have support there and at $110. Above price, we have the most selling strength at $125 but then it eases once we pass that level. It gets even easier to move up as price crosses $130, $135, and so on.
Institutional trades
The Volume Leaders platform is great for tracking big levels of institutional trades on various ETFs and equities. Although it doesn't show directionality, it shows the levels where institutional traders are active.
Here's a chart of AMD over the past year where the largest trades were made. The numbers in each bubble are the rank of those trades relative to all other large trades made on AMD.
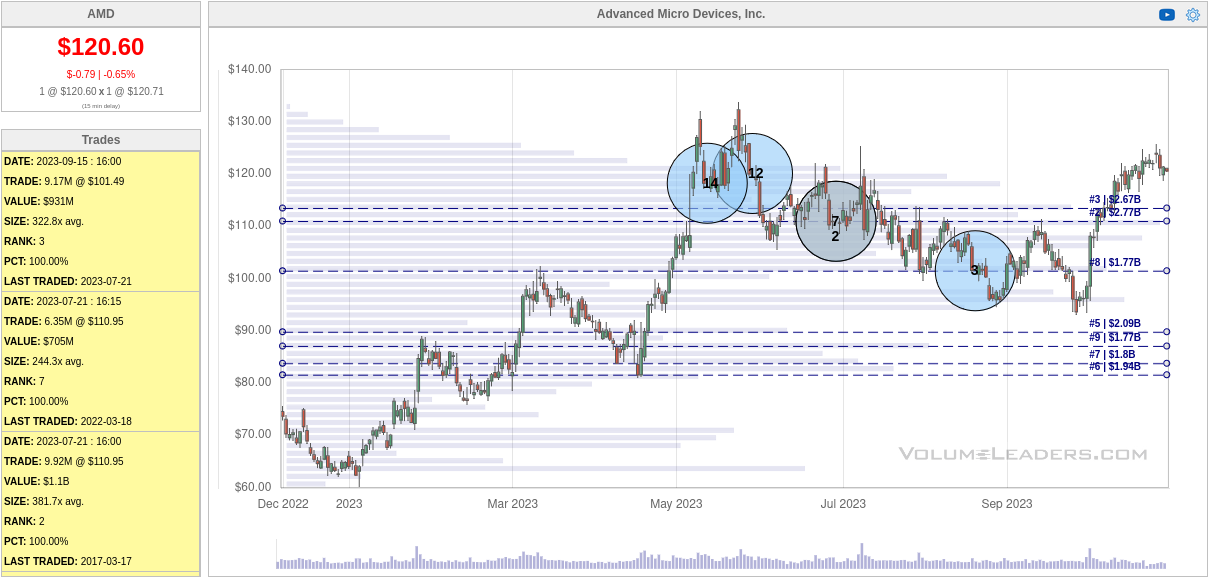
#12 and #14 came in around $120. #2 and #7 happened around the $110 level. Then #3 came in at $100 shortly before AMD went through the roof (after touching the $90's).
From top down, we have some huge levels at $113, $111, $100, and $90. These line up with some of the vanna levels we saw earlier.
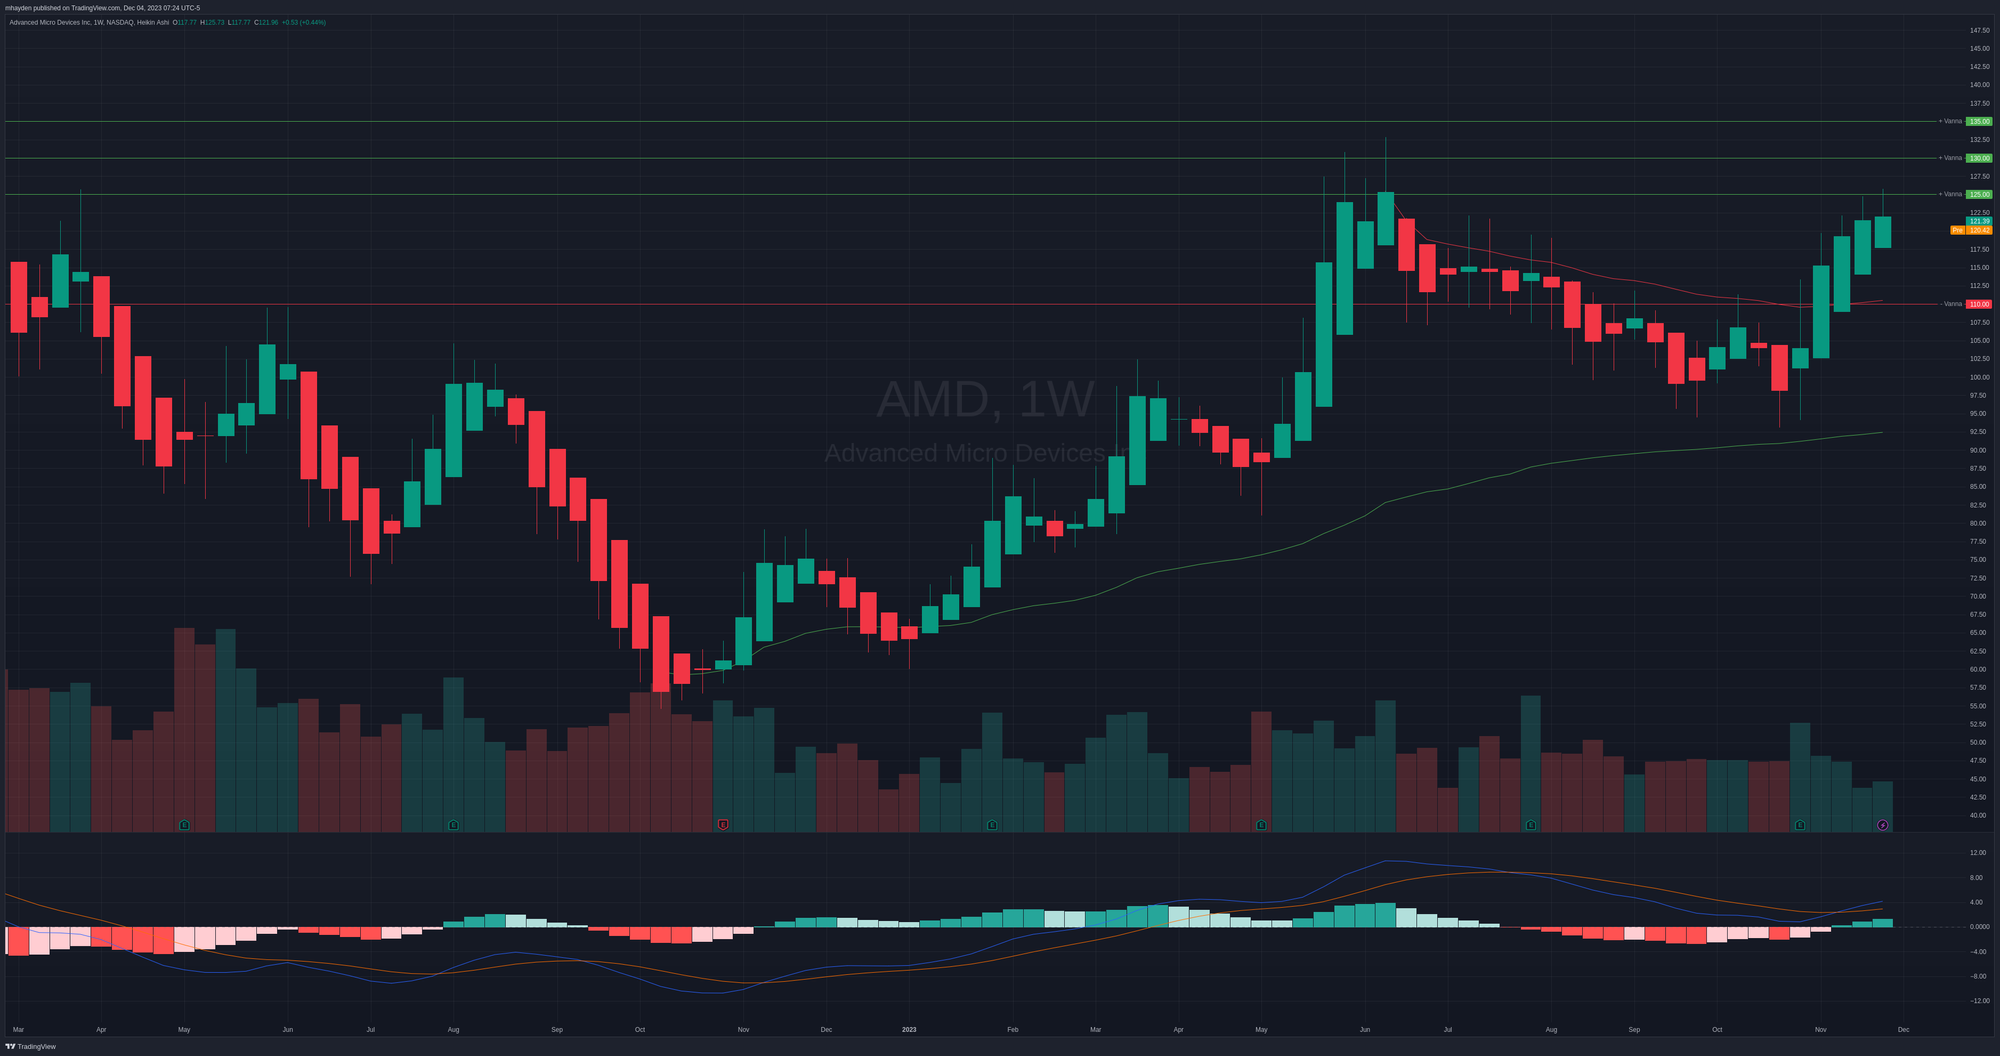
Chart
AMD's weekly chart looks strong but it also looks like it's getting tougher to move up. I've added the vanna levels to my chart here to make it easier to see. Price ran up to the $125 level two weeks in a row and then bounced back down. However, the MACD is still above zero and we recently made a bullish cross there.
There are two VWAP lines from recent highs and lows. AMD bounced just above the lower VWAP line back in October and blew through the top VWAP line with a big move in November. Notice how the negative vanna at $110 matches up almost perfectly with that VWAP line. I love to see this kind of correlation. ♥️
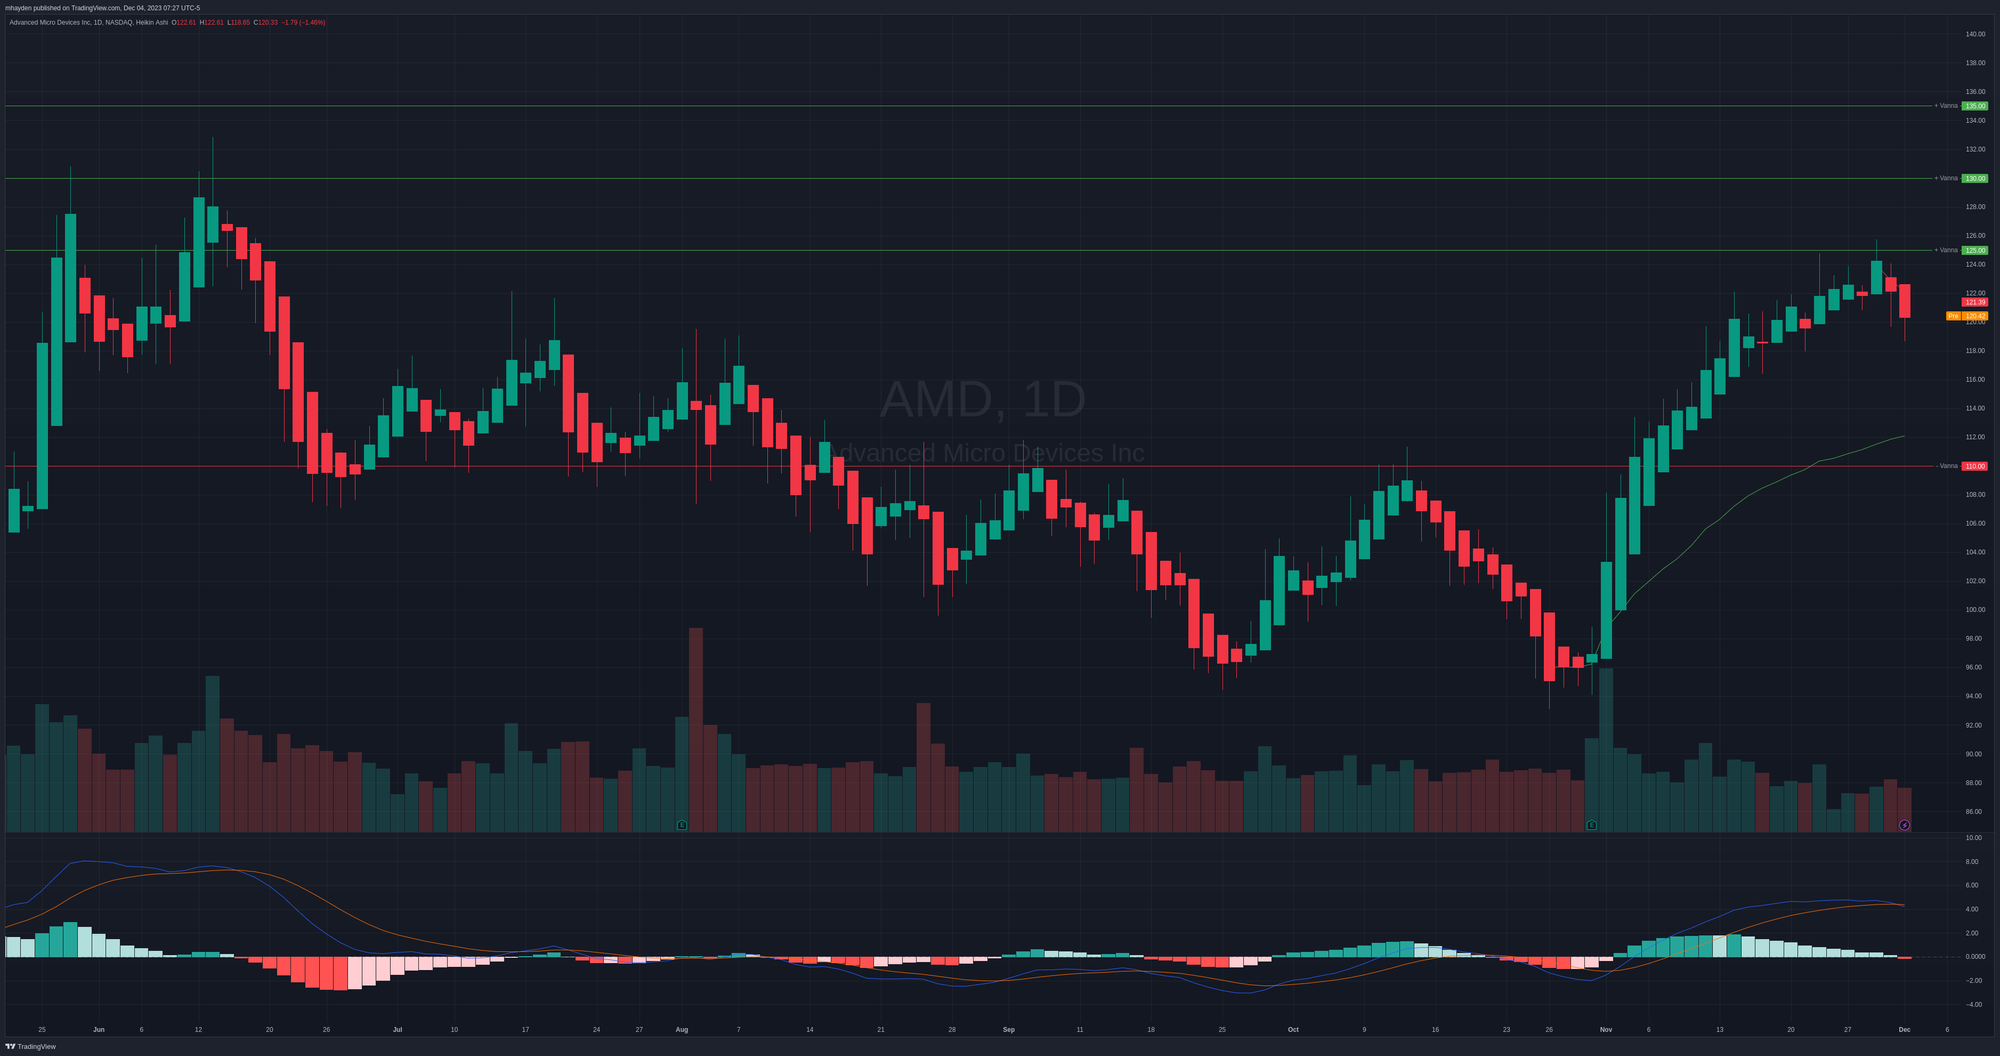
How about the daily? This tells a better story of what's been happening lately.
AMD ran to the $125 vanna level and struggled. It was very overextended through November and it's clear that we need some consolidation or a pullback. I don't think we will see a correction here, but a pullback is definitely warranted.
Where might that pullback go? Well, we have that $110 level that shows up on institutional trades, vanna, gamma, and the weekly VWAP. The daily chart suggests it could be a little higher, perhaps around $112. The $112 level is right in the middle of two huge institutional trading levels.
Thesis
AMD's long term trend looks great. However, AMD looks like it needs a break in the shorter term. I'd bet on something around $111-$113 being the level we pull back to before consolidating or moving higher. It's difficult for me to remember a time since AMD had a vanna chart that looked this bullish.
My suggestion would be to watch what happens when AMD approaches $110. If it looks like it's having bullish interactions with the VWAP, that could be a time to open a long position. It should look something like what we're seeing now at $125, but upside down.
I'm sitting on far too many shares of AMD at the moment from getting assigned on some puts when AMD dropped earlier this year and I have covered calls sold at $110, $115, and $120 for 12/15. I'm happy to get assigned on those and lock in some profits.
My AMD cost basis is around $89 at the moment from selling short puts and covered calls. Don't fear the wheel! 😉
Good luck to everyone today! 🍀
Discussion