AMD analysis for 10/2

AMD has earnings coming up on 10/31. 🎃 It seems like we're stuck in another channel until then.

Happy Monday! If you missed the chart analysis for AMD from yesterday's Charts & Coffee, go back and read it! It pairs well with the options data that I'll look into today.
Also, how about those Houston Astros! ⚾ 🎉

Sorry! Had to get that out. 😉
All investments come with significant risks, including the loss of all capital. Please do your own research before investing, and never risk more than you are willing to lose. I hold no certifications or registrations with any financial entity.
Let's get started!
Options flow
Net options flow gives me a good idea of trading momentum and AMD certainly has some bullish flow over one and five day intervals. However, take a look at the gap between the lines here. There's not a lot of difference between call and put premium levels. I'd much rather see a gap of 8-10M in premiums on the five day, but we're looking at about 4M here.
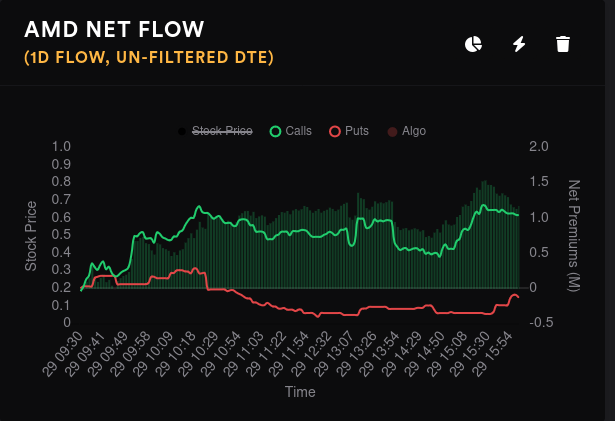

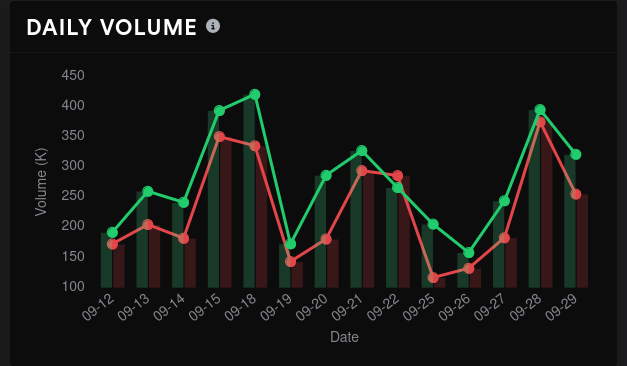
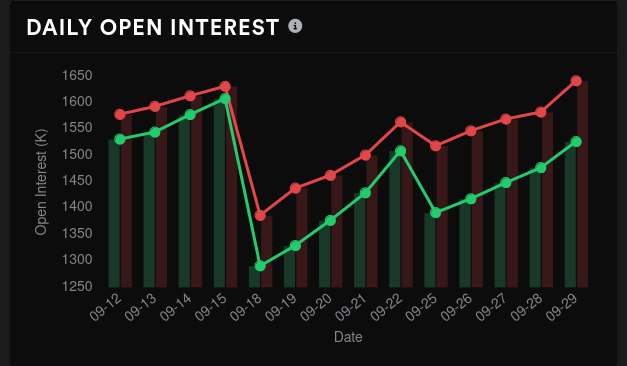
This goes along with the chart that suggests we have the ingredients for a rally but it hasn't taken off yet. Friday had reduced options volume but an increase in open interest:
Dealer positioning
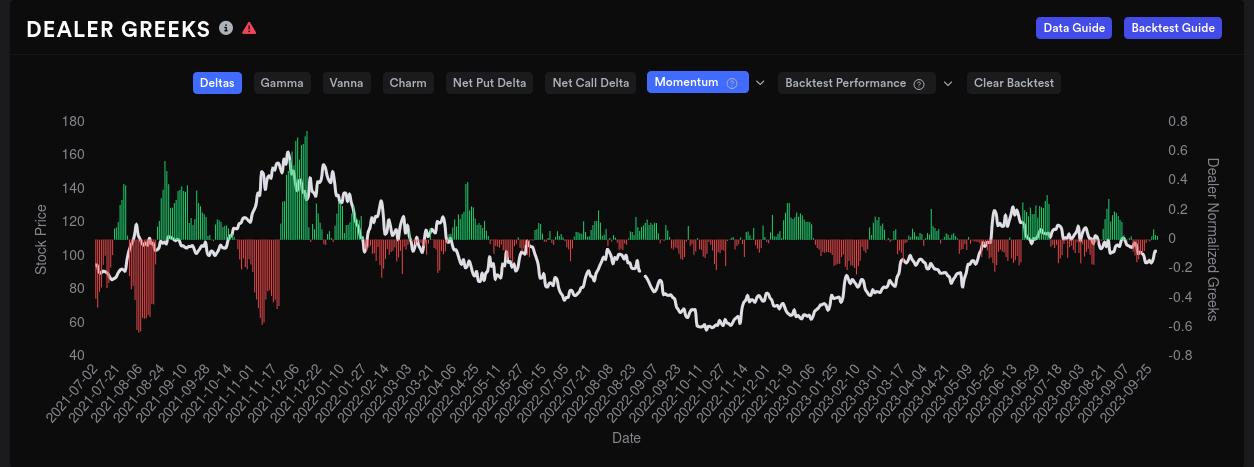
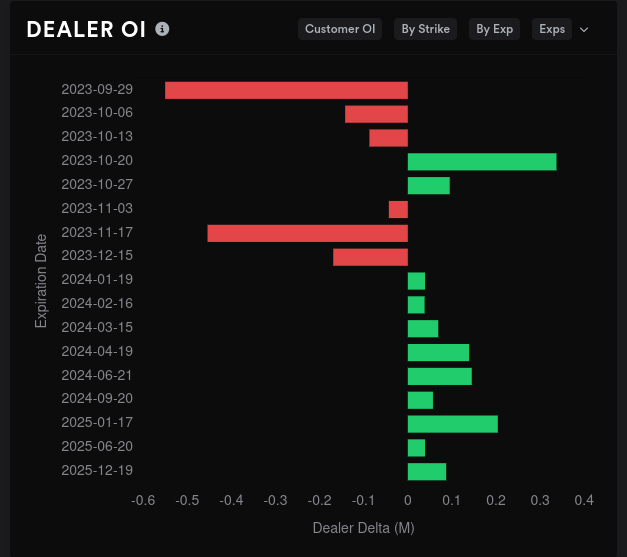
AMD's dealer delta buildup over a 15 day momentum is very close to the middle line. Dealers are leaning slightly long right now and that suggests customers are net short by a small amount. This has moved more bullish by small amounts since the middle of last week.
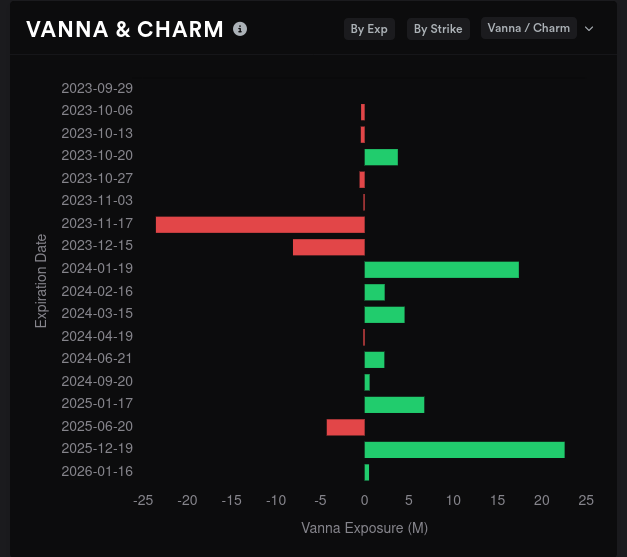
Much of the data here is still left over from Friday but I'm eager to see where traders rolled these trades for this week. 10/20 has a bearish lean, but 11/17 comes back with some bullish customer bets. 11/17 also has very negative vanna and that suggests a drop in IV might not translate into an AMD rally.
Gamma exposure
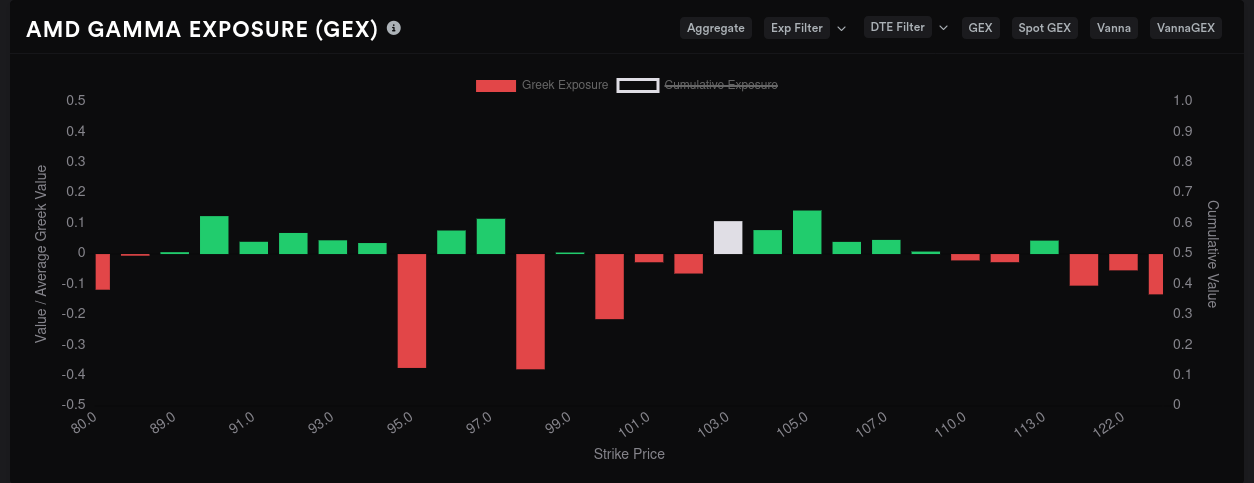
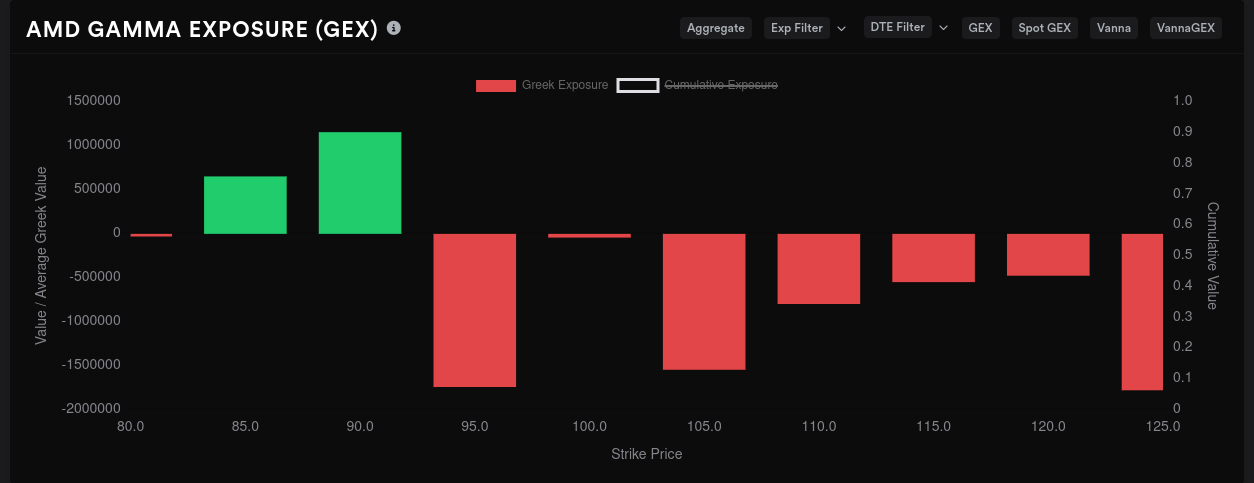
Aggregate GEX suggests $95 and $98 as the biggest price targets, but this still contains some data from 9/29. We should find out where market participants rolled theit contracts laster this morning. Resistance is quite light on this chart.
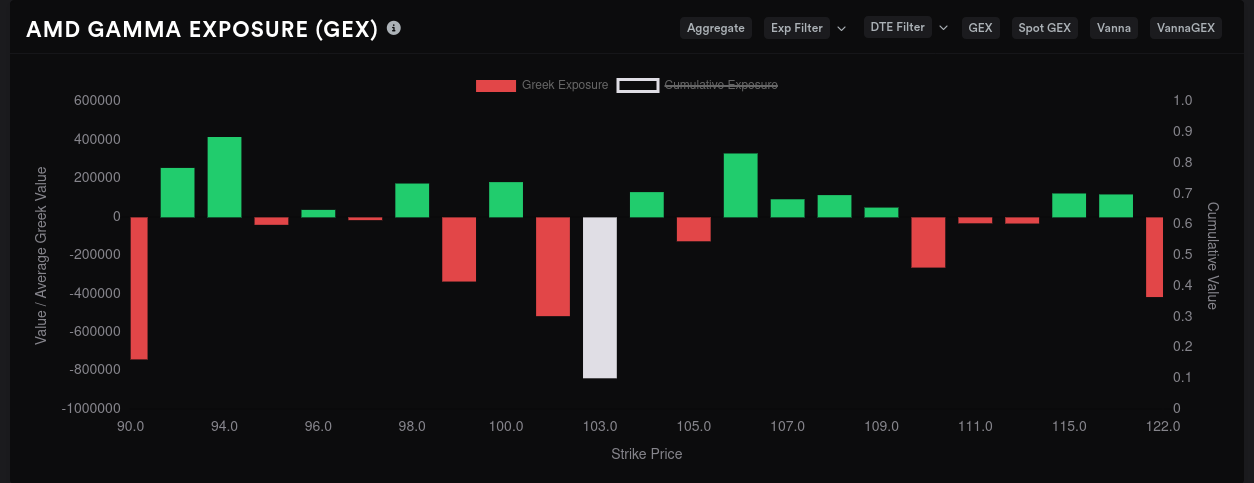
Data for 10/6 suggests we're either going to $90 or $102-$103. We pick up some small downside resistance around $94 and some upside resistance around $106.
AMD has earnings on 10/31 🎃 and traders are lining up their bets already. $125 looms pretty larger here, but there's a good amount of room to run from $95-$125. I still have doubts about AMD passing the $118-$120 level with ease unless there's a big shift in market sentiment after earnings.
Whales
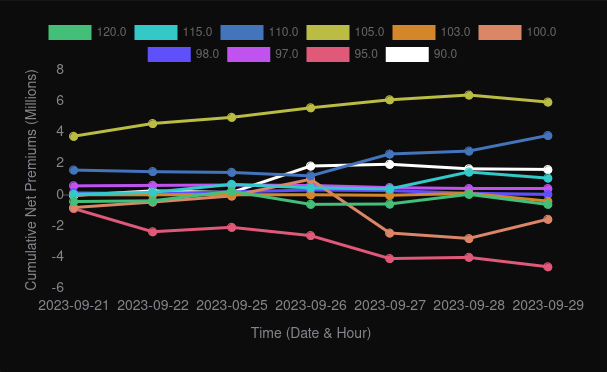
Traders that throw big bets on AMD look to be bullish on $105 on aggregate. $95 continues to get bearish attention at a slow, but steady rate.
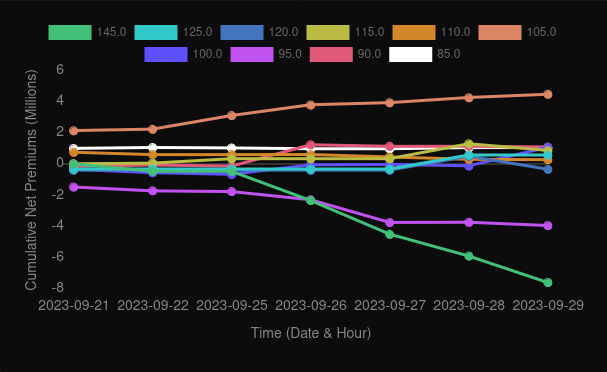
Whales aren't feeling good about $145 and it's been on a steady bearish decline. $105 is bullish here again with $95 sinking a bit and holding steady.
Dark pool volume
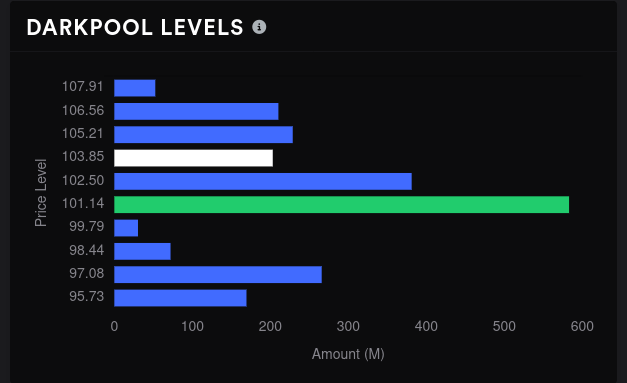
The biggest volume level for dark pool trades remains near $101.
Chart
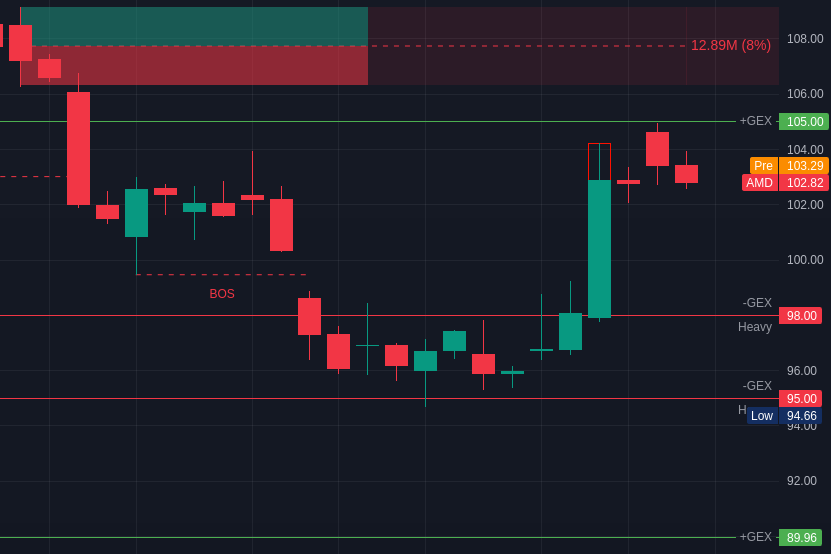
Although we dug into AMD's chart in detail yesterday, it bears repeating that we might be stuck in a small channel here. That bearish liquidity grab on Thursday morning was a slightly bearish signal just as we approached a line of positive GEX.
As a reminder, positive GEX is usually a spot where price is repelled (in both directions) and negative GEX attracts like a magnet. Negative GEX can sometimes add fuel to a price movement as it did on Thursday morning.
All of AMD's unmitigated order blocks are above the current price. They're centered on $108, $112, $118, and $131. They get stronger the higher that you go up in price. These could be resistance levels for AMD, but they could be a spot where AMD could retest and head higher (just as it did last week).
Thesis
Although I'd love to see AMD clear $105 and move higher, I can't find much evidence that it's possible in the short term unless something in the overall market changes. The broader market is going through a correction right now and that removes some fuel from a potential rally. However, if something changes with interest rates, the overall economy, or something bigger in the semiconductor sector, AMD has the potential to do well.
I'm betting that we get a retrace lower, but not past $90. $95-$101 seems like a zone that is well supported by the chart, by options data, and dark pool data.
As for my trades, I'm trading AMD in the mostly short term pre-earnings. I have about 80% of my AMD shares covered with calls right now and I have a short put at $85. My cost basis is near $92, so I have some freedom to sell calls in the current price area at a decent profit, even if I get assigned.
Good luck to everyone today! 🍀
Discussion